2026 National 5 Biology - Paper 2 questions
Source: Scottish Qualifications Authority (SQA) / Qualifications Scotland. This is a StemInteract HTML companion, not an official HTML edition. Selectable text is supplied alongside original page images. Use the images or original PDF for equations, powers, fractions, vector notation, tables and diagrams; text extraction cannot fully preserve mathematical layout.
Jump to a question
PDF page 1
Selectable page text
FOR OFFICIAL USE
N5
National
Qualications
Mark
2026
X807/75/01 Biology
Section 1 — Answer Grid
and Section 2
TUESDAY, 28 APRIL
1:00 PM – 3:30 PM
*X8077501*
Fill in these boxes and read what is printed below.
Full name of centre Town
Forename(s) Surname Number of seat
Date of birth
Day Month Year Scottish candidate number
Total marks — 100
SECTION 1 — 25 marks
Attempt ALL questions.
Instructions for the completion of Section 1 are given on page 02.
SECTION 2 — 75 marks
Attempt ALL questions.
Write your answers clearly in the spaces provided in this booklet. Additional space for answers
and rough work is provided at the end of this booklet. If you use this space you must clearly
identify the question number you are attempting. Any rough work must be written in this
booklet. Score through your rough work when you have written your final copy.
Use blue or black ink.
Do not remove any exam materials. You must leave this booklet on
your desk; if you do not, you could lose all the marks for this paper.
*X807750101*
A/PB
© Qualifications Scotland 2026PDF page 2

Selectable page text
SECTION 1 — 25 marks

The questions for Section 1 are contained in the question paper X807/75/02.

Read these and record your answers on the answer grid on page 03.
Use blue or black ink. Do NOT use gel pens or pencil.

 1. The answer to each question is either A, B, C or D. Decide what your answer is, then fill in
    the appropriate bubble (see sample question below).

 2. There is only one correct answer to each question.

 3. Any rough working should be done on the additional space for answers and rough work at
    the end of this booklet.

Sample question
The thigh bone is called the

    A  humerus
    B  femur

    C  tibia
    D  fibula.

The correct answer is B — femur. The answer B bubble has been clearly filled in (see below).

  A    B    C     D

Changing an answer

If you decide to change your answer, cancel your first answer by putting a cross through it (see
below) and fill in the answer you want. The answer below has been changed to D.

  A    B    C     D

If you then decide to change back to an answer you have already scored out, put a tick (✓) to the
right of the answer you want, as shown below:

  A    B    C     D         A    B    C    D

                      or

                       *X807750102*

                              page 02
PDF page 3

Selectable page text
SECTION 1 — Answer grid

                          *OBJ25AD1*

     A     B    C    D

 1

 2

 3
 4

 5

 6

 7

 8

 9
10

11

12

13

14

15

16
17

18

19

20

21

22

23
24

25

 *X807750103*

        page 03                 [Turn over
PDF page 4

Selectable page text
[BLANK PAGE]

DO NOT WRITE ON THIS PAGE

*X807750104*

       page 04
PDF page 5
Paper 2, Question 1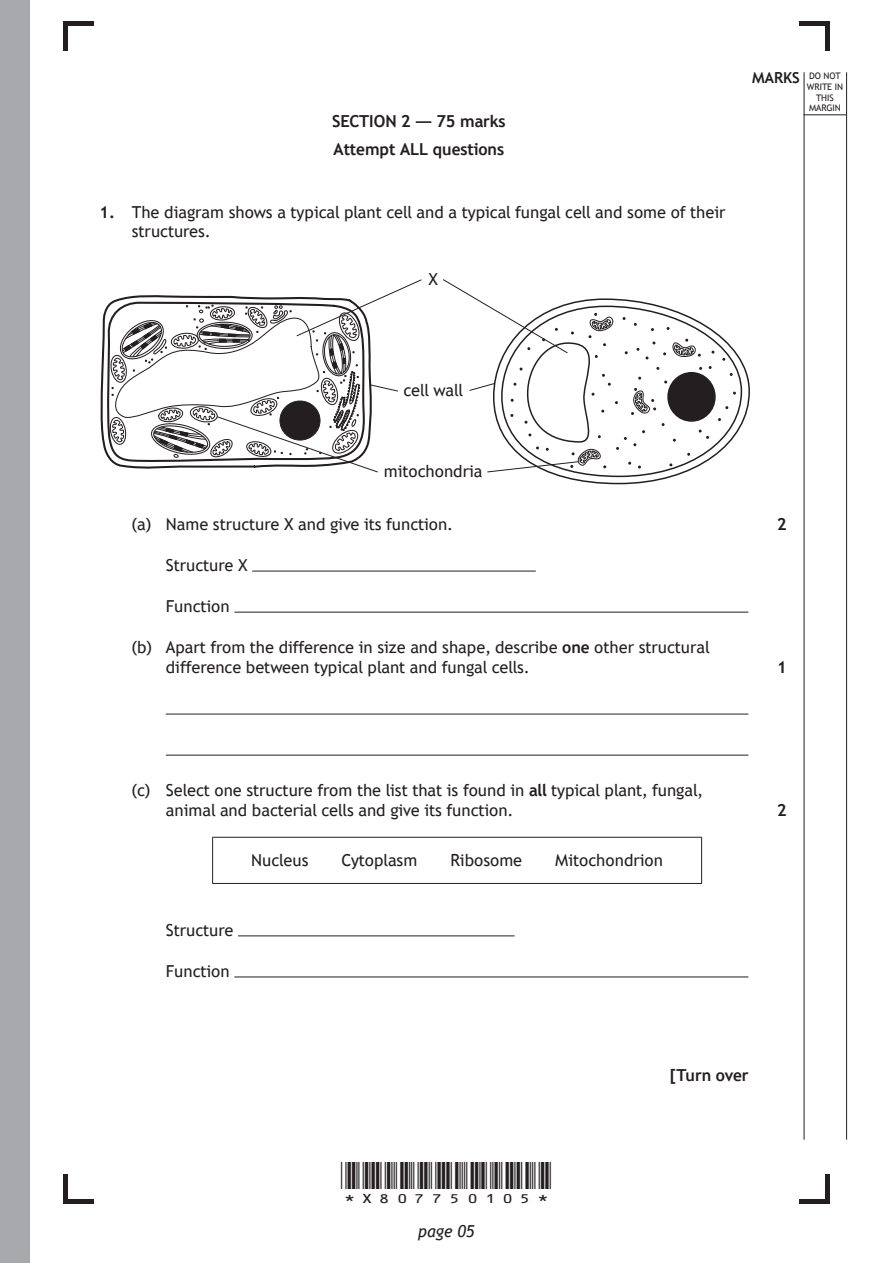
Selectable page text
MARKS _{W}^{D}_{R}^{O}_{I} _{T}^{N}OT
                                                                   E IN
                                                                  THIS
                                                                 MARGIN
                      SECTION 2 — 75 marks
                      Attempt ALL questions

1. The diagram shows a typical plant cell and a typical fungal cell and some of their
   structures.

                              X

                            cell wall

                          mitochondria

   (a) Name structure X and give its function.                2

      Structure X

      Function

   (b) Apart from the difference in size and shape, describe one other structural
      difference between typical plant and fungal cells.      1

   (c) Select one structure from the list that is found in all typical plant, fungal,
      animal and bacterial cells and give its function.       2

              Nucleus Cytoplasm Ribosome  Mitochondrion

      Structure

      Function

                                                     [Turn over

                      *X807750105*

                             page 05
PDF page 6
Paper 2, Question 2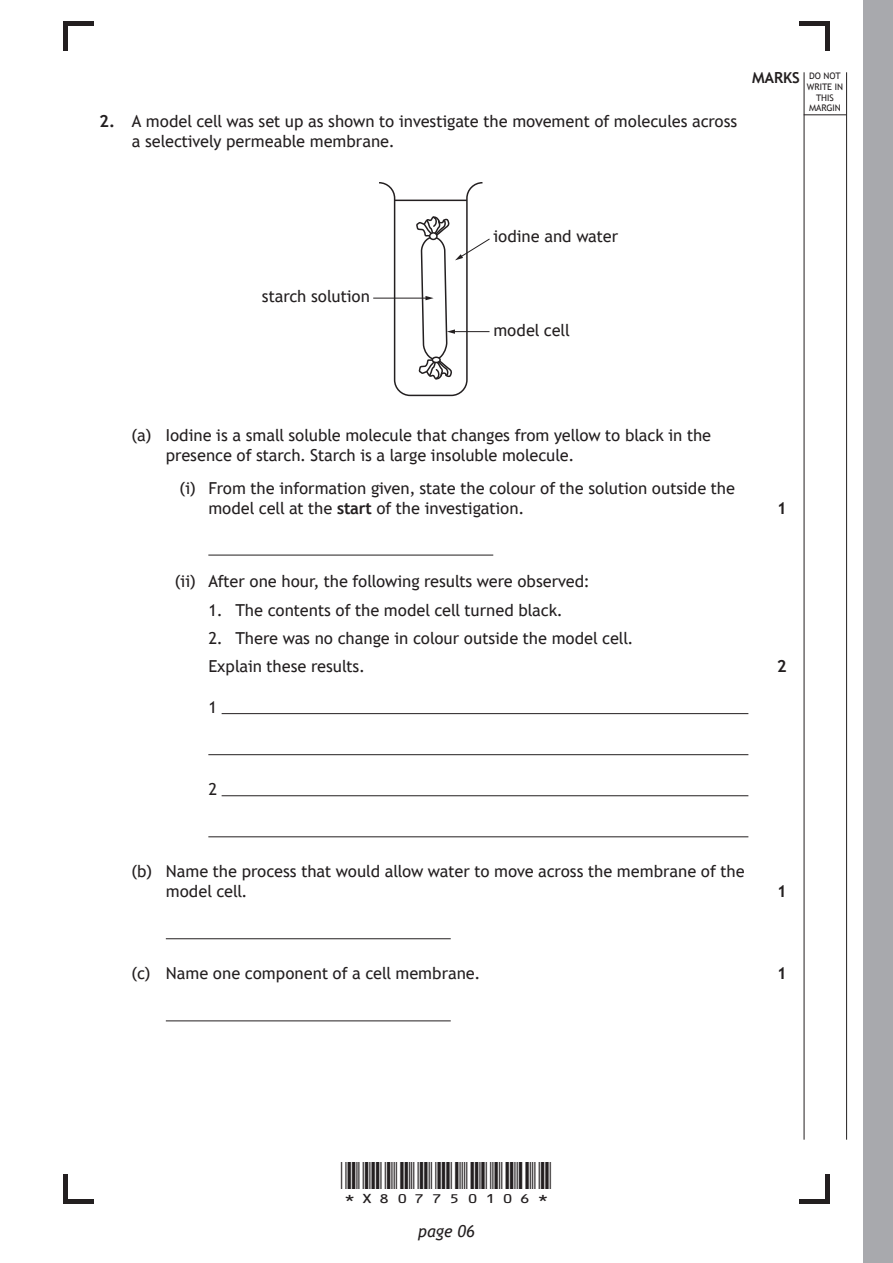
Selectable page text
MARKS _{W}^{D}_{R}^{O}_{I} _{T}^{N}OT
                                                                   E IN
                                                                  THIS
                                                                 MARGIN
2. A model cell was set up as shown to investigate the movement of molecules across
   a selectively permeable membrane.

                                    iodine and water

               starch solution

                                    model cell

   (a) Iodine is a small soluble molecule that changes from yellow to black in the
      presence of starch. Starch is a large insoluble molecule.

        (i) From the information given, state the colour of the solution outside the
          model cell at the start of the investigation.       1

       (ii) After one hour, the following results were observed:

          1. The contents of the model cell turned black.
          2. There was no change in colour outside the model cell.

          Explain these results.                              2

          1

          2

   (b) Name the process that would allow water to move across the membrane of the
      model cell.                                             1

   (c) Name one component of a cell membrane.                 1

                      *X807750106*

                             page 06
PDF page 7
Paper 2, Question 3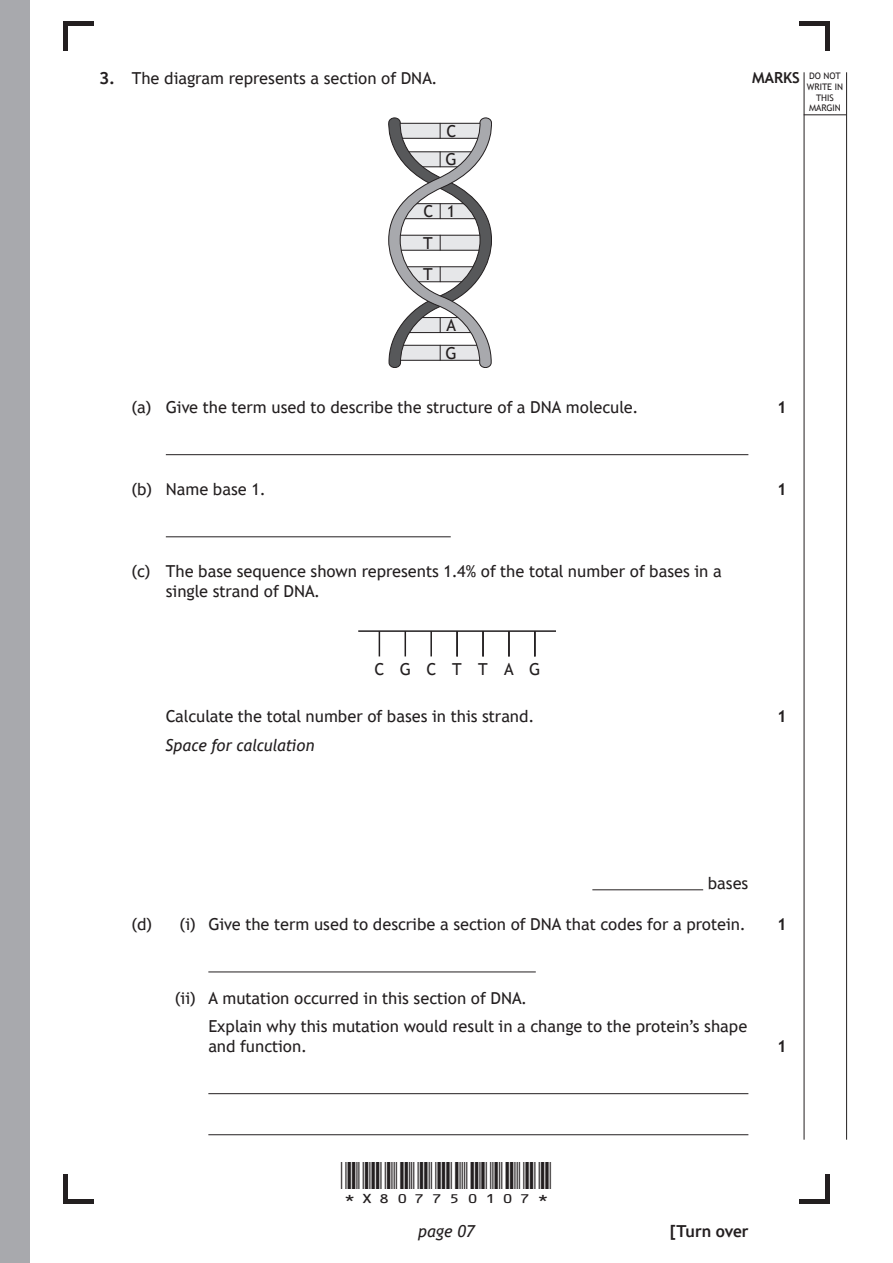
Selectable page text
3. The diagram represents a section of DNA.                 MARKS _{W}^{D}_{R}^{O}_{I} _{T}^{N}OT
                                                                   E IN
                                                                  THIS
                                                                 MARGIN
                                C
                                G
                              C 1

                              T

                              T

                                A

                                G

   (a) Give the term used to describe the structure of a DNA molecule. 1

   (b) Name base 1.                                           1

   (c) The base sequence shown represents 1.4% of the total number of bases in a
      single strand of DNA.

                         C  G C  T T A  G

      Calculate the total number of bases in this strand.     1

      Space for calculation

                                             ������������������������ bases

   (d)  (i) Give the term used to describe a section of DNA that codes for a protein. 1

       (ii) A mutation occurred in this section of DNA.
          Explain why this mutation would result in a change to the protein’s shape
          and function.                                       1

                      *X807750107*

                             page 07                 [Turn over
PDF page 8
Paper 2, Question 4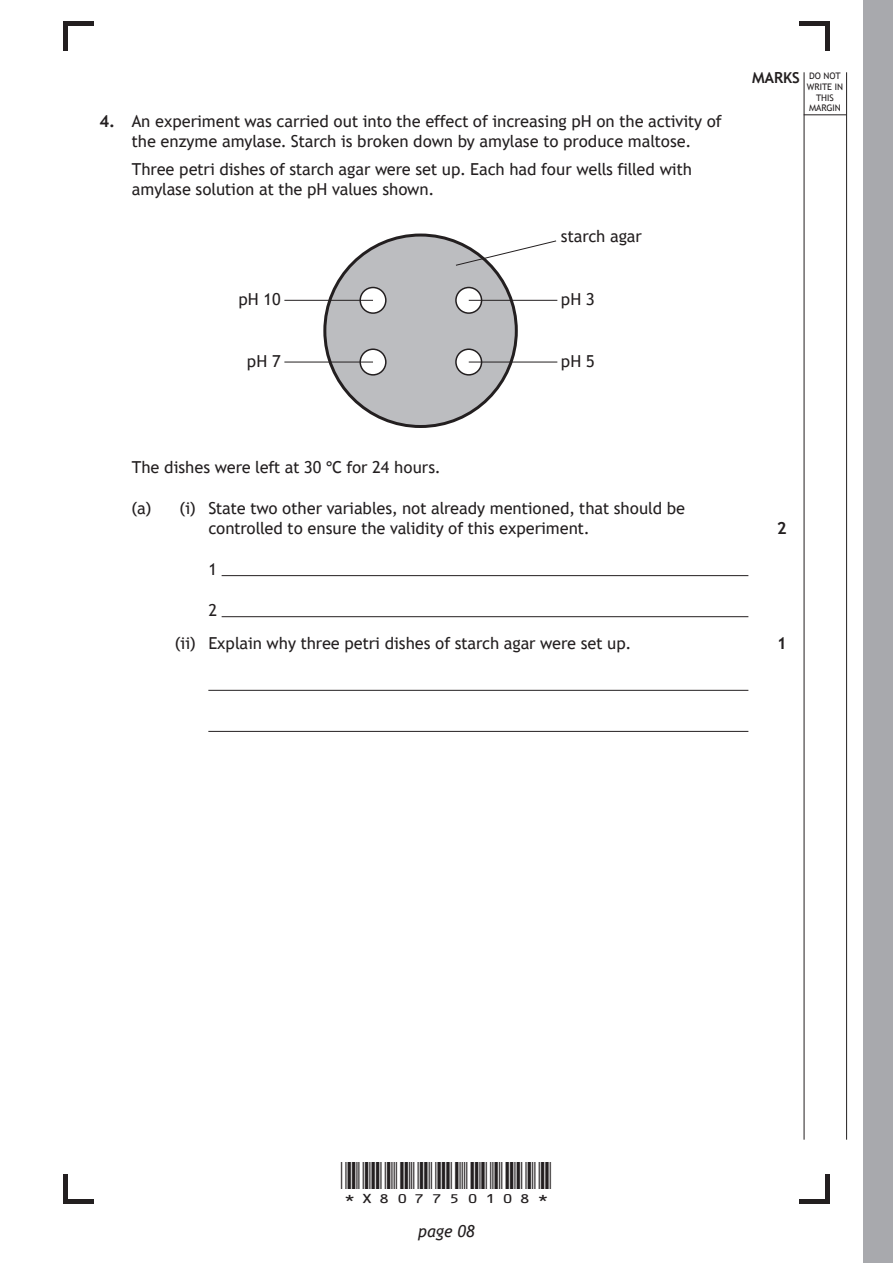
Selectable page text
MARKS _{W}^{D}_{R}^{O}_{I} _{T}^{N}OT
                                                                   E IN
                                                                  THIS
                                                                 MARGIN
4. An experiment was carried out into the effect of increasing pH on the activity of
   the enzyme amylase. Starch is broken down by amylase to produce maltose.
   Three petri dishes of starch agar were set up. Each had four wells filled with
   amylase solution at the pH values shown.
                                           starch agar

             pH 10                         pH 3

              pH 7                         pH 5

   The dishes were left at 30 °C for 24 hours.

   (a)  (i) State two other variables, not already mentioned, that should be
          controlled to ensure the validity of this experiment. 2

          1

          2

       (ii) Explain why three petri dishes of starch agar were set up. 1

                      *X807750108*

                             page 08
PDF page 9
Selectable page text
MARKS _{W}^{D}_{R}^{O}_{I} _{T}^{N}OT
                                                                   E IN
                                                                  THIS
                                                                 MARGIN
4. (continued)
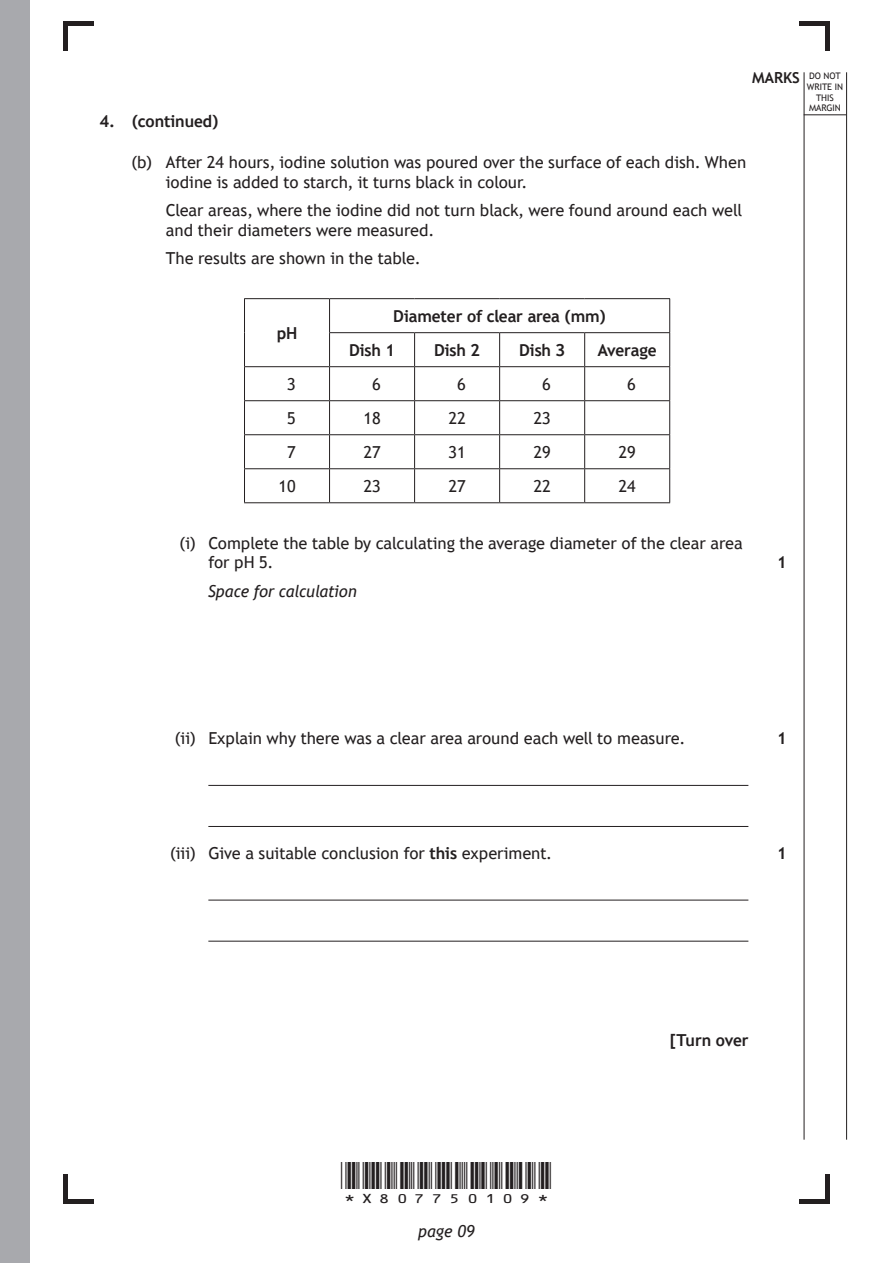
   (b) After 24 hours, iodine solution was poured over the surface of each dish. When
      iodine is added to starch, it turns black in colour.
      Clear areas, where the iodine did not turn black, were found around each well
      and their diameters were measured.
      The results are shown in the table.

                           Diameter of clear area (mm)
                pH
                       Dish 1  Dish 2  Dish 3 Average
                 3       6       6       6       6

                 5      18      22      23

                 7      27      31      29      29

                 10     23      27      22      24

        (i) Complete the table by calculating the average diameter of the clear area

          for pH 5.                                           1
          Space for calculation

       (ii) Explain why there was a clear area around each well to measure. 1

       (iii) Give a suitable conclusion for this experiment.  1

                                                     [Turn over

                      *X807750109*

                             page 09
PDF page 10
Paper 2, Question 5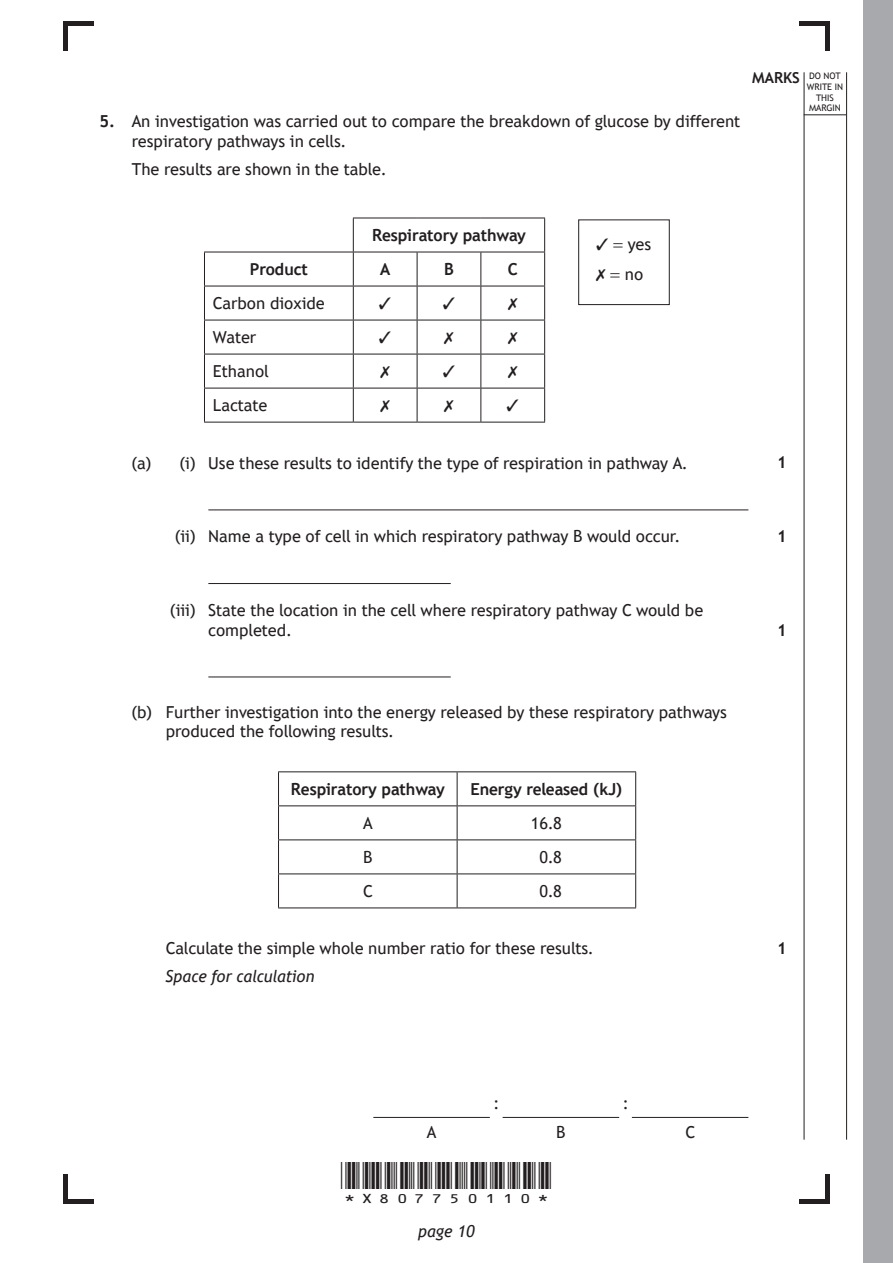
Selectable page text
MARKS _{W}^{D}_{R}^{O}_{I} _{T}^{N}OT
                                                                   E IN
                                                                  THIS
                                                                 MARGIN
5. An investigation was carried out to compare the breakdown of glucose by different
   respiratory pathways in cells.
   The results are shown in the table.

                         Respiratory pathway
                                              ✓ = yes
              Product     A     B     C       ✗ = no
           Carbon dioxide ✓     ✓     ✗

           Water          ✓     ✗     ✗

           Ethanol        ✗     ✓     ✗
           Lactate        ✗     ✗     ✓

   (a)  (i) Use these results to identify the type of respiration in pathway A. 1

       (ii) Name a type of cell in which respiratory pathway B would occur. 1

       (iii) State the location in the cell where respiratory pathway C would be
          completed.                                          1

   (b) Further investigation into the energy released by these respiratory pathways
      produced the following results.

                  Respiratory pathway Energy released (kJ)

                        A               16.8

                        B                0.8
                        C                0.8

      Calculate the simple whole number ratio for these results. 1

      Space for calculation

                                    :           :

                              A           B           C

                      *X807750110*

                             page 10
PDF page 11
Paper 2, Question 6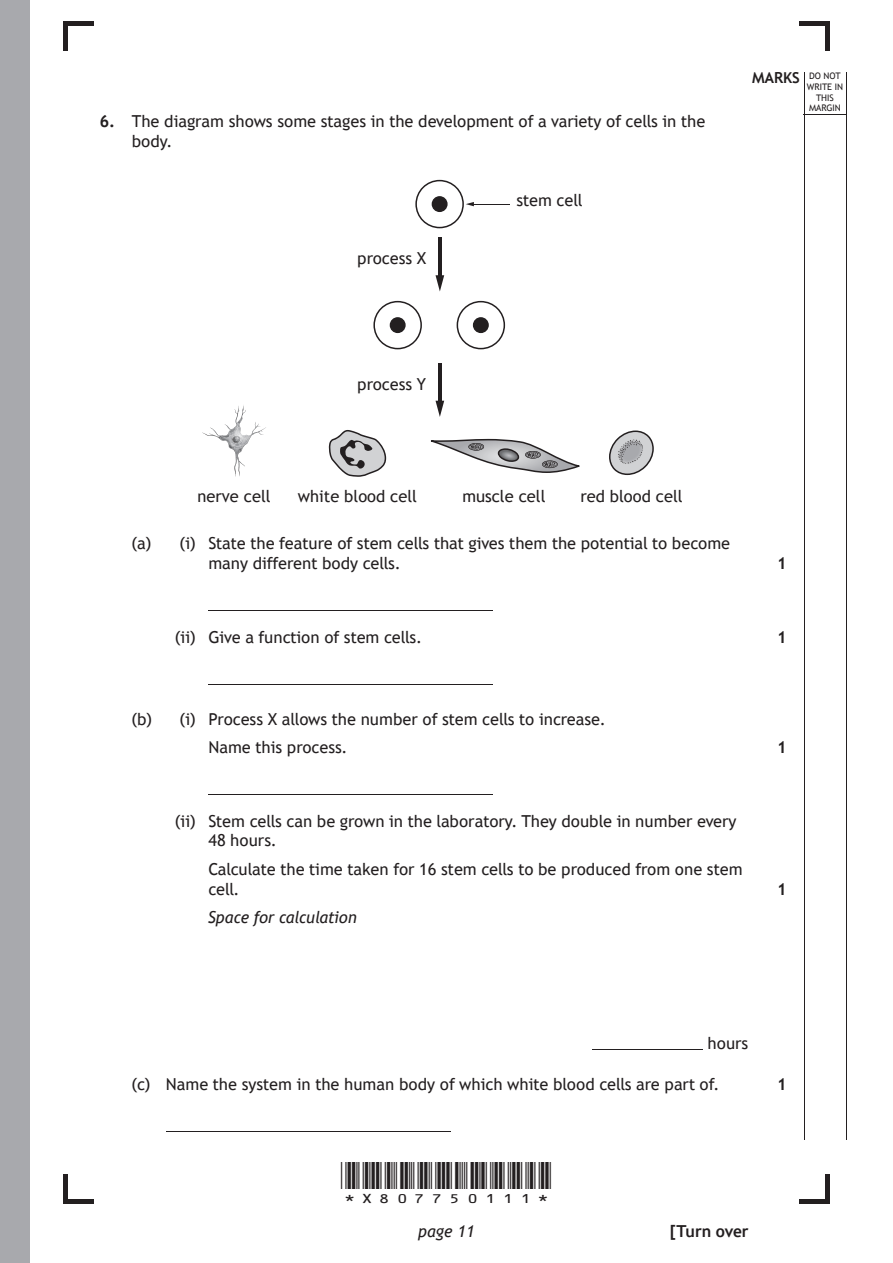
Selectable page text
MARKS _{W}^{D}_{R}^{O}_{I} _{T}^{N}OT
                                                                   E IN
                                                                  THIS
                                                                 MARGIN
6. The diagram shows some stages in the development of a variety of cells in the
   body.
                                      stem cell

                        process X

                        process Y

         nerve cell white blood cell muscle cell red blood cell

   (a)  (i) State the feature of stem cells that gives them the potential to become
          many different body cells.                          1

       (ii) Give a function of stem cells.                    1

   (b)  (i) Process X allows the number of stem cells to increase.
          Name this process.                                  1

       (ii) Stem cells can be grown in the laboratory. They double in number every
          48 hours.
          Calculate the time taken for 16 stem cells to be produced from one stem
          cell.                                               1

          Space for calculation

                                             ������������������������ hours

   (c) Name the system in the human body of which white blood cells are part of. 1

                      *X807750111*

                             page 11                 [Turn over
PDF page 12
Paper 2, Question 7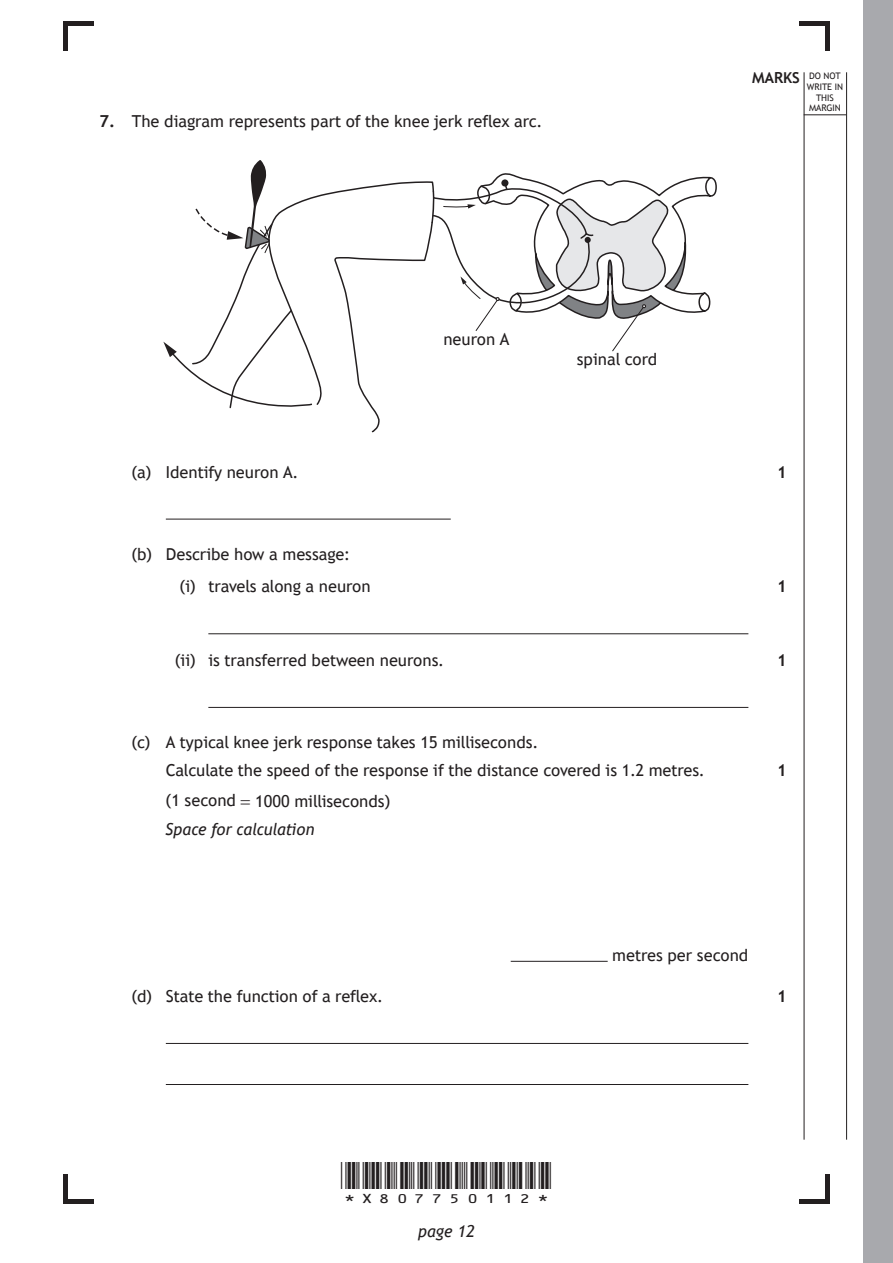
Selectable page text
MARKS _{W}^{D}_{R}^{O}_{I} _{T}^{N}OT
                                                                   E IN
                                                                  THIS
                                                                 MARGIN
7. The diagram represents part of the knee jerk reflex arc.

                                neuron A
                                            spinal cord

   (a) Identify neuron A.                                     1

   (b) Describe how a message:

        (i) travels along a neuron                            1

       (ii) is transferred between neurons.                   1

   (c) A typical knee jerk response takes 15 milliseconds.
      Calculate the speed of the response if the distance covered is 1.2 metres. 1

      (1 second = 1000 milliseconds)
      Space for calculation

                                      ��������������������� metres per second

   (d) State the function of a reflex.                        1

                      *X807750112*

                             page 12
PDF page 13
Paper 2, Question 8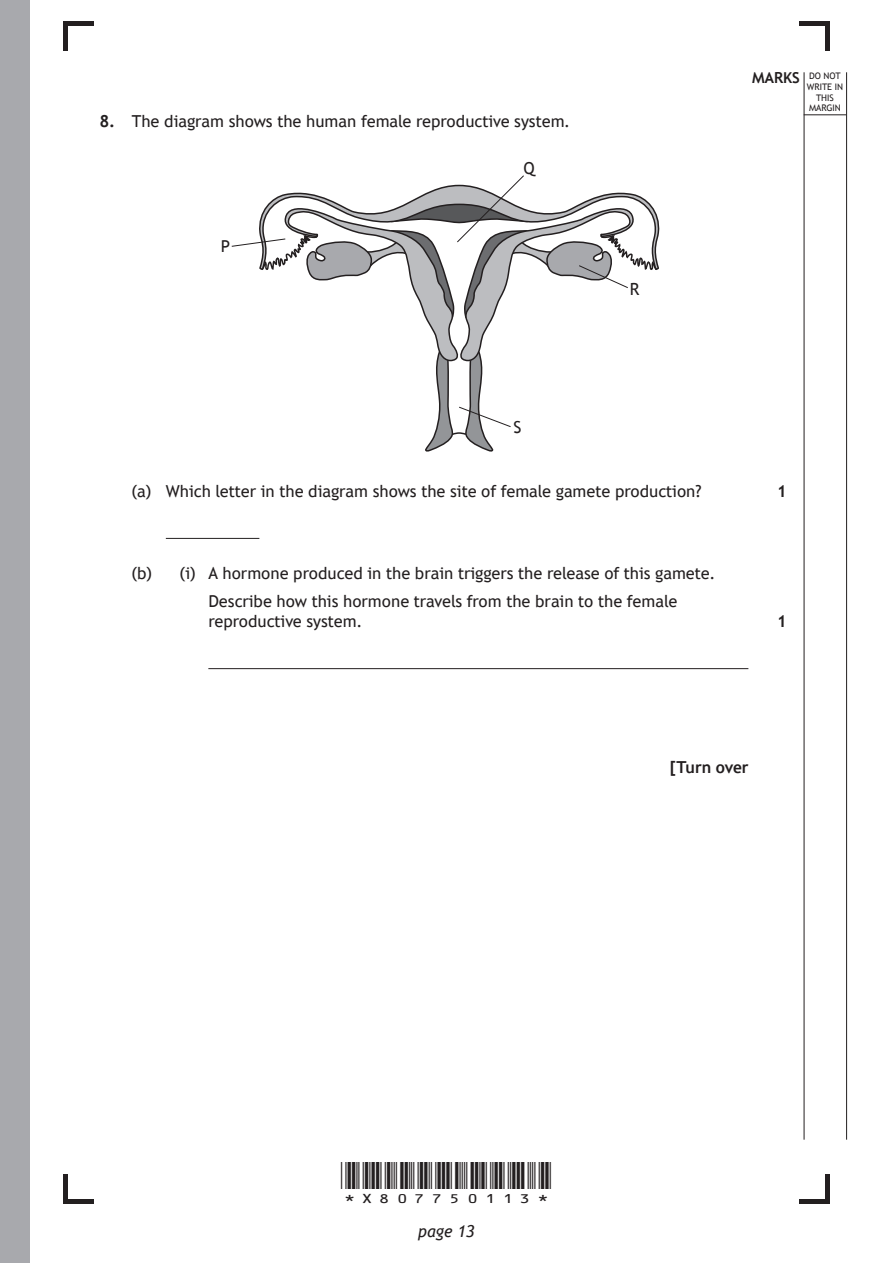
Selectable page text
MARKS _{W}^{D}_{R}^{O}_{I} _{T}^{N}OT
                                                                   E IN
                                                                  THIS
                                                                 MARGIN
8. The diagram shows the human female reproductive system.
                                       Q

           P

                                                 R

                                      S

   (a) Which letter in the diagram shows the site of female gamete production? 1

   (b)  (i) A hormone produced in the brain triggers the release of this gamete.

          Describe how this hormone travels from the brain to the female
          reproductive system.                                1

                                                     [Turn over

                      *X807750113*

                             page 13
PDF page 14
Selectable page text
MARKS _{W}^{D}_{R}^{O}_{I} _{T}^{N}OT
                                                                   E IN
                                                                  THIS
                                                                 MARGIN
8. (b) (continued)
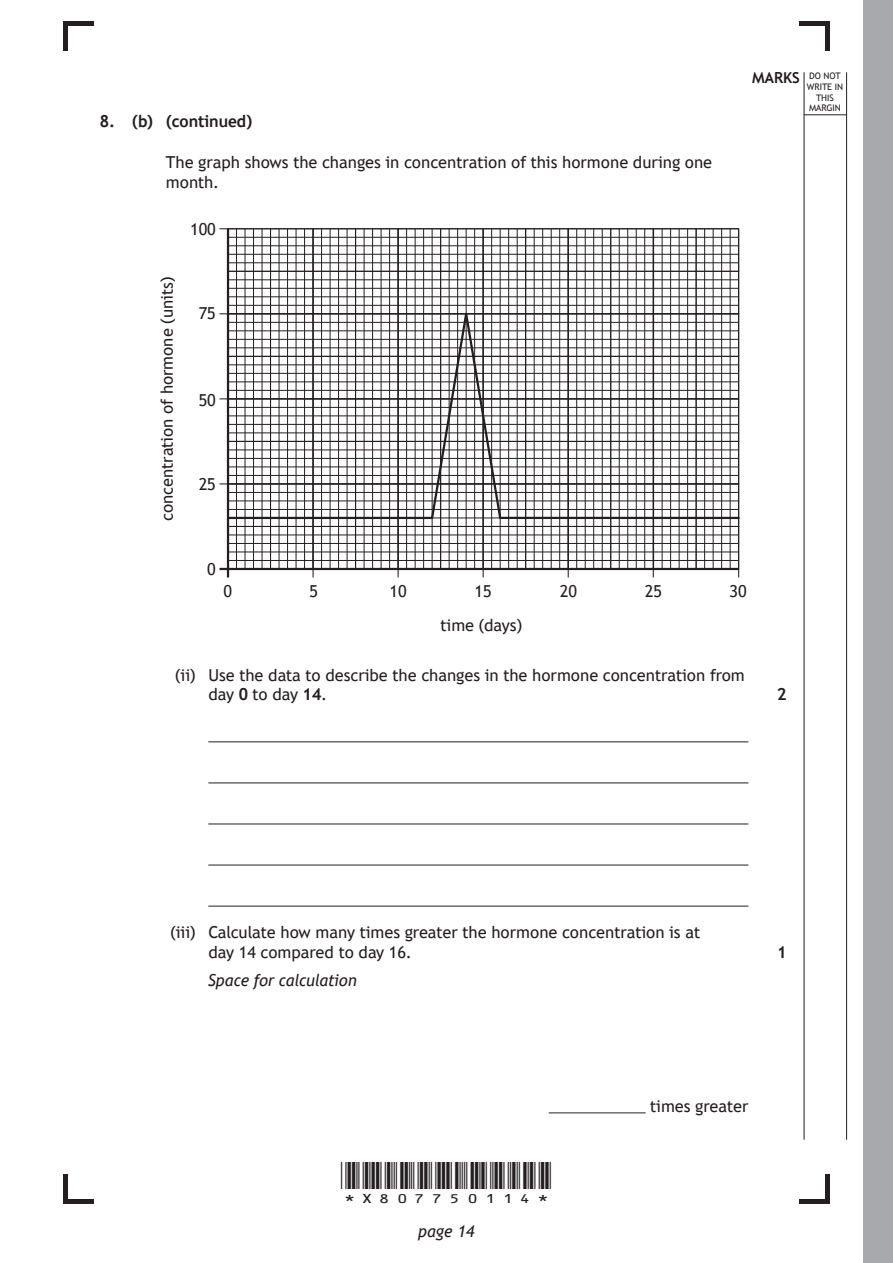
      The graph shows the changes in concentration of this hormone during one
      month.

                                time (days)

                      *X807750114*

                             page 14
      )stinu(
      enomroh
      fo
      noitartnecnoc
        100
         75
         50
         25
          0
            0      5       10      15     20      25      30
       (ii) Use the data to describe the changes in the hormone concentration from
          day 0 to day 14.                                    2
       (iii) Calculate how many times greater the hormone concentration is at
          day 14 compared to day 16.                          1
          Space for calculation
                                         ��������������������� times greater
PDF page 15
Paper 2, Question 9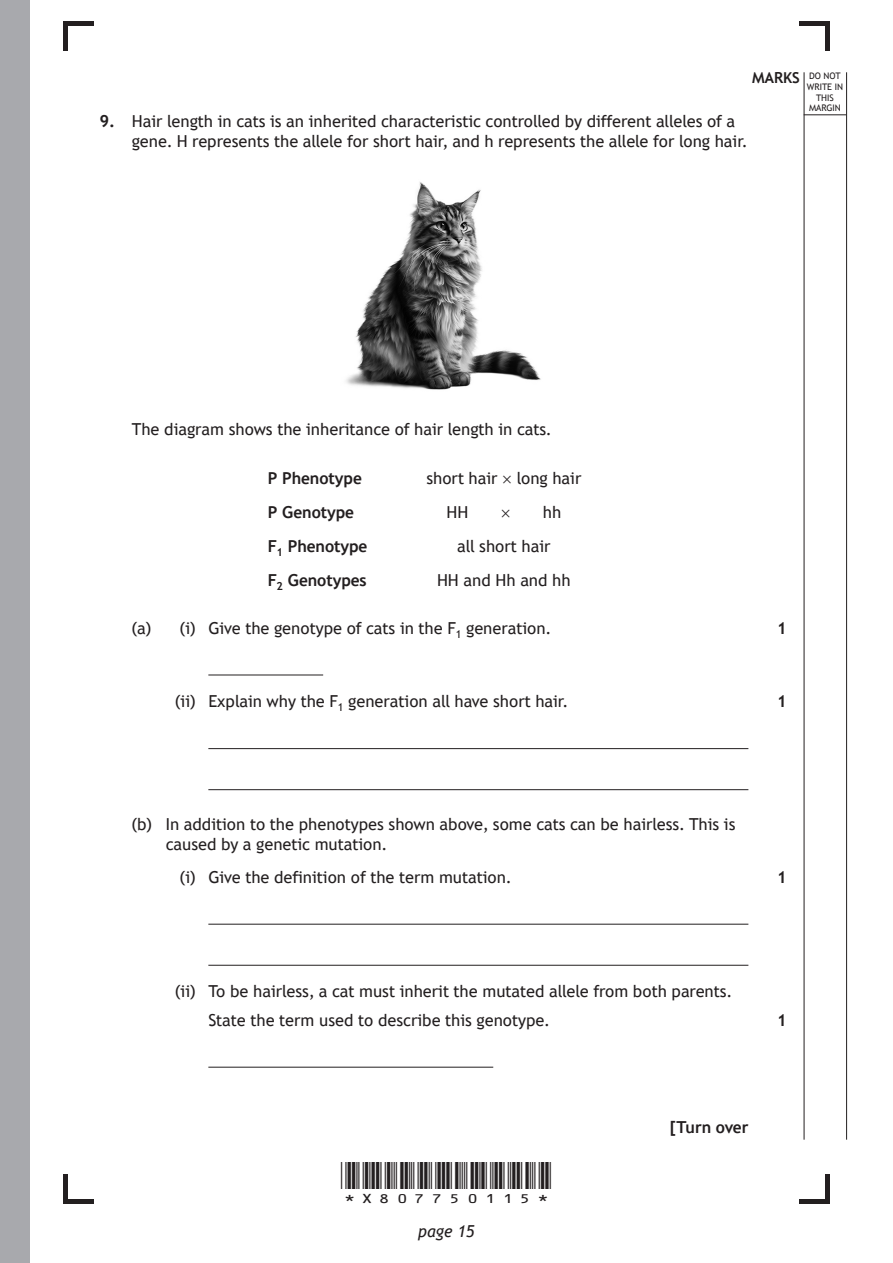
Selectable page text
MARKS _{W}^{D}_{R}^{O}_{I} _{T}^{N}OT
                                                                   E IN
                                                                  THIS
                                                                 MARGIN
9. Hair length in cats is an inherited characteristic controlled by different alleles of a
   gene. H represents the allele for short hair, and h represents the allele for long hair.

   The diagram shows the inheritance of hair length in cats.

                P Phenotype   short hair × long hair

                P Genotype      HH   ×   hh

                F₁ Phenotype     all short hair
                F₂ Genotypes   HH and Hh and hh

   (a)  (i) Give the genotype of cats in the F₁ generation.   1

       (ii) Explain why the F₁ generation all have short hair. 1

   (b) In addition to the phenotypes shown above, some cats can be hairless. This is
      caused by a genetic mutation.

        (i) Give the definition of the term mutation.         1

       (ii) To be hairless, a cat must inherit the mutated allele from both parents.
          State the term used to describe this genotype.      1

                                                     [Turn over

                      *X807750115*

                             page 15
PDF page 16
Paper 2, Question 10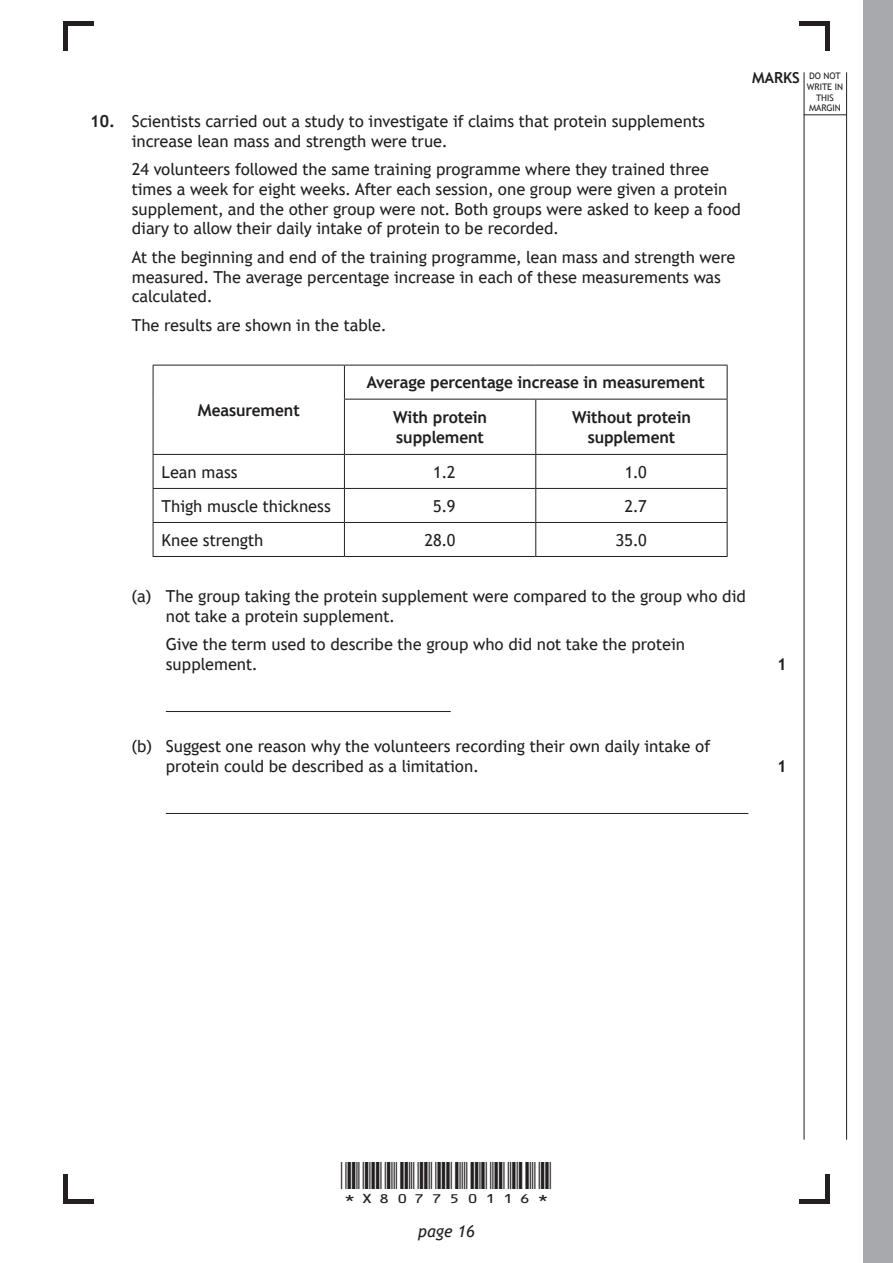
Selectable page text
MARKS _{W}^{D}_{R}^{O}_{I} _{T}^{N}OT
                                                                    E IN
                                                                   THIS
                                                                  MARGIN
10. Scientists carried out a study to investigate if claims that protein supplements
    increase lean mass and strength were true.
    24 volunteers followed the same training programme where they trained three
    times a week for eight weeks. After each session, one group were given a protein
    supplement, and the other group were not. Both groups were asked to keep a food
    diary to allow their daily intake of protein to be recorded.
    At the beginning and end of the training programme, lean mass and strength were
    measured. The average percentage increase in each of these measurements was
    calculated.
    The results are shown in the table.

                          Average percentage increase in measurement

          Measurement
                            With protein     Without protein
                            supplement        supplement
       Lean mass                1.2              1.0

       Thigh muscle thickness   5.9              2.7
       Knee strength           28.0              35.0

    (a) The group taking the protein supplement were compared to the group who did
       not take a protein supplement.

       Give the term used to describe the group who did not take the protein
       supplement.                                             1

    (b) Suggest one reason why the volunteers recording their own daily intake of
       protein could be described as a limitation.             1

                       *X807750116*

                              page 16
PDF page 17

Selectable page text
MARKS _{W}^{D}_{R}^{O}_{I} _{T}^{N}OT
                                                                    E IN
                                                                   THIS
                                                                  MARGIN
10. (continued)
    (c) An individual with an initial knee strength of 50 kg took part in a similar
       training programme.
       Predict their knee strength after 8 weeks if they took no protein supplements
       after each session.                                     1
       Space for calculation

                                                  �������������������� kg

    (d) Suggest why it may not be necessary to take this protein supplement. 1

                                                      [Turn over

                       *X807750117*

                              page 17
PDF page 18
Paper 2, Question 11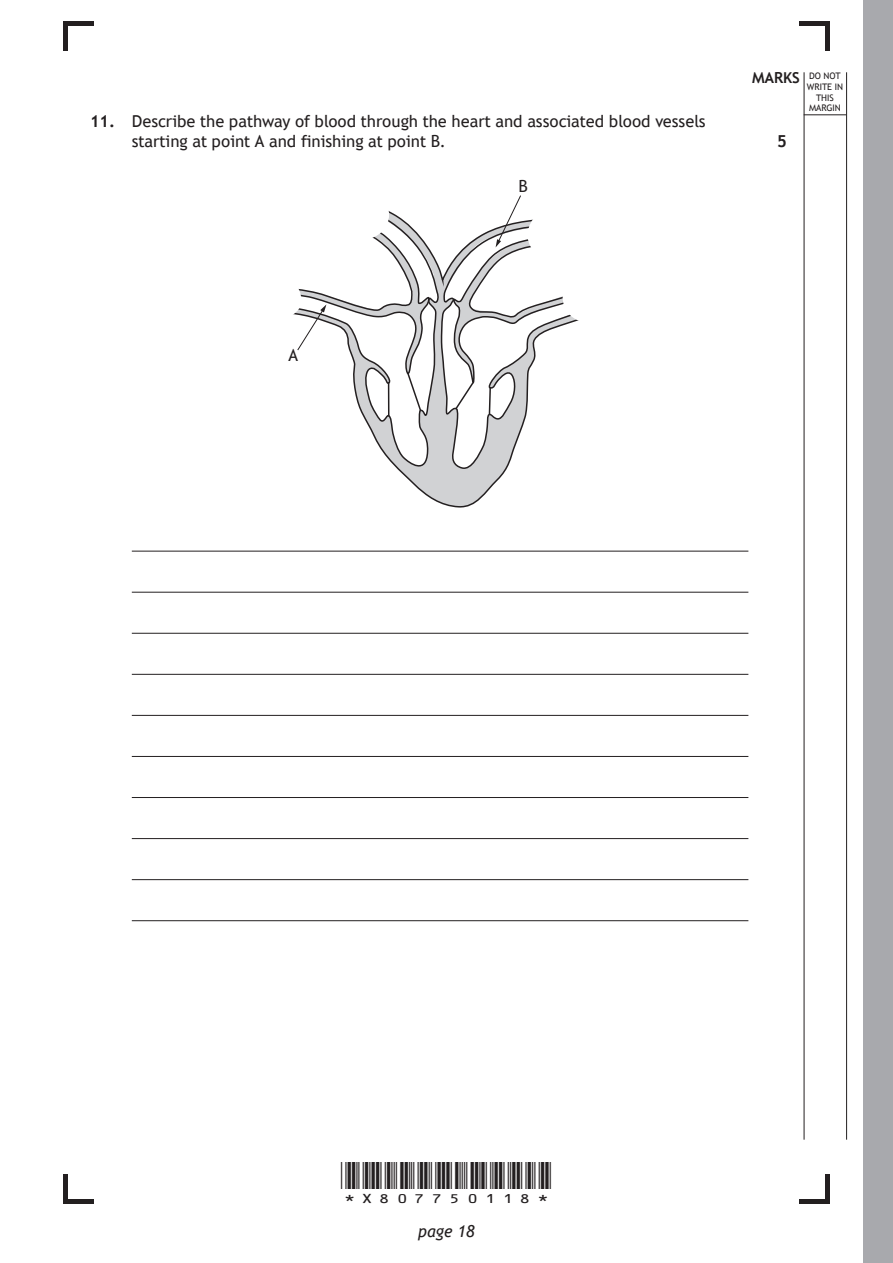
Selectable page text
MARKS _{W}^{D}_{R}^{O}_{I} _{T}^{N}OT
                                                                    E IN
                                                                   THIS
                                                                  MARGIN
11. Describe the pathway of blood through the heart and associated blood vessels
    starting at point A and finishing at point B.              5
                                        B

                   A

                       *X807750118*

                              page 18
PDF page 19
Paper 2, Question 12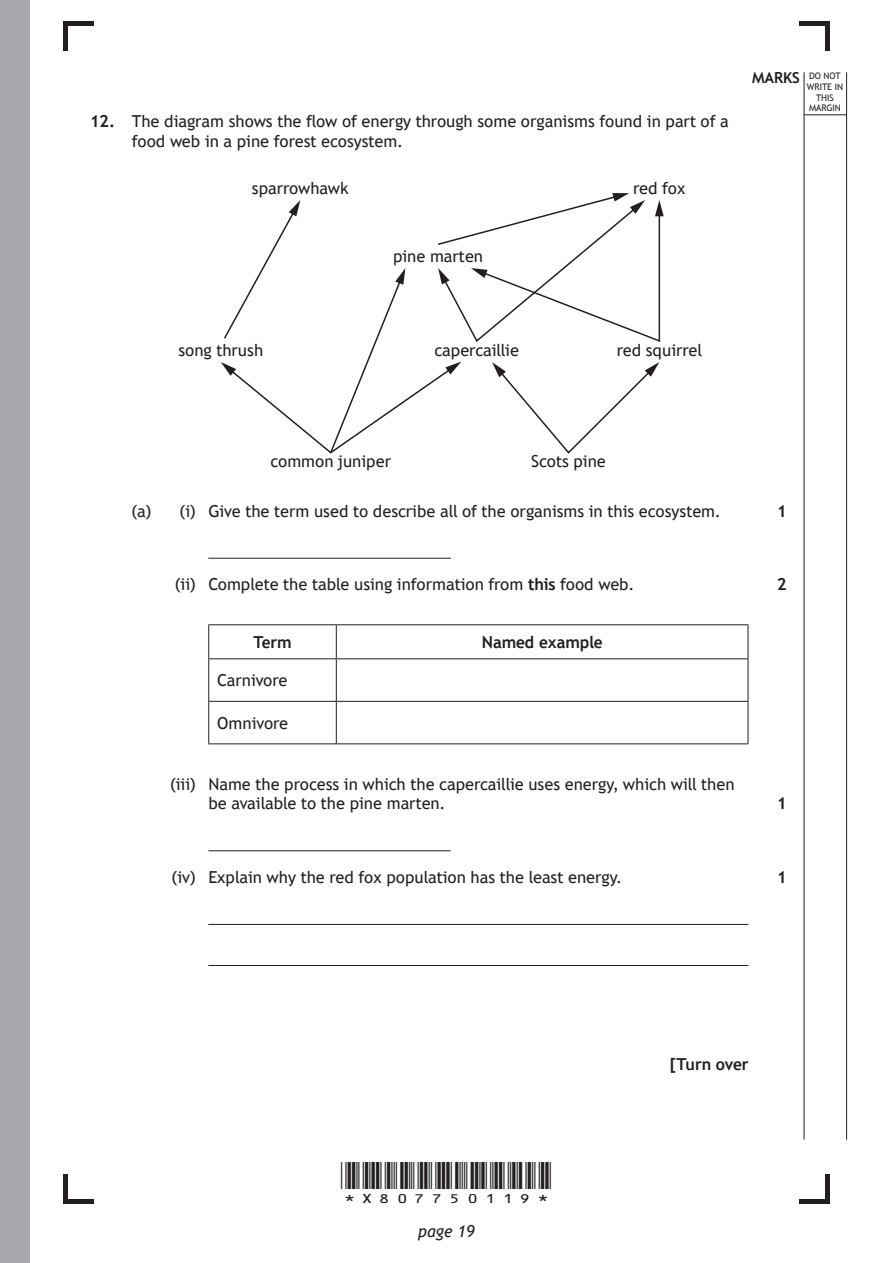
Selectable page text
MARKS _{W}^{D}_{R}^{O}_{I} _{T}^{N}OT
                                                                    E IN
                                                                   THIS
                                                                  MARGIN
12. The diagram shows the flow of energy through some organisms found in part of a
    food web in a pine forest ecosystem.
               sparrowhawk                        red fox

                            pine marten

        song thrush             capercaillie     red squirrel

                 common juniper          Scots pine

    (a)  (i) Give the term used to describe all of the organisms in this ecosystem. 1

        (ii) Complete the table using information from this food web. 2

               Term                 Named example

            Carnivore

            Omnivore

        (iii) Name the process in which the capercaillie uses energy, which will then
           be available to the pine marten.                    1

        (iv) Explain why the red fox population has the least energy. 1

                                                      [Turn over

                       *X807750119*

                              page 19
PDF page 20
Selectable page text
MARKS _{W}^{D}_{R}^{O}_{I} _{T}^{N}OT
                                                                    E IN
                                                                   THIS
                                                                  MARGIN
12. (continued)
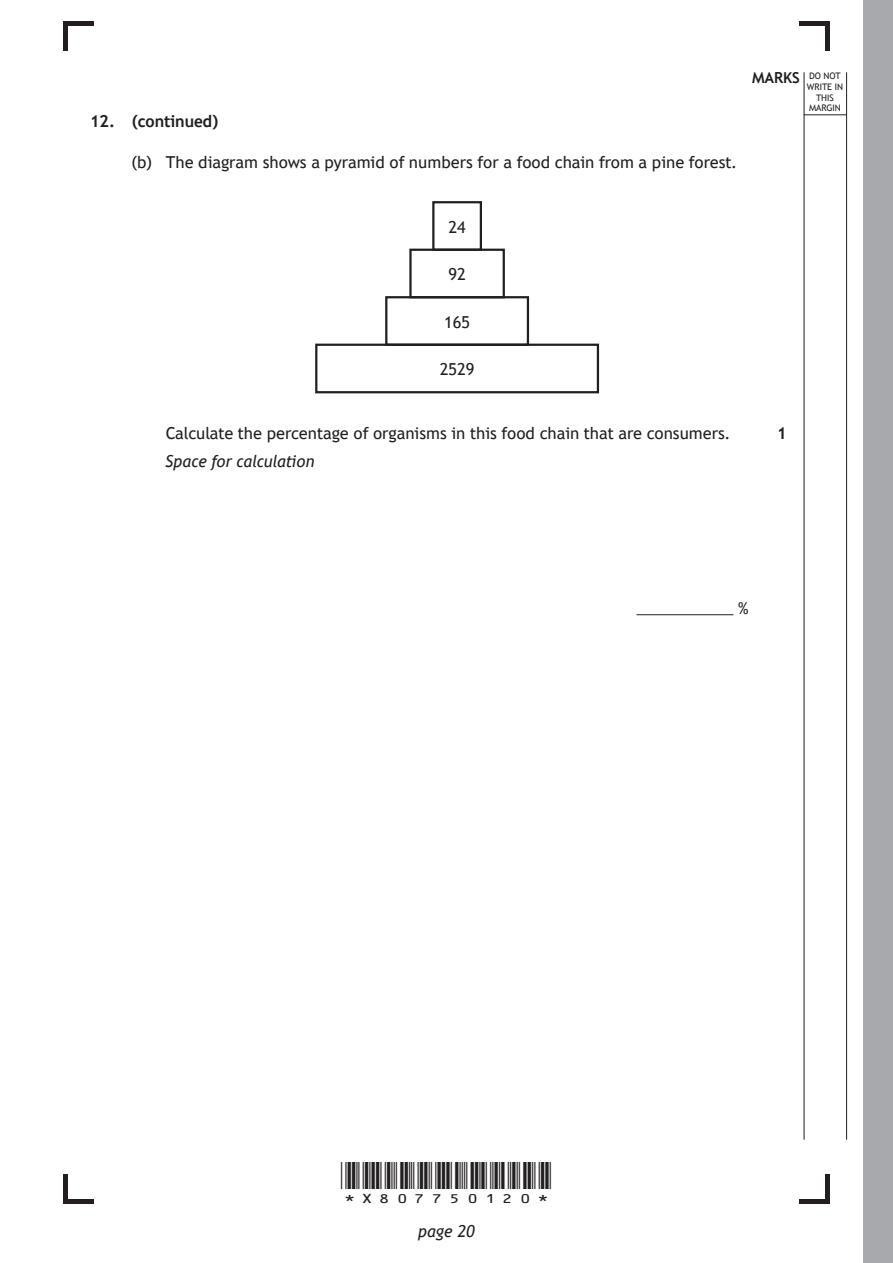
    (b) The diagram shows a pyramid of numbers for a food chain from a pine forest.

                                 24

                                 92

                                 165

                                2529

       Calculate the percentage of organisms in this food chain that are consumers. 1
       Space for calculation

                                                   ��������������������� %

                       *X807750120*

                              page 20
PDF page 21
Paper 2, Question 13
Selectable page text
MARKS _{W}^{D}_{R}^{O}_{I} _{T}^{N}OT
                                                                    E IN
                                                                   THIS
                                                                  MARGIN
13. Fertilisers can be added to soil to increase crop yield.
    (a) Explain why crop yields need to be increased.          1

    (b) Excess fertilisers can leach into freshwater ecosystems causing algal blooms.

       Describe the effect an algal bloom will have on the number of bacteria and
       give the reason why.                                    2

       Effect on number

       Reason

    (c) Explain why an algal bloom would cause a decrease in the concentration of
       oxygen in the water.                                    1

    (d) Suggest an alternative that could be used to reduce the use of fertilisers. 1

                                                      [Turn over

                       *X807750121*

                              page 21
PDF page 22
Paper 2, Question 14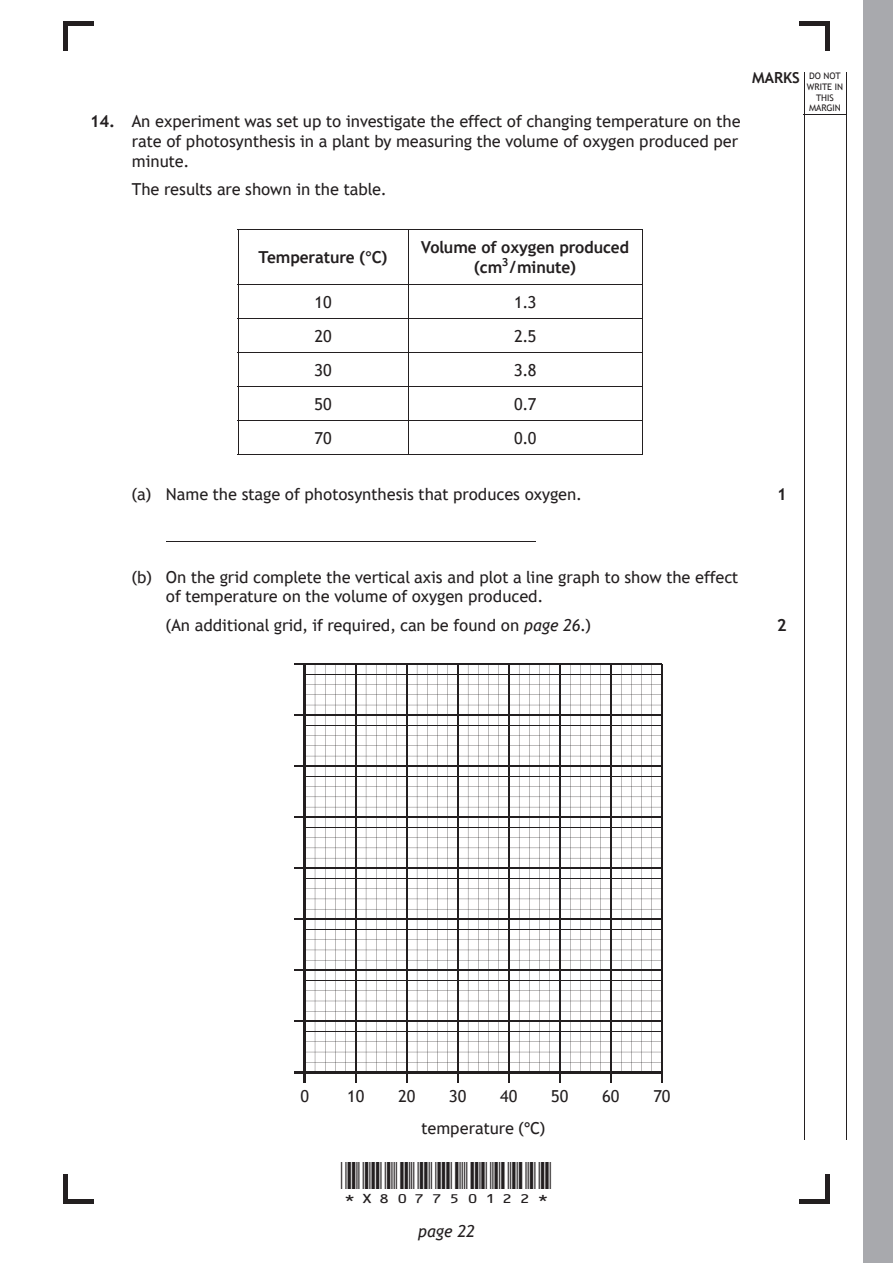
Selectable page text
MARKS _{W}^{D}_{R}^{O}_{I} _{T}^{N}OT
                                                                    E IN
                                                                   THIS
                                                                  MARGIN
14. An experiment was set up to investigate the effect of changing temperature on the
    rate of photosynthesis in a plant by measuring the volume of oxygen produced per
    minute.
    The results are shown in the table.
                               Volume of oxygen produced
                Temperature (°C)
                                    (cm³/minute)
                     10                1.3

                     20                2.5

                     30                3.8
                     50                0.7

                     70                0.0

    (a) Name the stage of photosynthesis that produces oxygen. 1

    (b) On the grid complete the vertical axis and plot a line graph to show the effect
       of temperature on the volume of oxygen produced.

       (An additional grid, if required, can be found on page 26.) 2

                    0   10   20  30   40   50  60   70

                               temperature (°C)

                       *X807750122*

                              page 22
PDF page 23

Selectable page text
MARKS _{W}^{D}_{R}^{O}_{I} _{T}^{N}OT
                                                                    E IN
                                                                   THIS
                                                                  MARGIN
14. (continued)
    (c) Describe the relationship between temperature and the rate of
       photosynthesis.                                         2

    (d) Explain why no oxygen is produced at 70 °C.            2

                                                      [Turn over

                       *X807750123*

                              page 23
PDF page 24
Paper 2, Question 15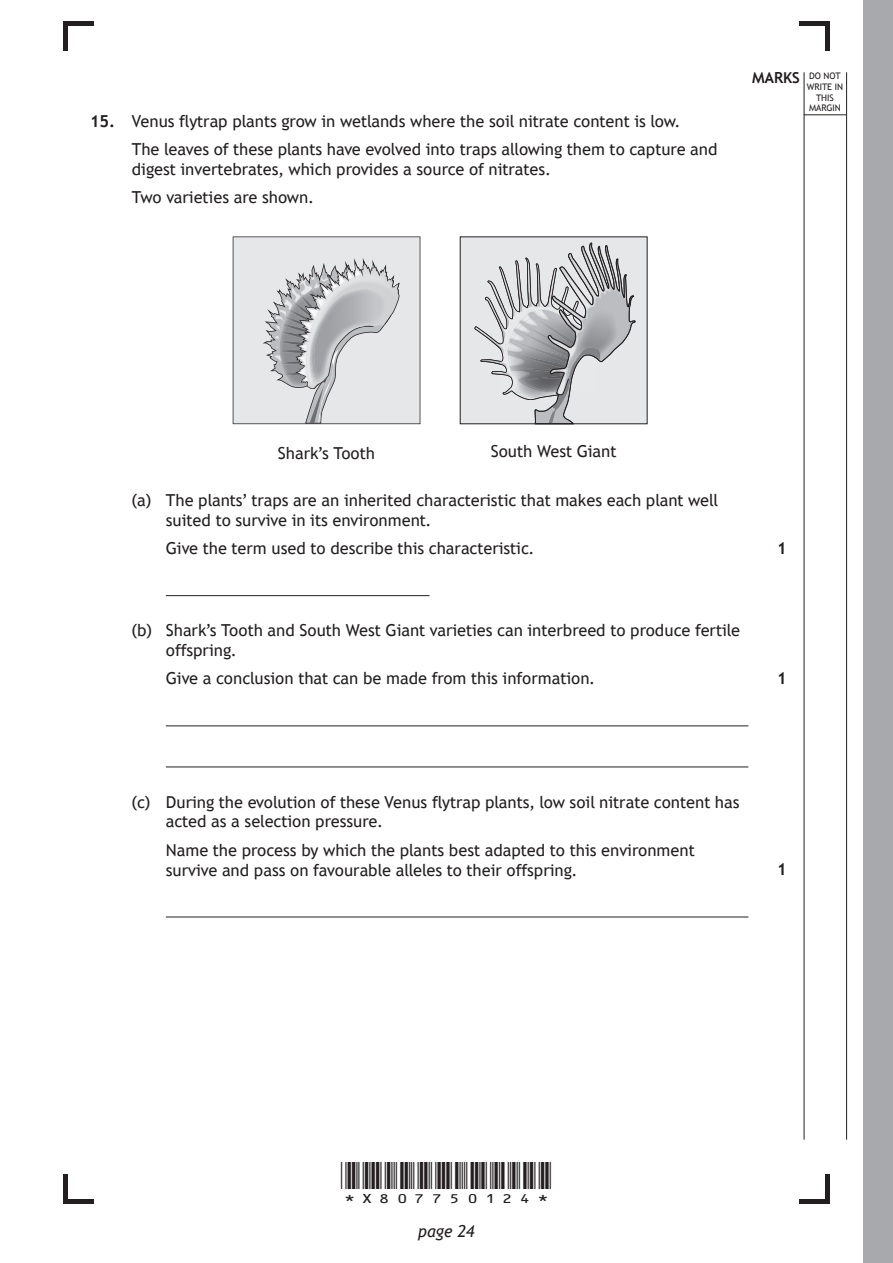
Selectable page text
MARKS _{W}^{D}_{R}^{O}_{I} _{T}^{N}OT
                                                                    E IN
                                                                   THIS
                                                                  MARGIN
15. Venus flytrap plants grow in wetlands where the soil nitrate content is low.
    The leaves of these plants have evolved into traps allowing them to capture and
    digest invertebrates, which provides a source of nitrates.
    Two varieties are shown.

                  Shark’s Tooth      South West Giant

    (a) The plants’ traps are an inherited characteristic that makes each plant well
       suited to survive in its environment.

       Give the term used to describe this characteristic.     1

    (b) Shark’s Tooth and South West Giant varieties can interbreed to produce fertile
       offspring.
       Give a conclusion that can be made from this information. 1

    (c) During the evolution of these Venus flytrap plants, low soil nitrate content has
       acted as a selection pressure.
       Name the process by which the plants best adapted to this environment
       survive and pass on favourable alleles to their offspring. 1

                       *X807750124*

                              page 24
PDF page 25
Selectable page text
MARKS _{W}^{D}_{R}^{O}_{I} _{T}^{N}OT
                                                                    E IN
                                                                   THIS
                                                                  MARGIN
15. (continued)
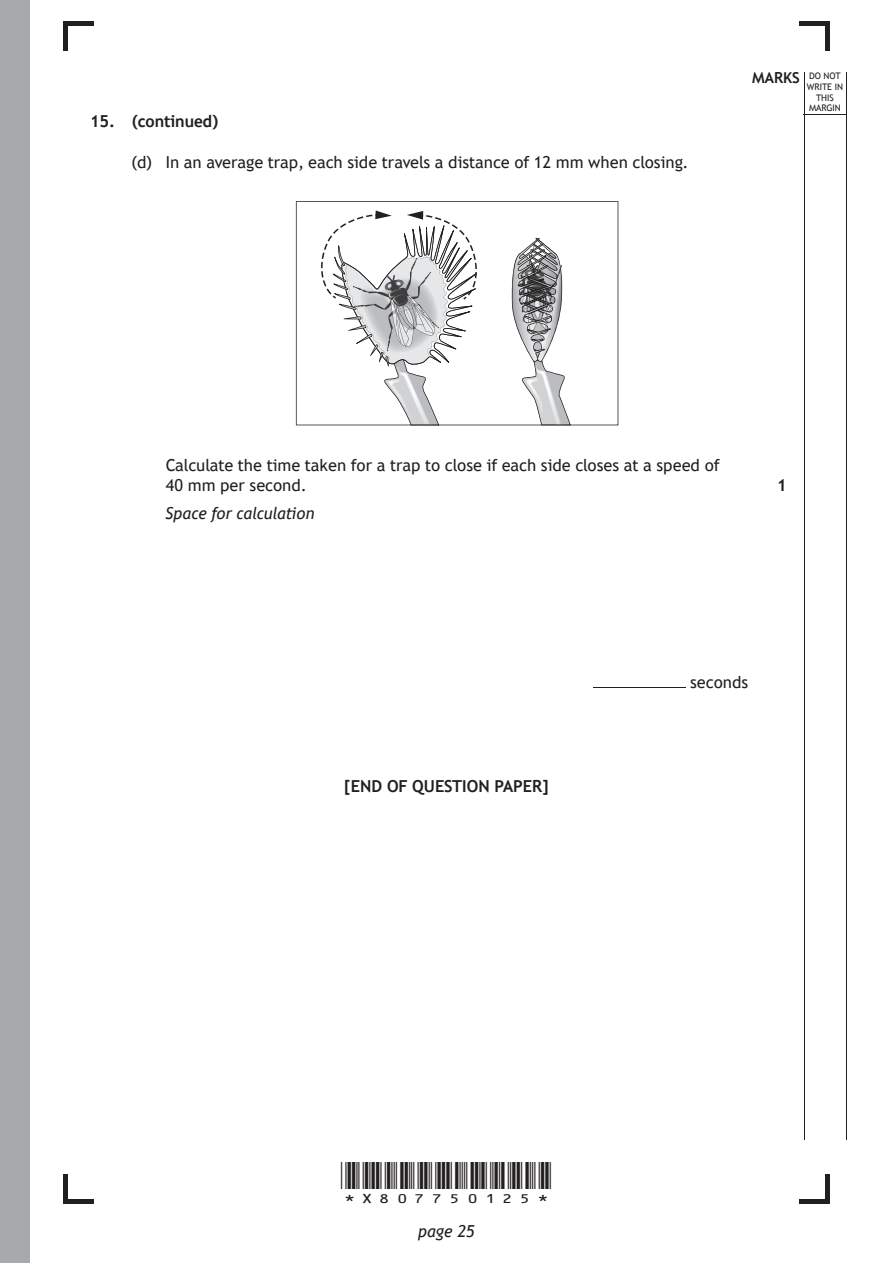
    (d) In an average trap, each side travels a distance of 12 mm when closing.

       Calculate the time taken for a trap to close if each side closes at a speed of
       40 mm per second.                                       1
       Space for calculation

                                               �������������������� seconds

                        [END OF QUESTION PAPER]

                       *X807750125*

                              page 25
PDF page 26
Selectable page text
DO NOT
                                                                  WRITE IN
                                                                   THIS
                                                                  MARGIN
            ADDITIONAL SPACE FOR ANSWERS AND ROUGH WORK
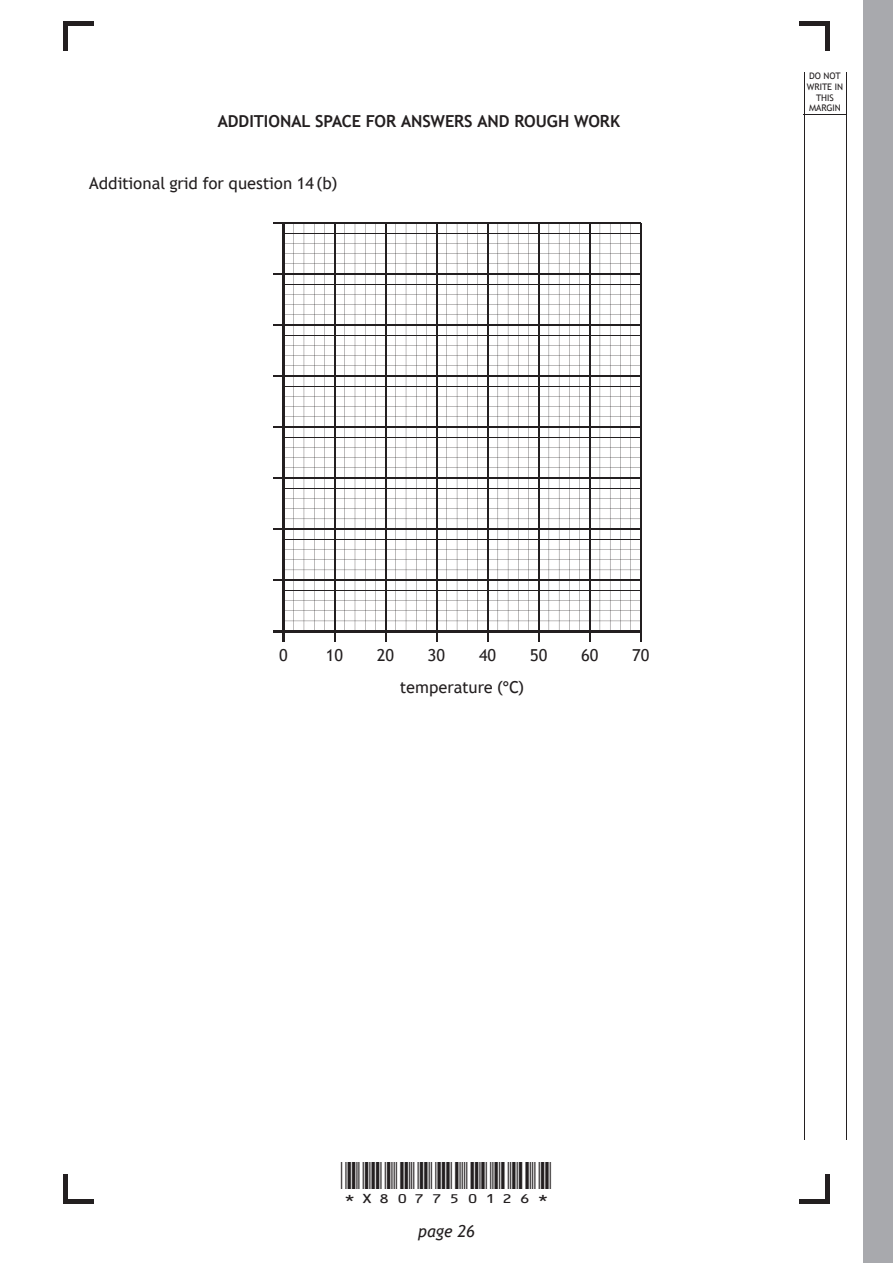
Additional grid for question 14 (b)

                  0   10   20  30   40   50  60   70

                             temperature (°C)

                       *X807750126*

                              page 26
PDF page 27

Selectable page text
DO NOT
                                                      WRITE IN
                                                       THIS
                                                      MARGIN
ADDITIONAL SPACE FOR ANSWERS AND ROUGH WORK

           *X807750127*

                  page 27
PDF page 28

Selectable page text
DO NOT
                                                                  WRITE IN
                                                                   THIS
                                                                  MARGIN
            ADDITIONAL SPACE FOR ANSWERS AND ROUGH WORK

Acknowledgement of copyright
Question 9 delikanlioguz/shutterstock.com

                       *X807750128*

                              page 28