2026 National 5 Biology - Paper 1 questions
Source: Scottish Qualifications Authority (SQA) / Qualifications Scotland. This is a StemInteract HTML companion, not an official HTML edition. Selectable text is supplied alongside original page images. Use the images or original PDF for equations, powers, fractions, vector notation, tables and diagrams; text extraction cannot fully preserve mathematical layout.
Jump to a question
PDF page 1
Selectable page text
N5
National
Qualications
2026
X807/75/02 Biology
Section 1 — Questions
TUESDAY, 28 APRIL
1:00 PM – 3:30 PM
Instructions for the completion of Section 1 are given on page 02 of your question and answer
booklet X807/75/01.
Record your answers on the answer grid on page 03 of your question and answer booklet.
You must leave your answer booklet on your desk; if you do not, you could lose all the marks for
this paper.
*X8077502*
B/PB
© Qualifications Scotland 2026PDF page 2
Paper 1, Question 1Paper 1, Question 2Paper 1, Question 3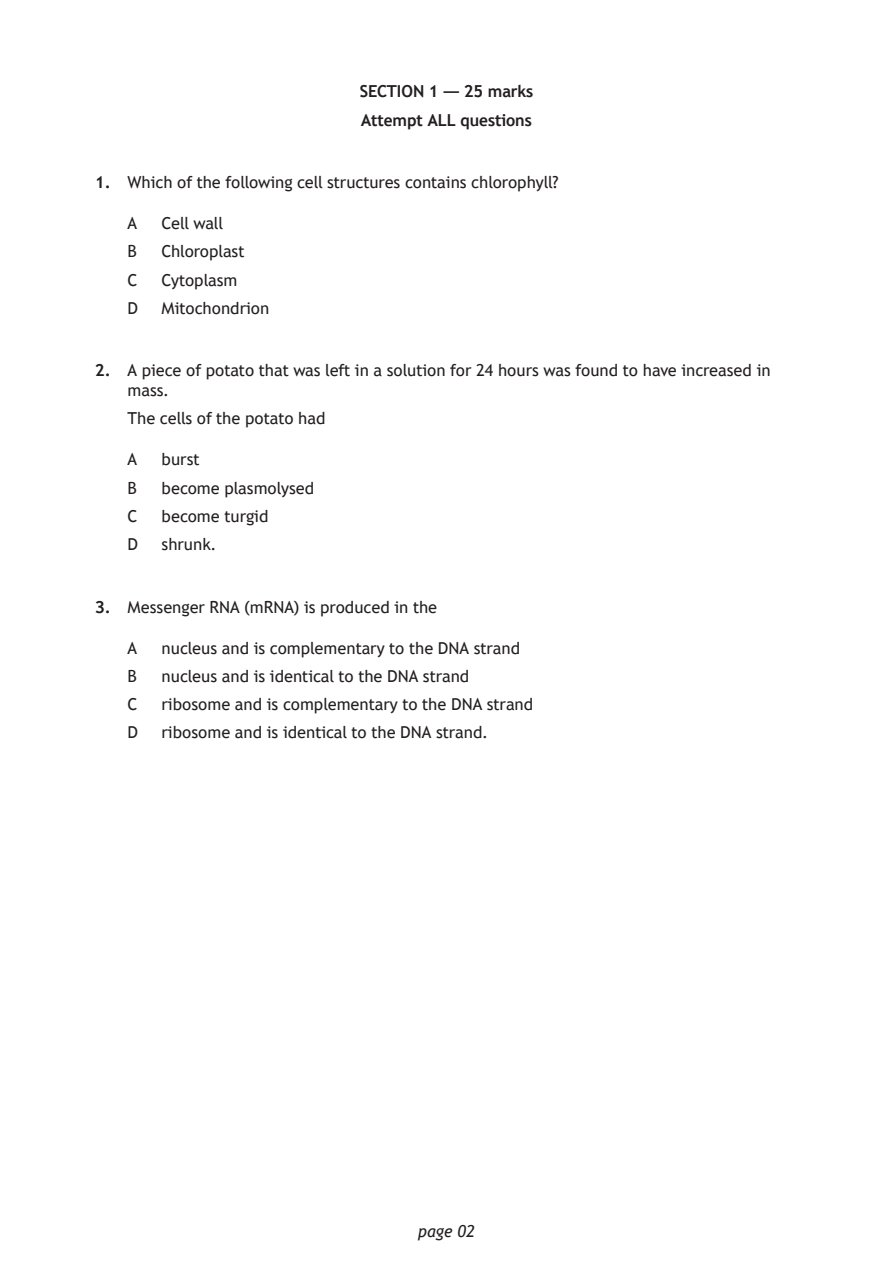
Selectable page text
SECTION 1 — 25 marks

                        Attempt ALL questions

1. Which of the following cell structures contains chlorophyll?

   A  Cell wall

   B  Chloroplast
   C  Cytoplasm
   D  Mitochondrion

2. A piece of potato that was left in a solution for 24 hours was found to have increased in
   mass.
   The cells of the potato had

   A  burst

   B  become plasmolysed
   C  become turgid

   D  shrunk.

3. Messenger RNA (mRNA) is produced in the

   A  nucleus and is complementary to the DNA strand
   B  nucleus and is identical to the DNA strand

   C  ribosome and is complementary to the DNA strand
   D  ribosome and is identical to the DNA strand.

                             page 02
PDF page 3
Paper 1, Question 4Paper 1, Question 5Paper 1, Question 6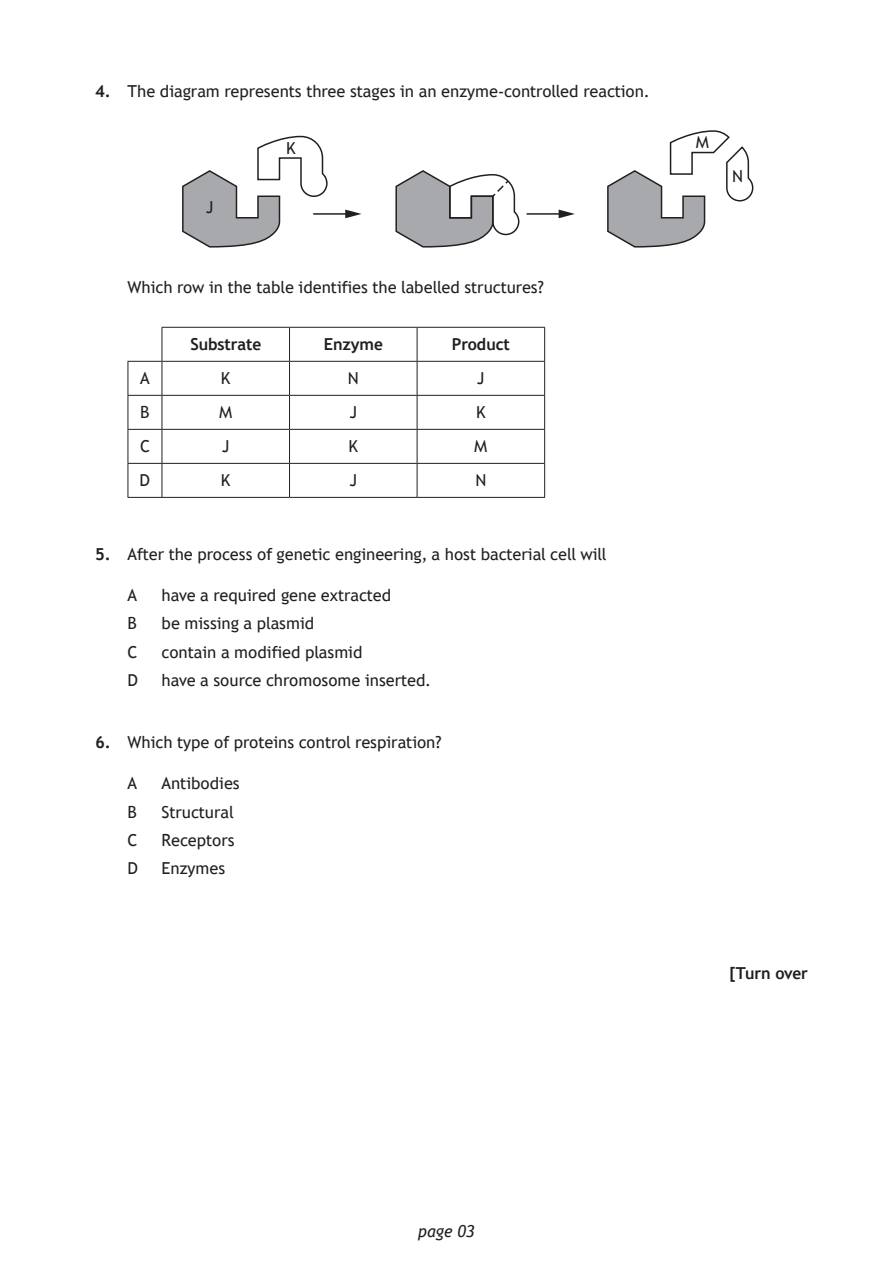
Selectable page text
4. The diagram represents three stages in an enzyme‑controlled reaction.

                                                       M
                 K
                                                          N
          J

   Which row in the table identifies the labelled structures?

         Substrate   Enzyme      Product

    A      K           N           J

    B      M           J           K

    C      J           K           M
    D      K           J           N

5. After the process of genetic engineering, a host bacterial cell will

   A  have a required gene extracted

   B  be missing a plasmid
   C  contain a modified plasmid

   D  have a source chromosome inserted.

6. Which type of proteins control respiration?

   A  Antibodies
   B  Structural

   C  Receptors
   D  Enzymes

                                                          [Turn over

                             page 03
PDF page 4
Paper 1, Question 7Paper 1, Question 8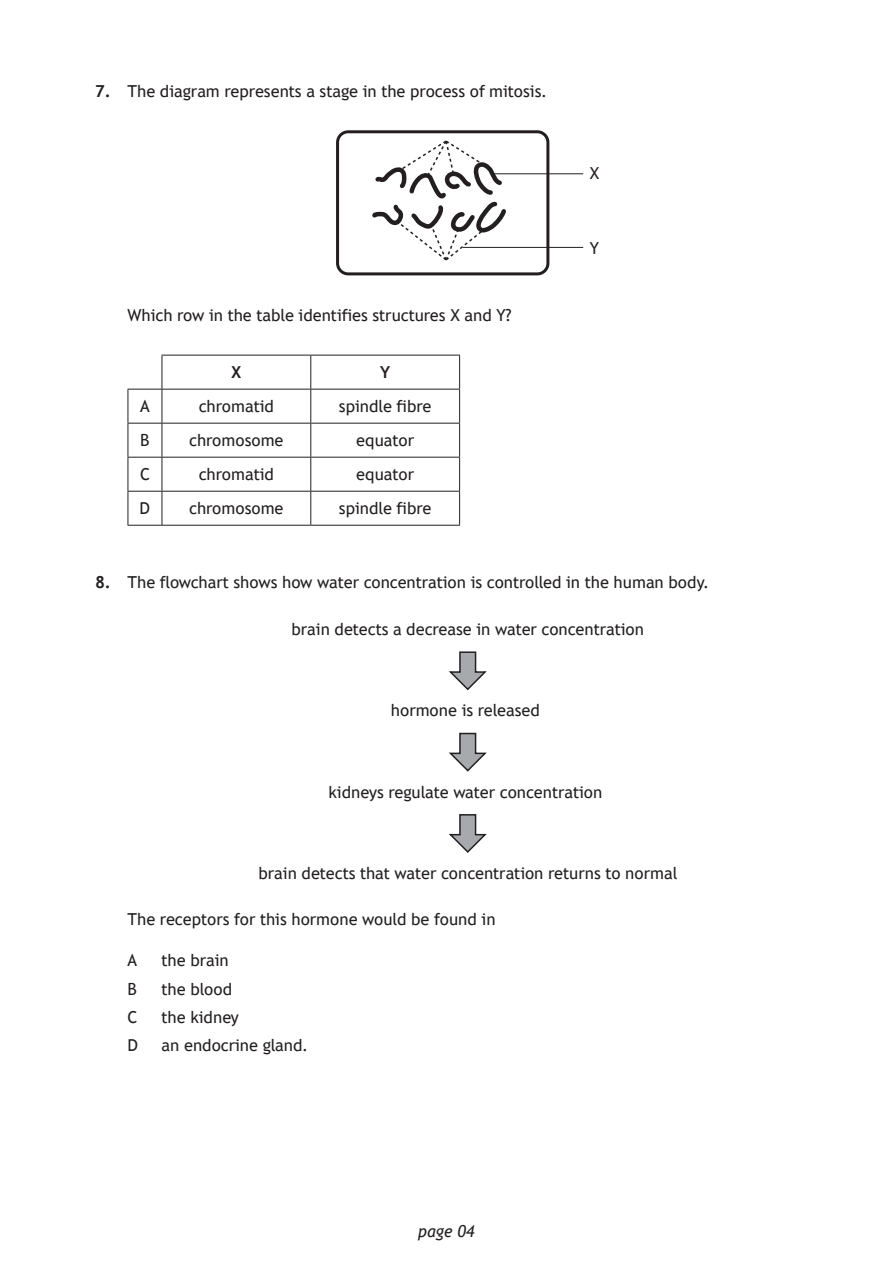
Selectable page text
7. The diagram represents a stage in the process of mitosis.

                                             X

                                             Y

   Which row in the table identifies structures X and Y?

            X             Y
    A    chromatid    spindle fibre

    B   chromosome      equator

    C    chromatid      equator

    D   chromosome    spindle fibre

8. The flowchart shows how water concentration is controlled in the human body.

                  brain detects a decrease in water concentration

                           hormone is released

                     kidneys regulate water concentration

               brain detects that water concentration returns to normal

   The receptors for this hormone would be found in

   A  the brain
   B  the blood

   C  the kidney
   D  an endocrine gland.

                             page 04
PDF page 5
Paper 1, Question 9Paper 1, Question 10Paper 1, Question 11Paper 1, Question 12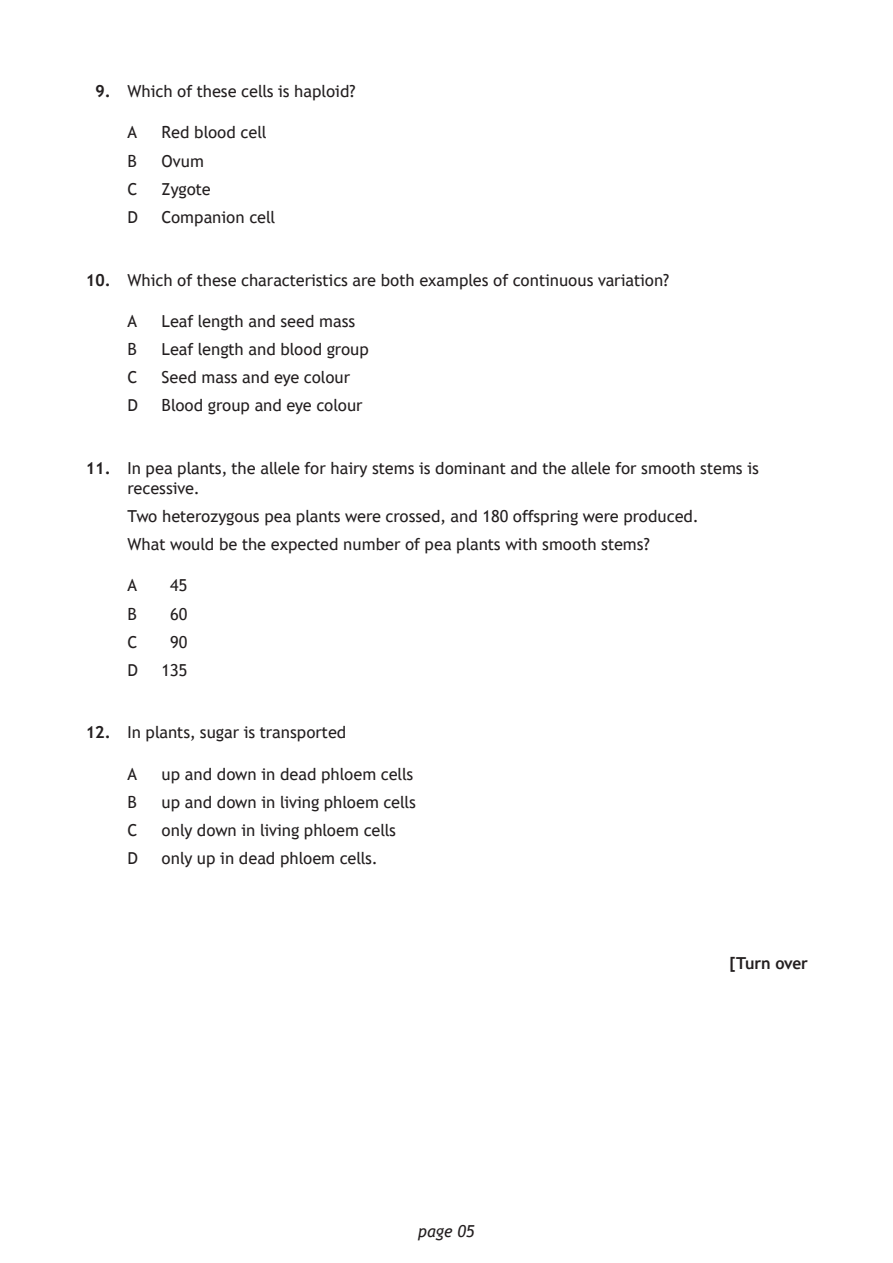
Selectable page text
9. Which of these cells is haploid?

    A  Red blood cell

    B  Ovum
    C  Zygote

    D  Companion cell

10. Which of these characteristics are both examples of continuous variation?

    A  Leaf length and seed mass

    B  Leaf length and blood group
    C  Seed mass and eye colour
    D  Blood group and eye colour

11. In pea plants, the allele for hairy stems is dominant and the allele for smooth stems is
    recessive.
    Two heterozygous pea plants were crossed, and 180 offspring were produced.

    What would be the expected number of pea plants with smooth stems?

    A   45
    B   60

    C   90
    D  135

12. In plants, sugar is transported

    A  up and down in dead phloem cells

    B  up and down in living phloem cells
    C  only down in living phloem cells

    D  only up in dead phloem cells.

                                                           [Turn over

                              page 05
PDF page 6
Paper 1, Question 13Paper 1, Question 14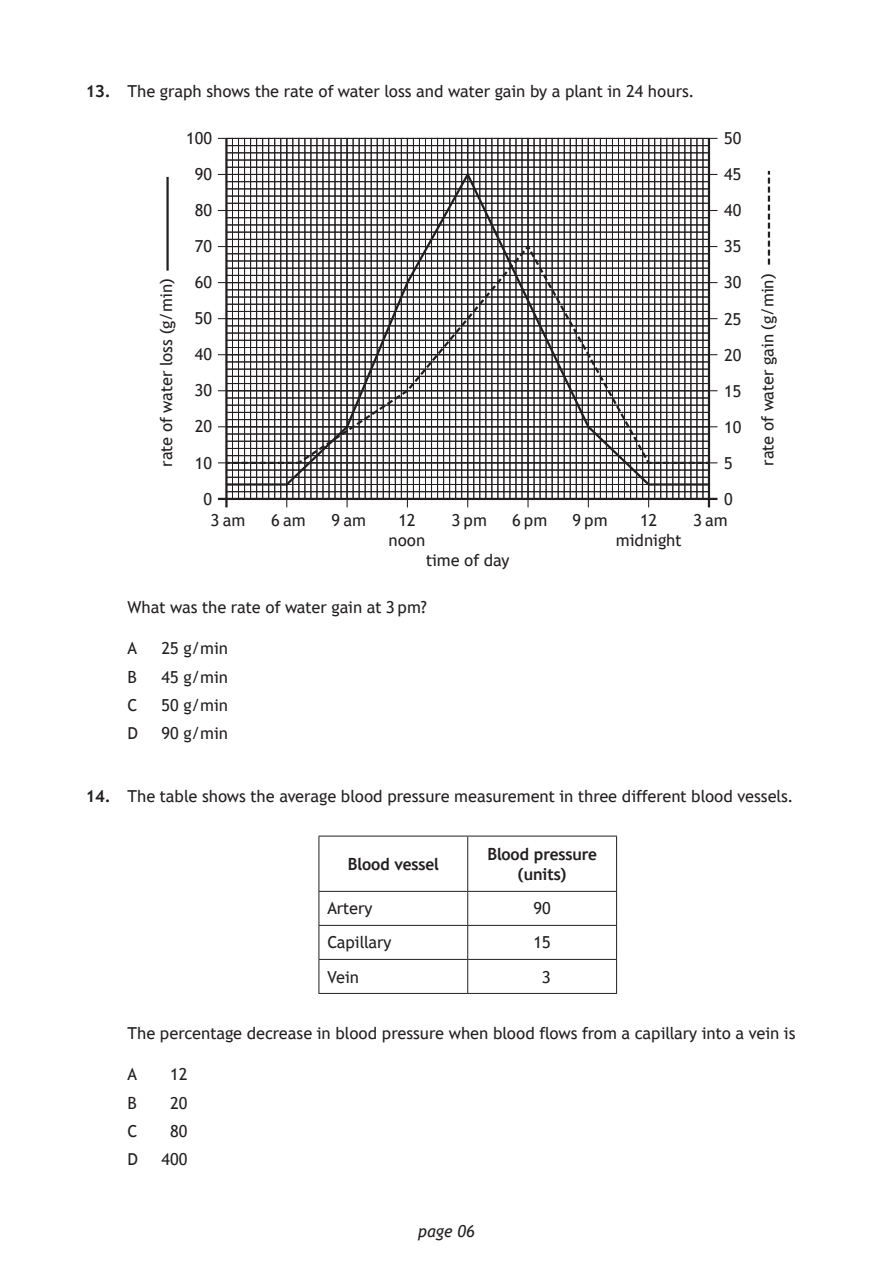
Selectable page text
13. The graph shows the rate of water loss and water gain by a plant in 24 hours.

                               time of day

                              page 06
       )nim/g(
       ssol
       retaw
       fo
       etar
                                                              )nim/g(
                                                              niag
                                                              retaw
                                                              fo
                                                              etar
         100                                               50
          90                                               45
          80                                               40
          70                                               35
          60                                               30
          50                                               25
          40                                               20
          30                                               15
          20                                               10
          10                                               5
           0                                               0
           3 am  6 am 9 am   12   3 pm 6 pm  9 pm  12   3 am
                            noon                 midnight
    What was the rate of water gain at 3 pm?
    A  25 g/min
    B  45 g/min
    C  50 g/min
    D  90 g/min
14. The table shows the average blood pressure measurement in three different blood vessels.
                                     Blood pressure
                        Blood vessel
                                        (units)
                      Artery             90
                      Capillary          15
                      Vein                3
    The percentage decrease in blood pressure when blood flows from a capillary into a vein is
    A   12
    B   20
    C   80
    D  400
PDF page 7
Paper 1, Question 15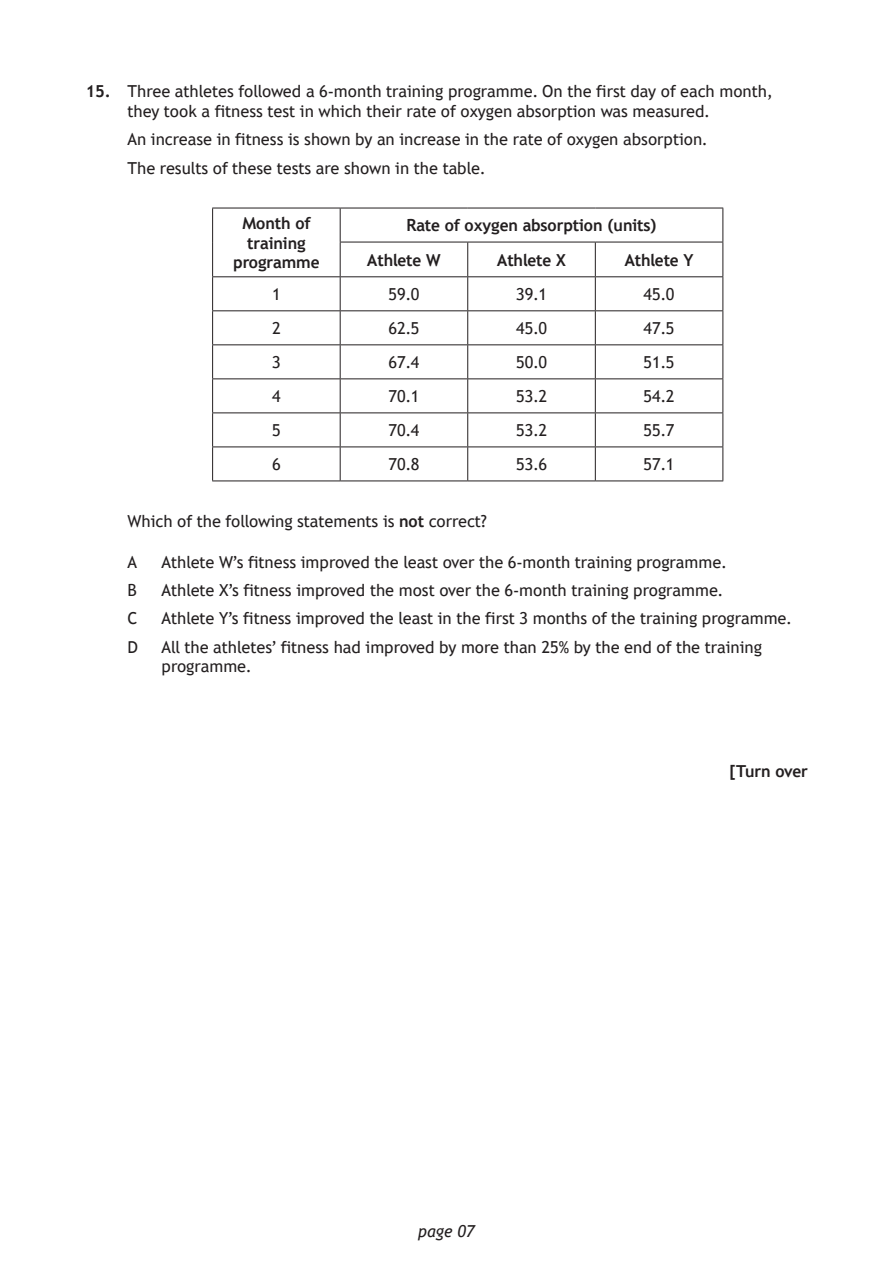
Selectable page text
15. Three athletes followed a 6‑month training programme. On the first day of each month,
    they took a fitness test in which their rate of oxygen absorption was measured.

    An increase in fitness is shown by an increase in the rate of oxygen absorption.
    The results of these tests are shown in the table.

              Month of       Rate of oxygen absorption (units)
               training
             programme    Athlete W   Athlete X  Athlete Y

                 1          59.0       39.1        45.0
                 2          62.5       45.0        47.5

                 3          67.4       50.0        51.5

                 4          70.1       53.2        54.2

                 5          70.4       53.2        55.7
                 6          70.8       53.6        57.1

    Which of the following statements is not correct?

    A  Athlete W’s fitness improved the least over the 6‑month training programme.

    B  Athlete X’s fitness improved the most over the 6‑month training programme.
    C  Athlete Y’s fitness improved the least in the first 3 months of the training programme.

    D  All the athletes’ fitness had improved by more than 25% by the end of the training
       programme.

                                                           [Turn over

                              page 07
PDF page 8
Paper 1, Question 16Paper 1, Question 17Paper 1, Question 18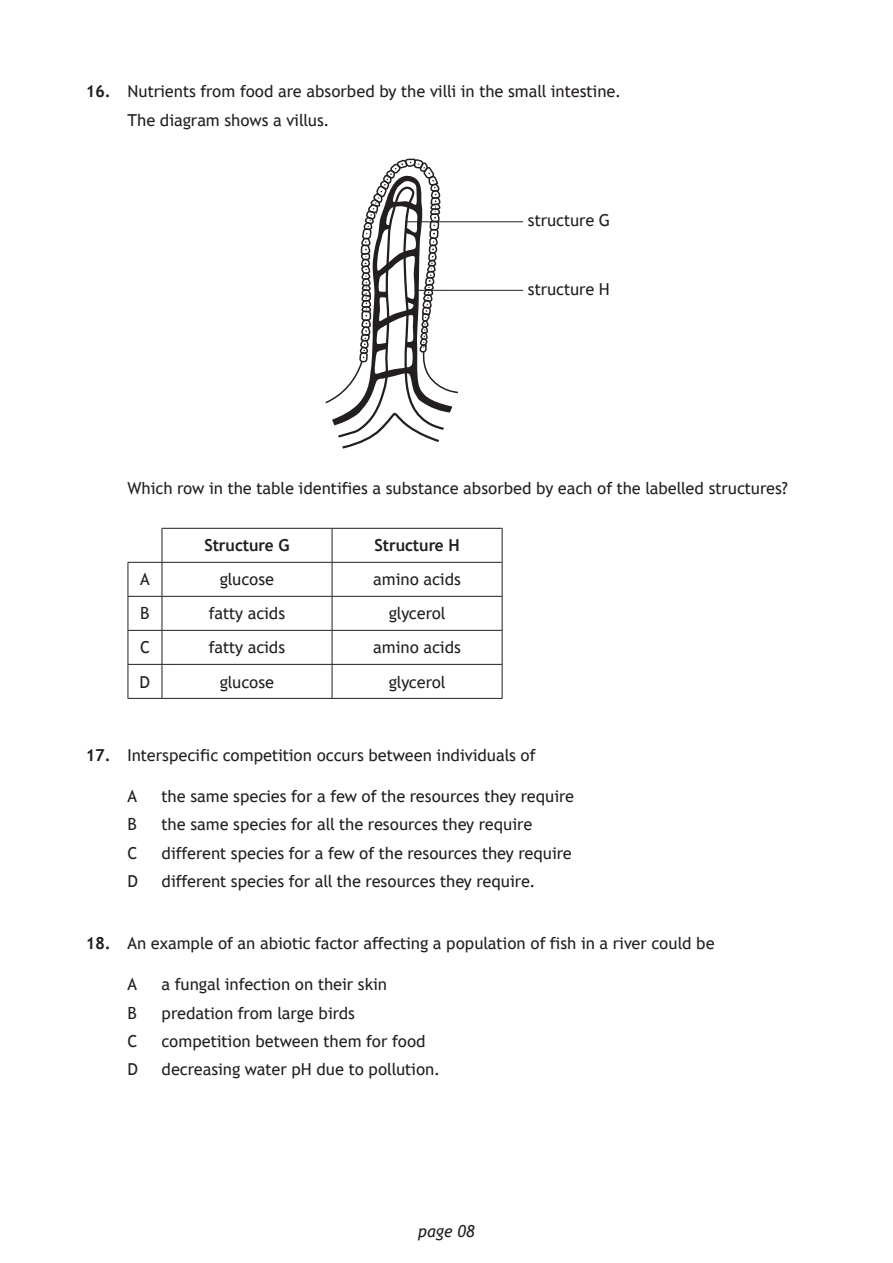
Selectable page text
16. Nutrients from food are absorbed by the villi in the small intestine.

    The diagram shows a villus.

                                         structure G

                                         structure H

    Which row in the table identifies a substance absorbed by each of the labelled structures?

           Structure G    Structure H
     A      glucose       amino acids

     B     fatty acids      glycerol

     C     fatty acids    amino acids

     D      glucose         glycerol

17. Interspecific competition occurs between individuals of

    A  the same species for a few of the resources they require

    B  the same species for all the resources they require
    C  different species for a few of the resources they require

    D  different species for all the resources they require.

18. An example of an abiotic factor affecting a population of fish in a river could be

    A  a fungal infection on their skin

    B  predation from large birds
    C  competition between them for food

    D  decreasing water pH due to pollution.

                              page 08
PDF page 9
Paper 1, Question 19Paper 1, Question 20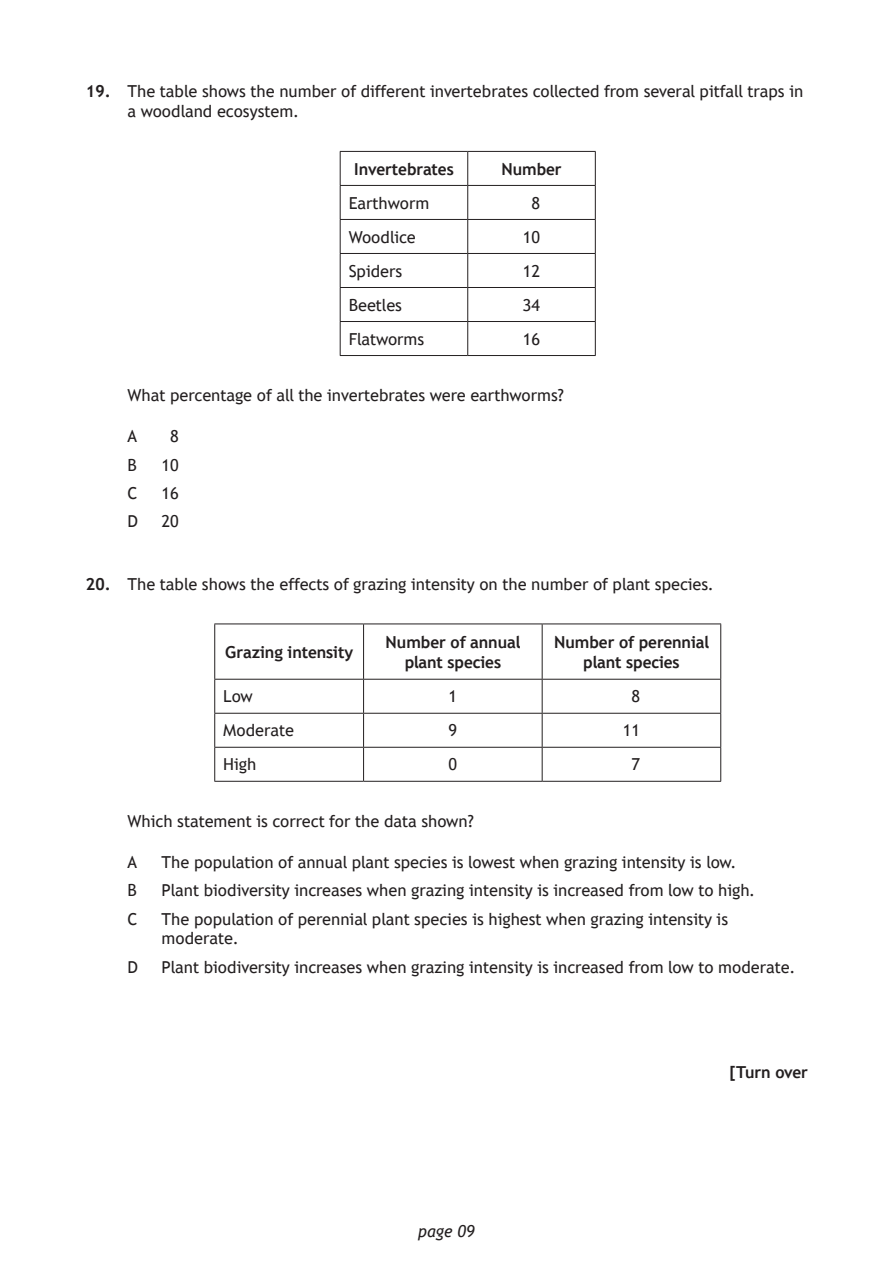
Selectable page text
19. The table shows the number of different invertebrates collected from several pitfall traps in
    a woodland ecosystem.

                         Invertebrates Number

                        Earthworm        8

                        Woodlice        10

                        Spiders         12
                        Beetles         34

                        Flatworms       16

    What percentage of all the invertebrates were earthworms?

    A   8
    B  10

    C  16
    D  20

20. The table shows the effects of grazing intensity on the number of plant species.

                           Number of annual Number of perennial
             Grazing intensity
                             plant species    plant species
             Low                 1                8
             Moderate            9               11

             High                0                7

    Which statement is correct for the data shown?

    A  The population of annual plant species is lowest when grazing intensity is low.
    B  Plant biodiversity increases when grazing intensity is increased from low to high.

    C  The population of perennial plant species is highest when grazing intensity is
       moderate.
    D  Plant biodiversity increases when grazing intensity is increased from low to moderate.

                                                           [Turn over

                              page 09
PDF page 10
Paper 1, Question 21Paper 1, Question 22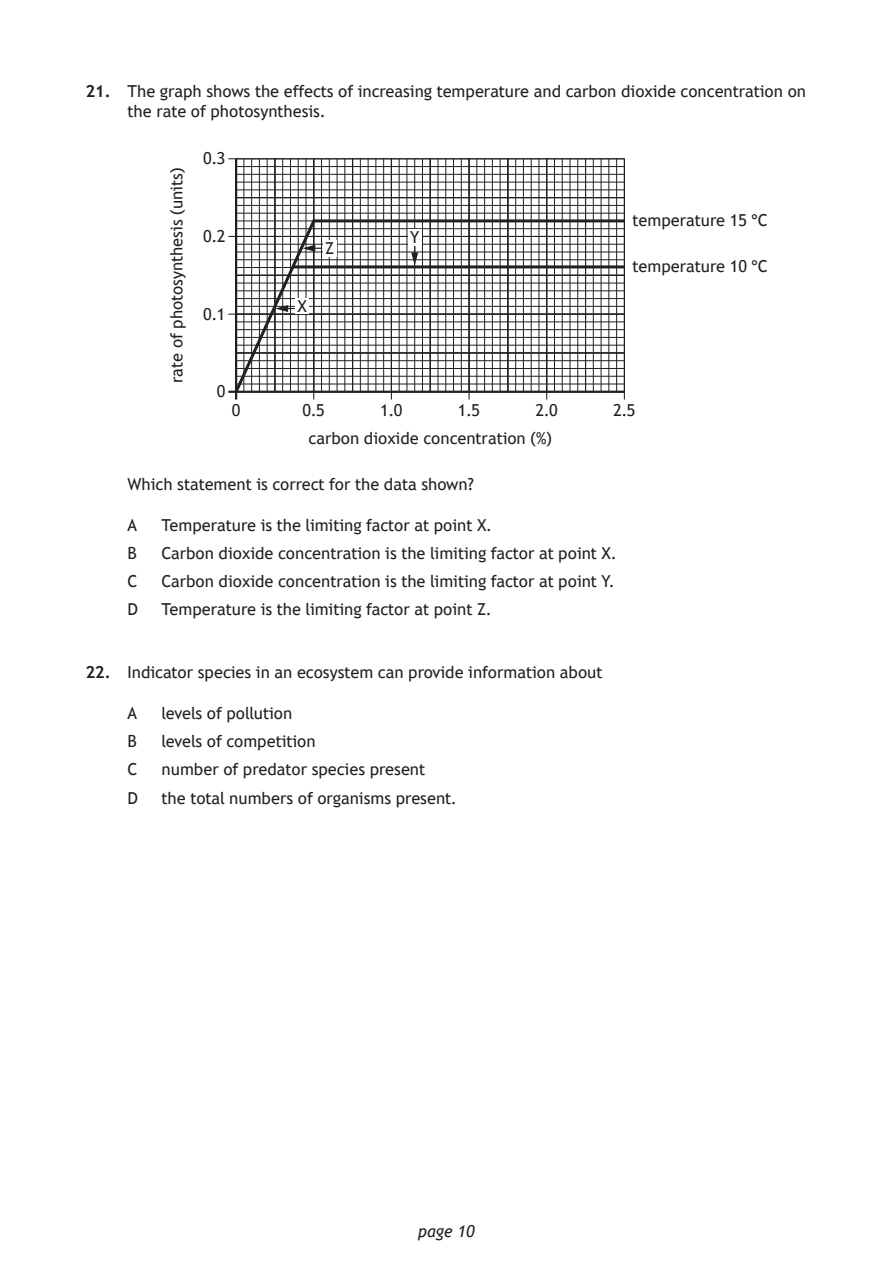
Selectable page text
21. The graph shows the effects of increasing temperature and carbon dioxide concentration on
    the rate of photosynthesis.

           0.3

           0.2

           0.1

            0

                              page 10
        )stinu(
        sisehtnysotohp
        fo
        etar
                                                  temperature 15 °C
                              Y
                      Z
                                                  temperature 10 °C
                   X
             0      0.5    1.0    1.5    2.0    2.5
                    carbon dioxide concentration (%)
    Which statement is correct for the data shown?
    A  Temperature is the limiting factor at point X.
    B  Carbon dioxide concentration is the limiting factor at point X.
    C  Carbon dioxide concentration is the limiting factor at point Y.
    D  Temperature is the limiting factor at point Z.
22. Indicator species in an ecosystem can provide information about
    A  levels of pollution
    B  levels of competition
    C  number of predator species present
    D  the total numbers of organisms present.
PDF page 11
Paper 1, Question 23Paper 1, Question 24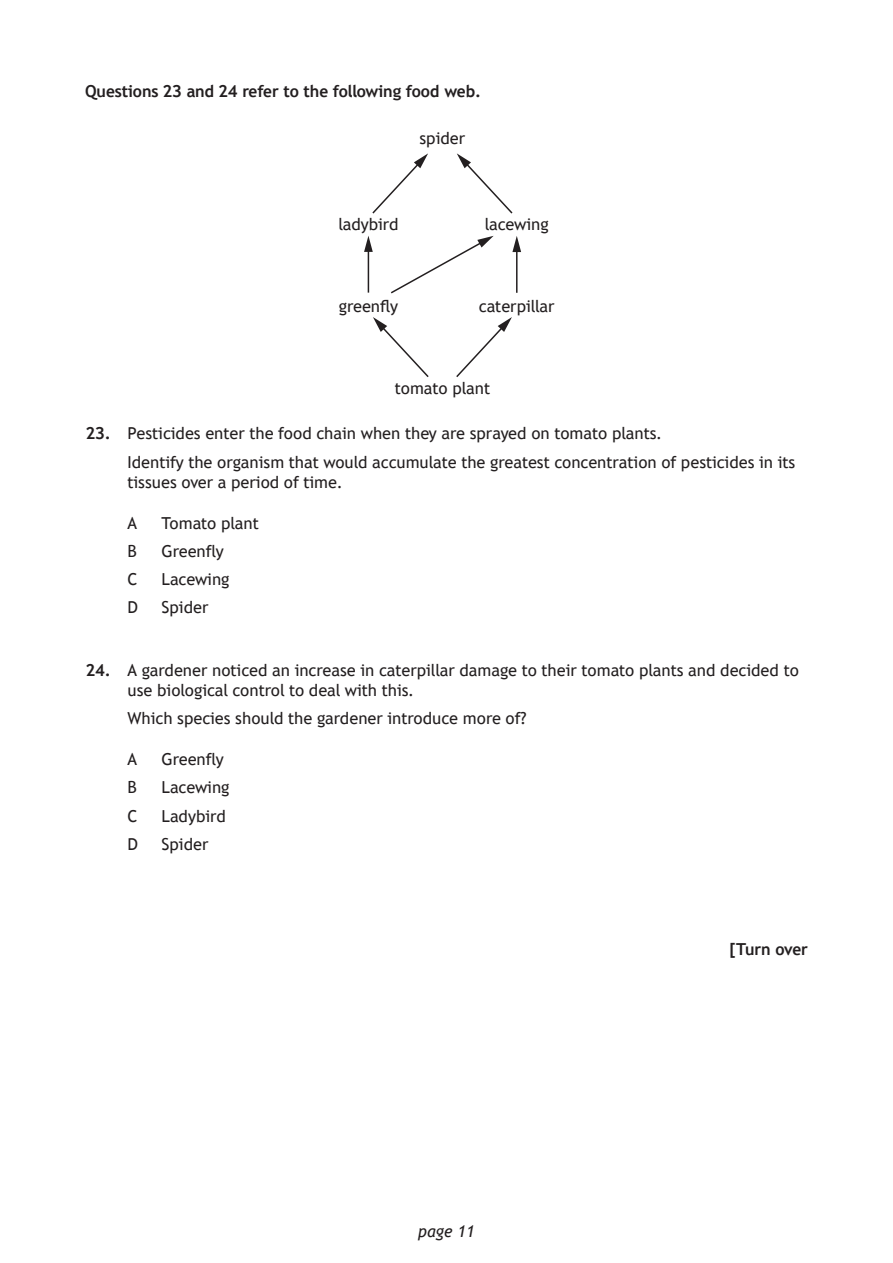
Selectable page text
Questions 23 and 24 refer to the following food web.

                               spider

                       ladybird      lacewing

                       greenfly     caterpillar

                            tomato plant

23. Pesticides enter the food chain when they are sprayed on tomato plants.
    Identify the organism that would accumulate the greatest concentration of pesticides in its
    tissues over a period of time.

    A  Tomato plant

    B  Greenfly
    C  Lacewing

    D  Spider

24. A gardener noticed an increase in caterpillar damage to their tomato plants and decided to
    use biological control to deal with this.
    Which species should the gardener introduce more of?

    A  Greenfly
    B  Lacewing
    C  Ladybird

    D  Spider

                                                           [Turn over

                              page 11
PDF page 12
Paper 1, Question 25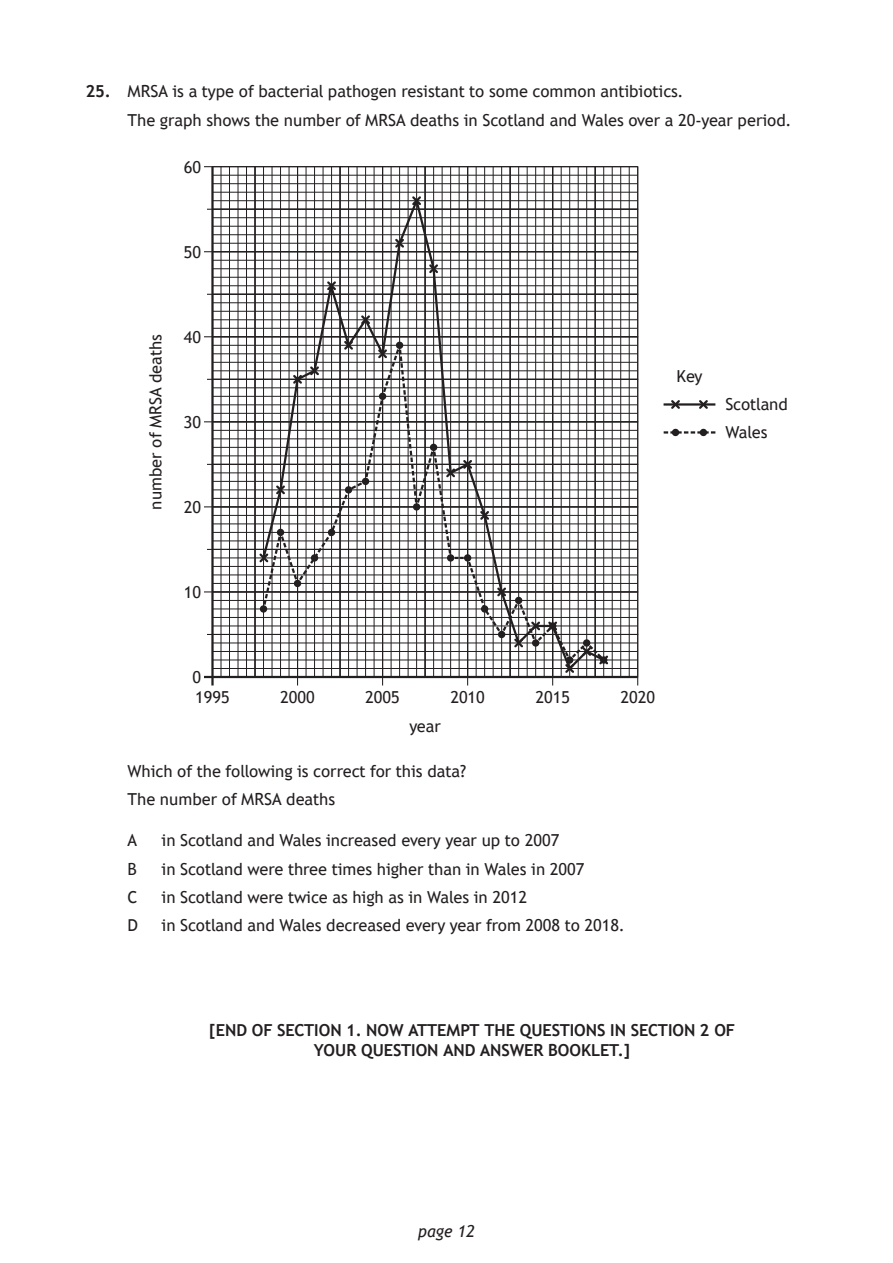
Selectable page text
25. MRSA is a type of bacterial pathogen resistant to some common antibiotics.

    The graph shows the number of MRSA deaths in Scotland and Wales over a 20‑year period.

                              page 12
      shtaed
      ASRM
      fo
      rebmun
         60
         50
         40
                                                      Key
                                                           Scotland
         30
                                                           Wales
         20
         10
          0
          1995    2000    2005   2010    2015    2020
                              year
    Which of the following is correct for this data?
    The number of MRSA deaths
    A  in Scotland and Wales increased every year up to 2007
    B  in Scotland were three times higher than in Wales in 2007
    C  in Scotland were twice as high as in Wales in 2012
    D  in Scotland and Wales decreased every year from 2008 to 2018.
           [END OF SECTION 1. NOW ATTEMPT THE QUESTIONS IN SECTION 2 OF
                     YOUR QUESTION AND ANSWER BOOKLET.]