2025 National 5 Biology - Paper 1 questions
Source: Scottish Qualifications Authority (SQA) / Qualifications Scotland. This is a StemInteract HTML companion, not an official HTML edition. Selectable text is supplied alongside original page images. Use the images or original PDF for equations, powers, fractions, vector notation, tables and diagrams; text extraction cannot fully preserve mathematical layout.
Jump to a question
PDF page 1
Selectable page text
N5
National
Qualications
2025
X807/75/02 Biology
Section 1 — Questions
TUESDAY, 27 MAY
1:30 PM – 4:00 PM
Instructions for the completion of Section 1 are given on page 02 of your question and answer
booklet X807/75/01.
Record your answers on the answer grid on page 03 of your question and answer booklet.
Before leaving the examination room you must give your question and answer booklet to the
Invigilator; if you do not, you may lose all the marks for this paper.
©
*X8077502*
A/PBPDF page 2
Paper 1, Question 1Paper 1, Question 2Paper 1, Question 3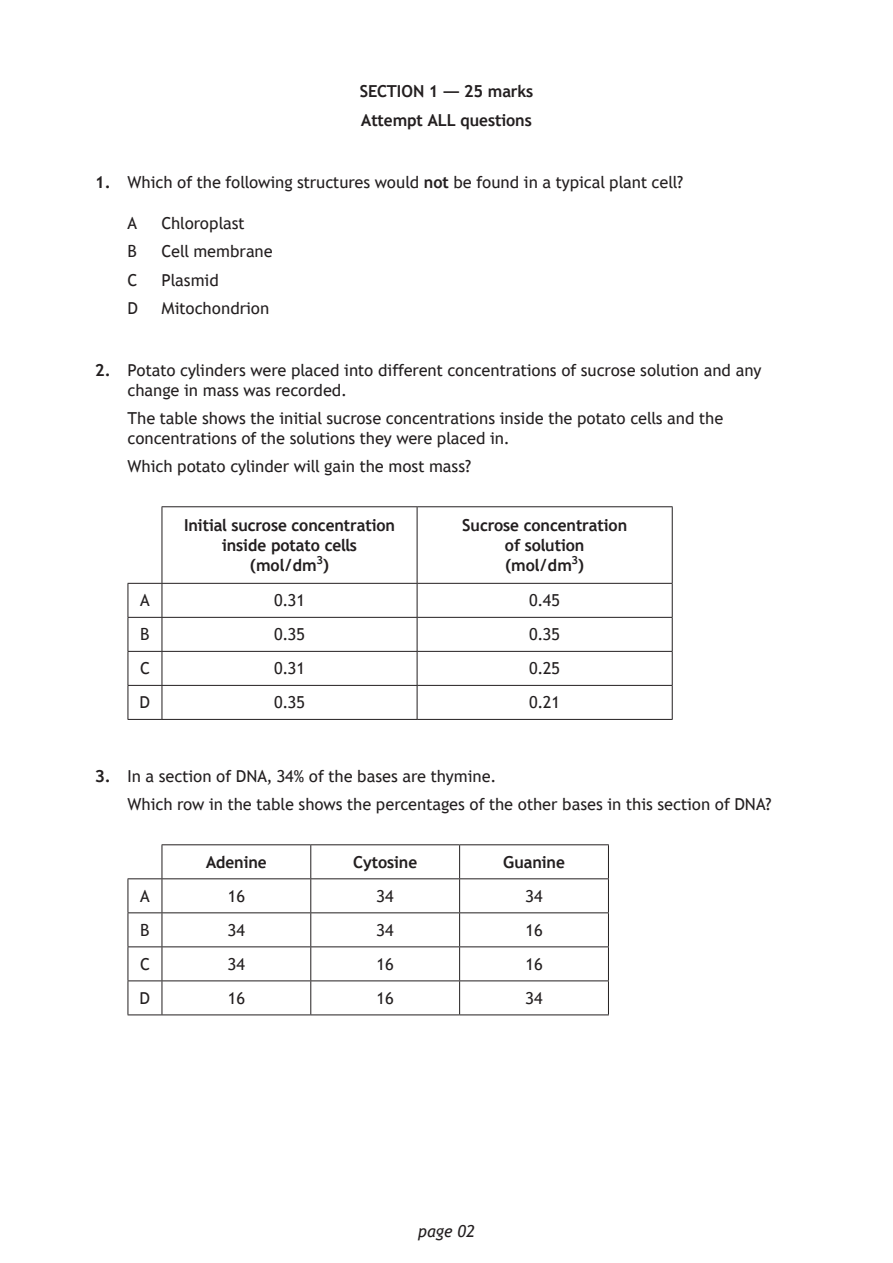
Selectable page text
SECTION 1 — 25 marks

                        Attempt ALL questions

1. Which of the following structures would not be found in a typical plant cell?

   A  Chloroplast

   B  Cell membrane
   C  Plasmid
   D  Mitochondrion

2. Potato cylinders were placed into different concentrations of sucrose solution and any
   change in mass was recorded.
   The table shows the initial sucrose concentrations inside the potato cells and the
   concentrations of the solutions they were placed in.

   Which potato cylinder will gain the most mass?

        Initial sucrose concentration Sucrose concentration
           inside potato cells       of solution
              (mol/dm³)              (mol/dm³)
    A           0.31                    0.45

    B           0.35                    0.35

    C           0.31                    0.25

    D           0.35                    0.21

3. In a section of DNA, 34% of the bases are thymine.

   Which row in the table shows the percentages of the other bases in this section of DNA?

          Adenine      Cytosine      Guanine

    A       16            34           34
    B       34            34           16

    C       34            16           16

    D       16            16           34

                             page 02
PDF page 3
Paper 1, Question 4Paper 1, Question 5Paper 1, Question 6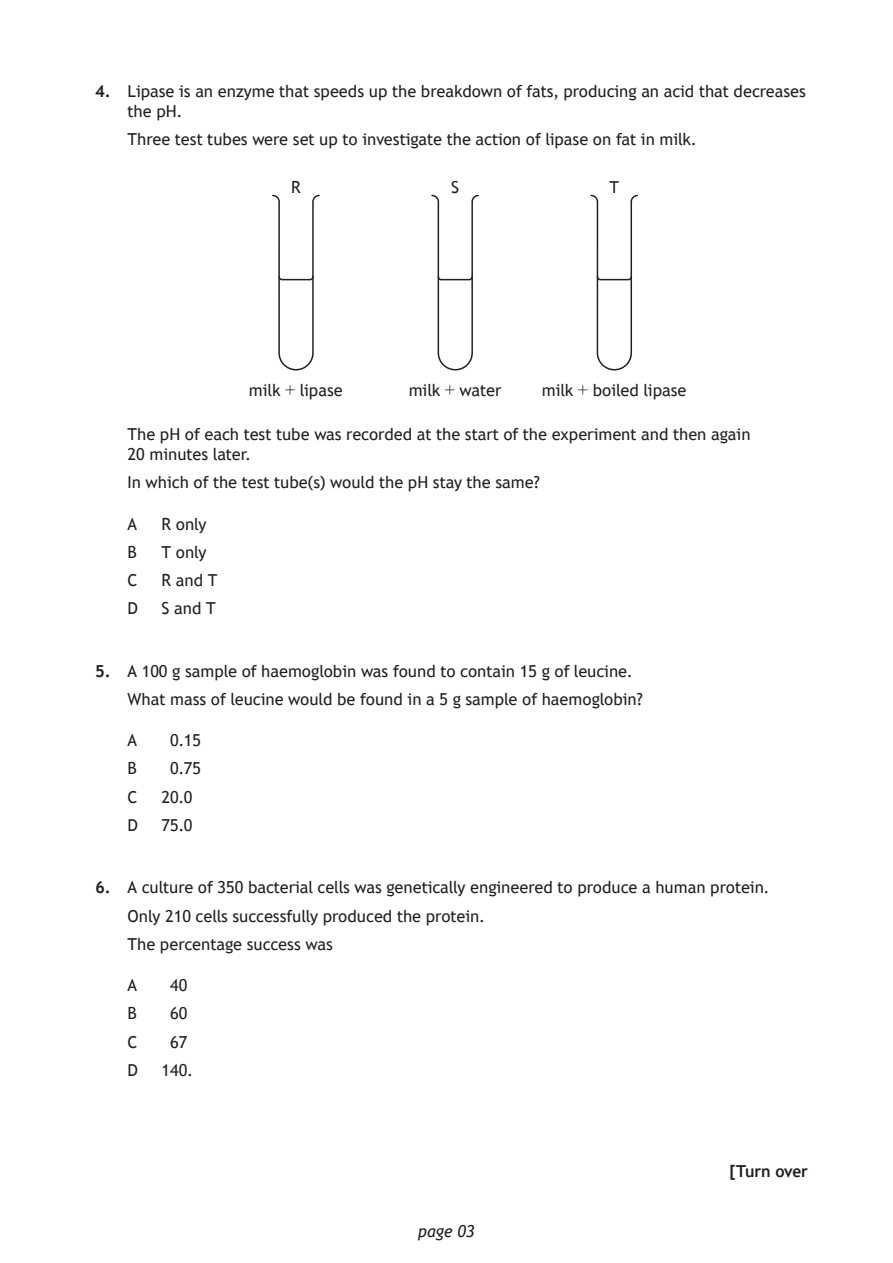
Selectable page text
4. Lipase is an enzyme that speeds up the breakdown of fats, producing an acid that decreases
   the pH.

   Three test tubes were set up to investigate the action of lipase on fat in milk.

                  R             S              T

              milk + lipase  milk + water milk + boiled lipase

   The pH of each test tube was recorded at the start of the experiment and then again
   20 minutes later.
   In which of the test tube(s) would the pH stay the same?

   A  R only
   B  T only
   C  R and T

   D  S and T

5. A 100 g sample of haemoglobin was found to contain 15 g of leucine.

   What mass of leucine would be found in a 5 g sample of haemoglobin?

   A   0.15
   B   0.75

   C  20.0
   D  75.0

6. A culture of 350 bacterial cells was genetically engineered to produce a human protein.

   Only 210 cells successfully produced the protein.
   The percentage success was

   A   40

   B   60
   C   67

   D  140.

                                                          [Turn over

                             page 03
PDF page 4
Paper 1, Question 7Paper 1, Question 8Paper 1, Question 9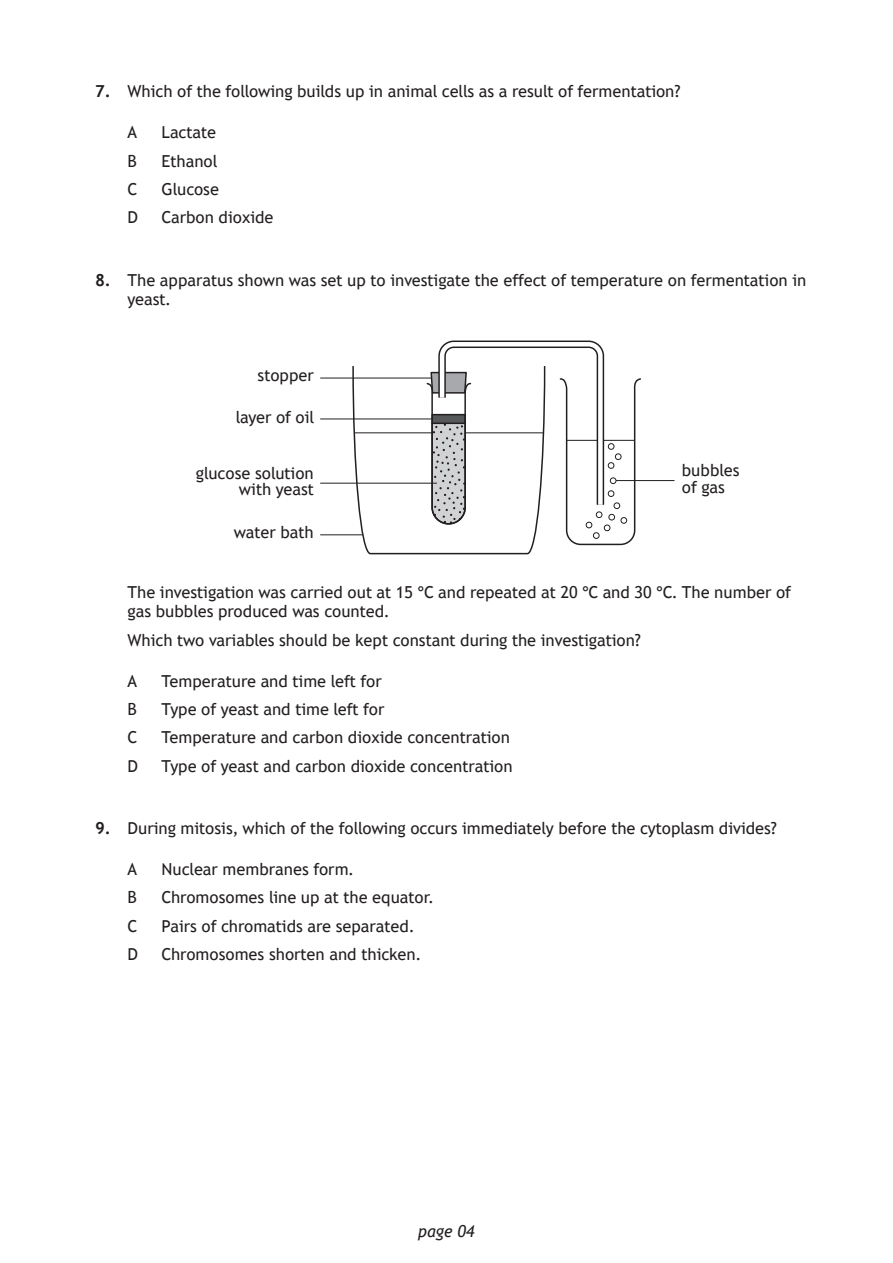
Selectable page text
7. Which of the following builds up in animal cells as a result of fermentation?

   A  Lactate

   B  Ethanol
   C  Glucose

   D  Carbon dioxide

8. The apparatus shown was set up to investigate the effect of temperature on fermentation in
   yeast.

               stopper

             layer of oil

         glucose solution                             bubbles
             with yeast                               of gas

             water bath

   The investigation was carried out at 15 °C and repeated at 20 °C and 30 °C. The number of
   gas bubbles produced was counted.
   Which two variables should be kept constant during the investigation?

   A  Temperature and time left for
   B  Type of yeast and time left for
   C  Temperature and carbon dioxide concentration

   D  Type of yeast and carbon dioxide concentration

9. During mitosis, which of the following occurs immediately before the cytoplasm divides?

   A  Nuclear membranes form.

   B  Chromosomes line up at the equator.
   C  Pairs of chromatids are separated.

   D  Chromosomes shorten and thicken.

                             page 04
PDF page 5
Paper 1, Question 10Paper 1, Question 11Paper 1, Question 12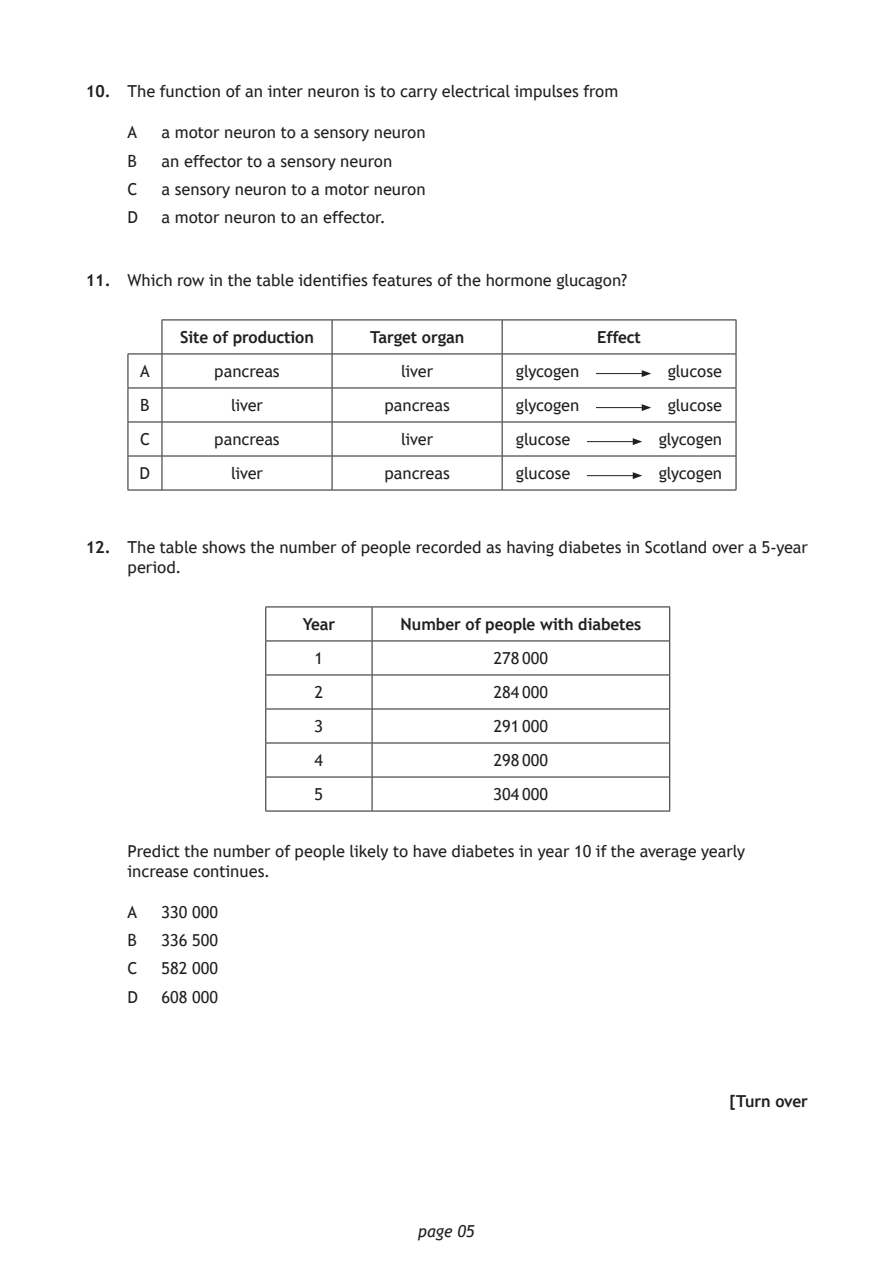
Selectable page text
10. The function of an inter neuron is to carry electrical impulses from

    A  a motor neuron to a sensory neuron

    B  an effector to a sensory neuron
    C  a sensory neuron to a motor neuron

    D  a motor neuron to an effector.

11. Which row in the table identifies features of the hormone glucagon?

         Site of production Target organ       Effect

     A      pancreas         liver     glycogen      glucose
     B       liver         pancreas    glycogen      glucose

     C      pancreas         liver     glucose       glycogen

     D       liver         pancreas    glucose       glycogen

12. The table shows the number of people recorded as having diabetes in Scotland over a 5-year
    period.

                    Year     Number of people with diabetes
                     1               278 000

                     2               284 000

                     3               291 000

                     4               298 000
                     5               304 000

    Predict the number of people likely to have diabetes in year 10 if the average yearly
    increase continues.

    A  330 000

    B  336 500
    C  582 000

    D  608 000

                                                           [Turn over

                              page 05
PDF page 6
Paper 1, Question 13Paper 1, Question 14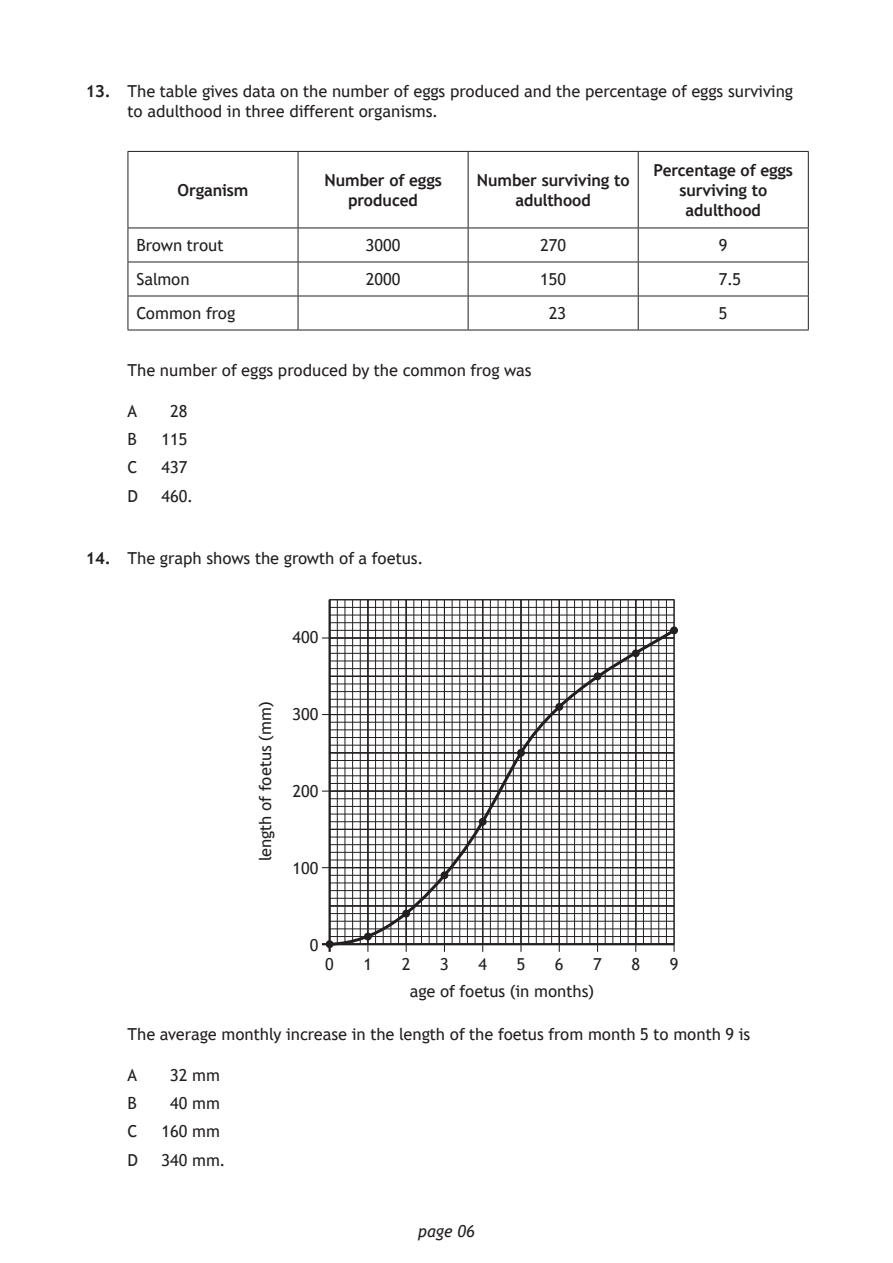
Selectable page text
13. The table gives data on the number of eggs produced and the percentage of eggs surviving
    to adulthood in three different organisms.

                                                    Percentage of eggs
                      Number of eggs Number surviving to
        Organism                                      surviving to
                        produced       adulthood
                                                       adulthood
     Brown trout          3000            270             9
     Salmon               2000            150             7.5

     Common frog                          23              5

    The number of eggs produced by the common frog was

    A   28
    B  115

    C  437
    D  460.

14. The graph shows the growth of a foetus.

                   400

                   300

                   200

                   100

                    0
                      0  1   2  3   4
                              age of foetus (in months)

                              page 06
                )mm(
                suteof
                fo
                htgnel
                                        5  6   7  8   9
    The average monthly increase in the length of the foetus from month 5 to month 9 is
    A   32 mm
    B   40 mm
    C  160 mm
    D  340 mm.
PDF page 7
Paper 1, Question 15Paper 1, Question 16Paper 1, Question 17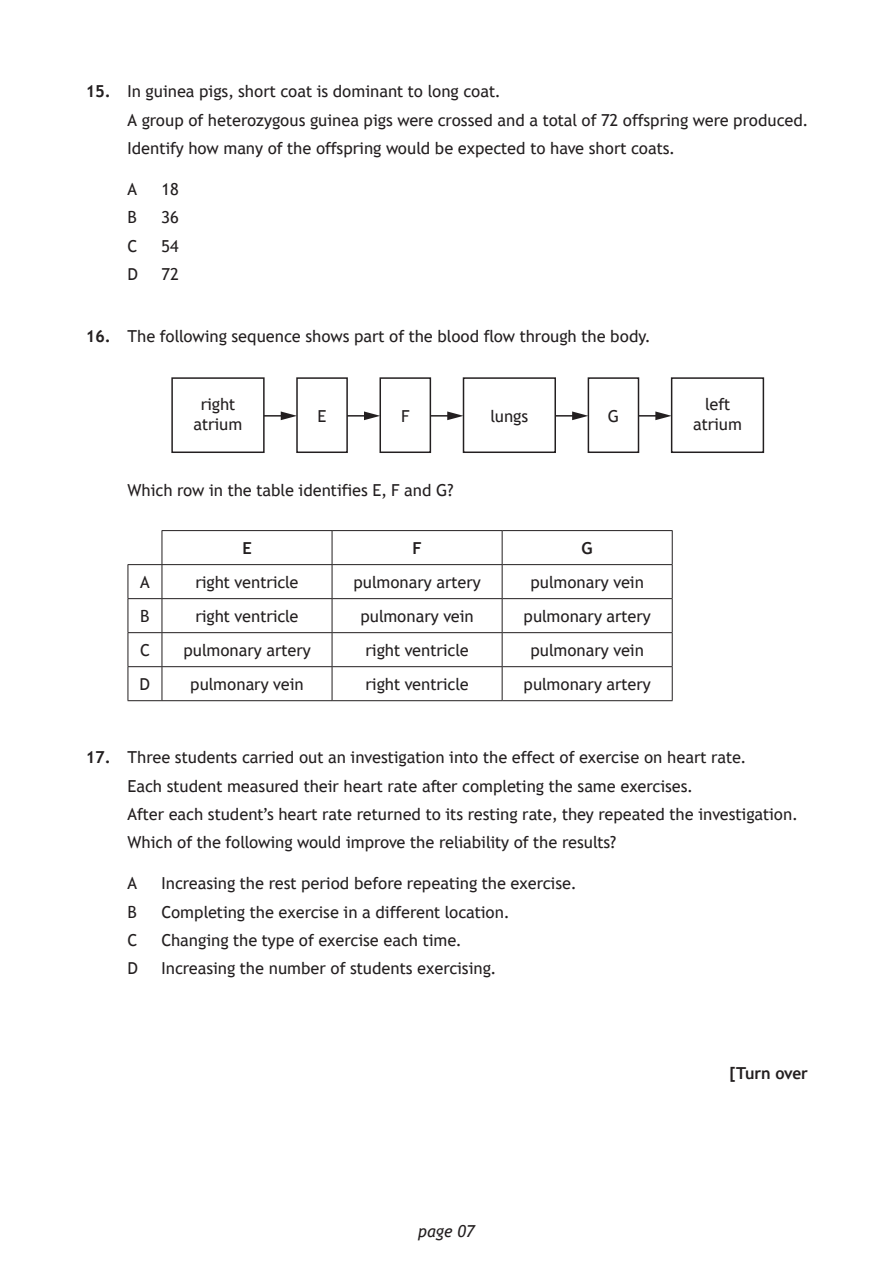
Selectable page text
15. In guinea pigs, short coat is dominant to long coat.

    A group of heterozygous guinea pigs were crossed and a total of 72 offspring were produced.
    Identify how many of the offspring would be expected to have short coats.

    A  18

    B  36
    C  54

    D  72

16. The following sequence shows part of the blood flow through the body.

          right                                          left
                     E       F       lungs      G
          atrium                                        atrium

    Which row in the table identifies E, F and G?

              E               F              G
     A    right ventricle pulmonary artery pulmonary vein

     B    right ventricle pulmonary vein pulmonary artery

     C   pulmonary artery right ventricle pulmonary vein

     D   pulmonary vein   right ventricle pulmonary artery

17. Three students carried out an investigation into the effect of exercise on heart rate.
    Each student measured their heart rate after completing the same exercises.
    After each student’s heart rate returned to its resting rate, they repeated the investigation.

    Which of the following would improve the reliability of the results?

    A  Increasing the rest period before repeating the exercise.
    B  Completing the exercise in a different location.

    C  Changing the type of exercise each time.
    D  Increasing the number of students exercising.

                                                           [Turn over

                              page 07
PDF page 8
Paper 1, Question 18Paper 1, Question 19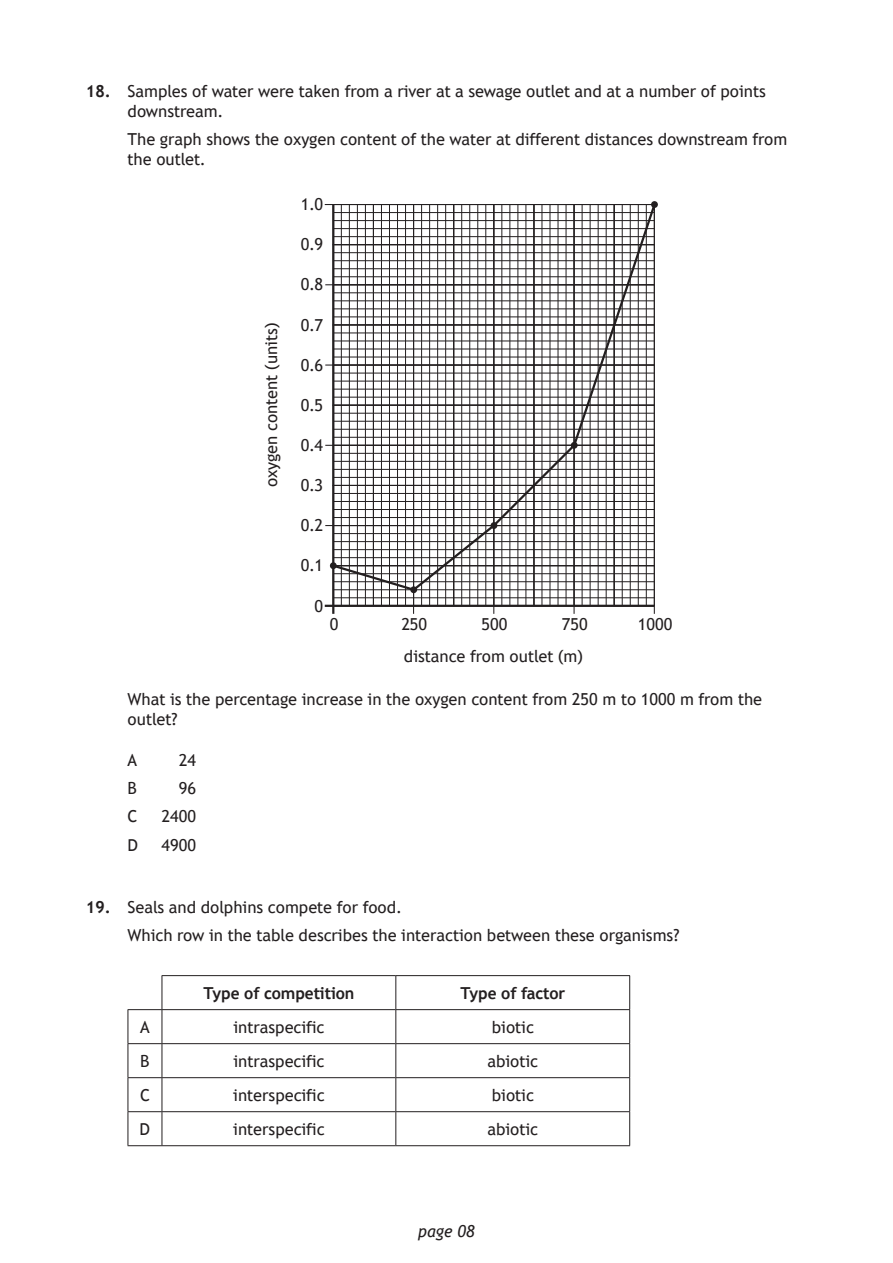
Selectable page text
18. Samples of water were taken from a river at a sewage outlet and at a number of points
    downstream.

    The graph shows the oxygen content of the water at different distances downstream from
    the outlet.

                              page 08
                )stinu(
                tnetnoc
                negyxo
                    1.0
                    0.9
                    0.8
                    0.7
                    0.6
                    0.5
                    0.4
                    0.3
                    0.2
                    0.1
                     0
                      0      250    500     750    1000
                             distance from outlet (m)
    What is the percentage increase in the oxygen content from 250 m to 1000 m from the
    outlet?
    A   24
    B   96
    C  2400
    D  4900
19. Seals and dolphins compete for food.
    Which row in the table describes the interaction between these organisms?
           Type of competition    Type of factor
     A       intraspecific           biotic
     B       intraspecific           abiotic
     C       interspecific           biotic
     D       interspecific           abiotic
PDF page 9
Paper 1, Question 20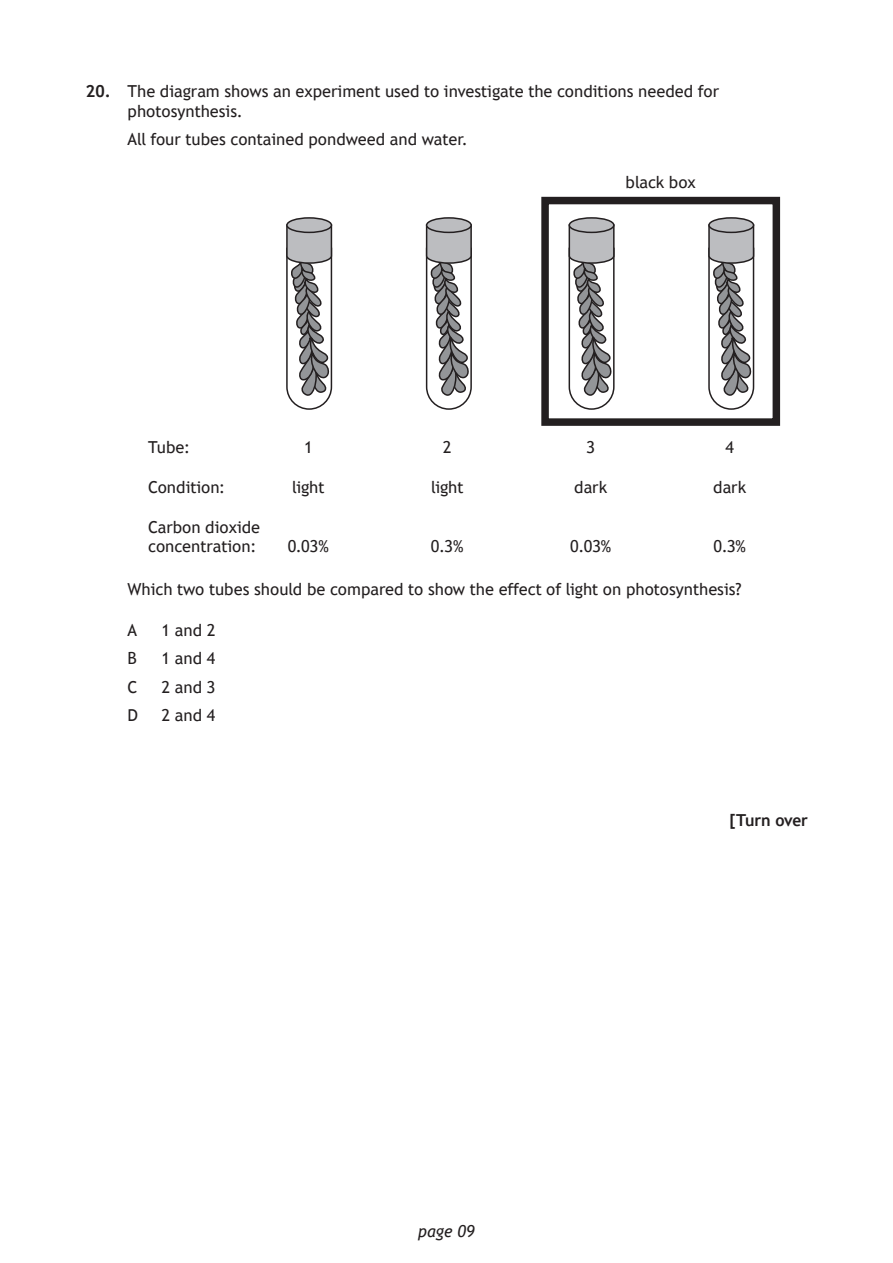
Selectable page text
20. The diagram shows an experiment used to investigate the conditions needed for
    photosynthesis.

    All four tubes contained pondweed and water.

                                                  black box

      Tube:         1            2            3            4

      Condition:   light        light        dark         dark

      Carbon dioxide
      concentration: 0.03%      0.3%        0.03%         0.3%

    Which two tubes should be compared to show the effect of light on photosynthesis?

    A  1 and 2
    B  1 and 4

    C  2 and 3
    D  2 and 4

                                                           [Turn over

                              page 09
PDF page 10
Paper 1, Question 21Paper 1, Question 22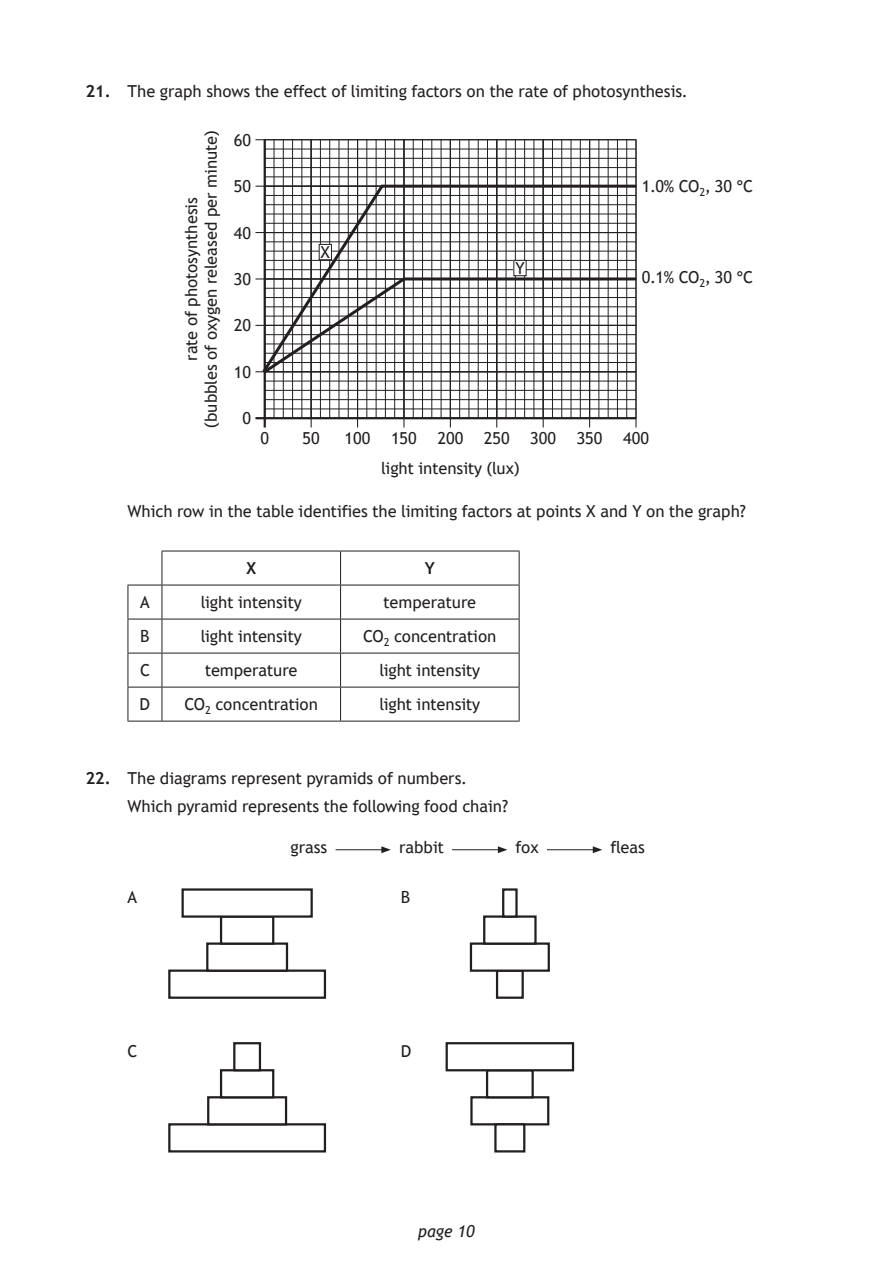
Selectable page text
21. The graph shows the effect of limiting factors on the rate of photosynthesis.

                              page 10
         sisehtnysotohp
         fo
         etar
           )etunim
           rep
           desaeler
           negyxo
           fo
           selbbub(
              60
              50                                   1.0% CO₂, 30 °C
              40
                     X
                                       Y
              30                                   0.1% CO₂, 30 °C
              20
              10
              0
                0   50  100 150 200 250  300 350 400
                           light intensity (lux)
    Which row in the table identifies the limiting factors at points X and Y on the graph?
               X               Y
     A    light intensity  temperature
     B    light intensity CO₂ concentration
     C     temperature     light intensity
     D   CO₂ concentration light intensity
22. The diagrams represent pyramids of numbers.
    Which pyramid represents the following food chain?
                   grass     rabbit    fox      fleas
    A                        B
    C                        D
PDF page 11
Paper 1, Question 23Paper 1, Question 24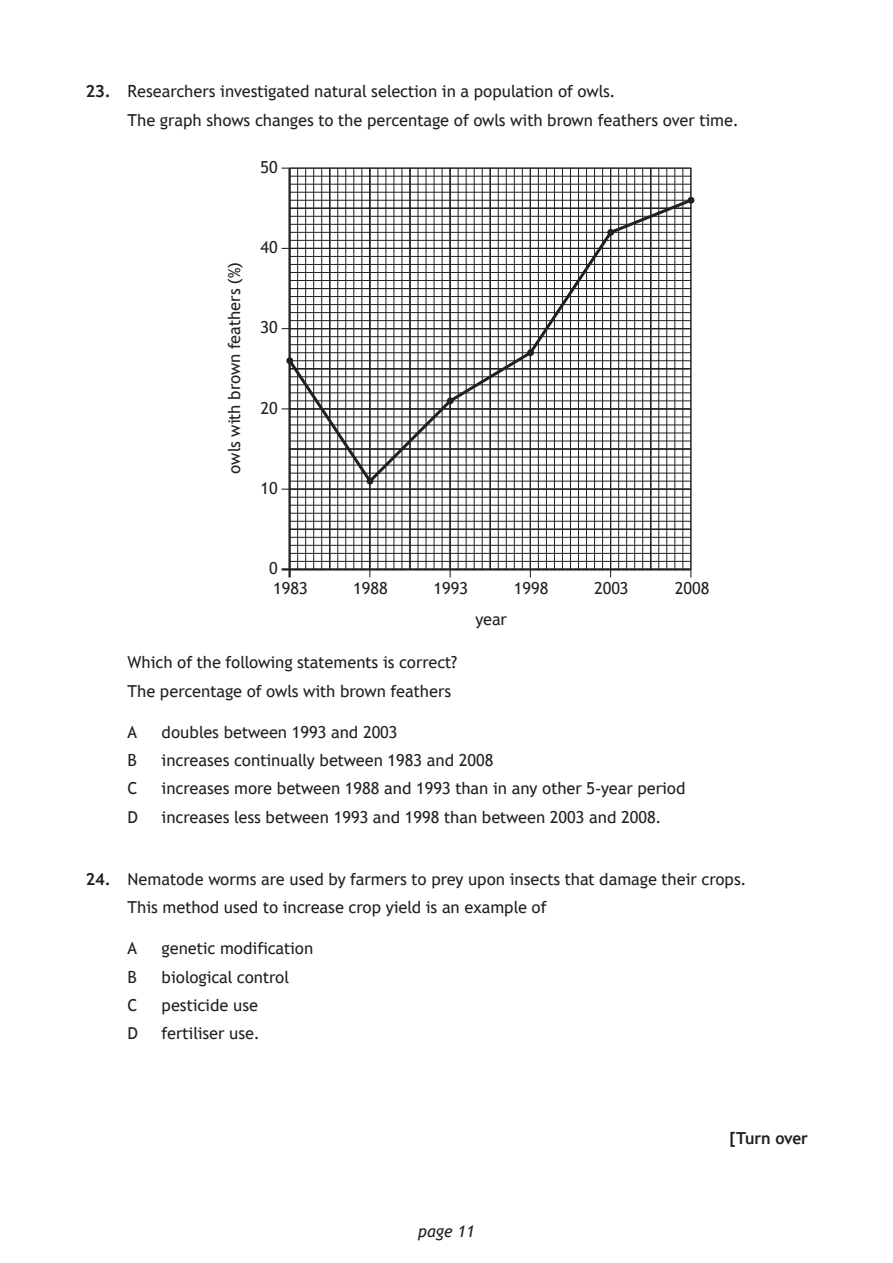
Selectable page text
23. Researchers investigated natural selection in a population of owls.

    The graph shows changes to the percentage of owls with brown feathers over time.

                50

                40

                30

                20

                10

                 0

                                    year

                              page 11
             )%(
             srehtaef
             nworb
             htiw
             slwo
                 1983   1988    1993   1998    2003   2008
    Which of the following statements is correct?
    The percentage of owls with brown feathers
    A  doubles between 1993 and 2003
    B  increases continually between 1983 and 2008
    C  increases more between 1988 and 1993 than in any other 5-year period
    D  increases less between 1993 and 1998 than between 2003 and 2008.
24. Nematode worms are used by farmers to prey upon insects that damage their crops.
    This method used to increase crop yield is an example of
    A  genetic modification
    B  biological control
    C  pesticide use
    D  fertiliser use.
                                                           [Turn over
PDF page 12
Paper 1, Question 25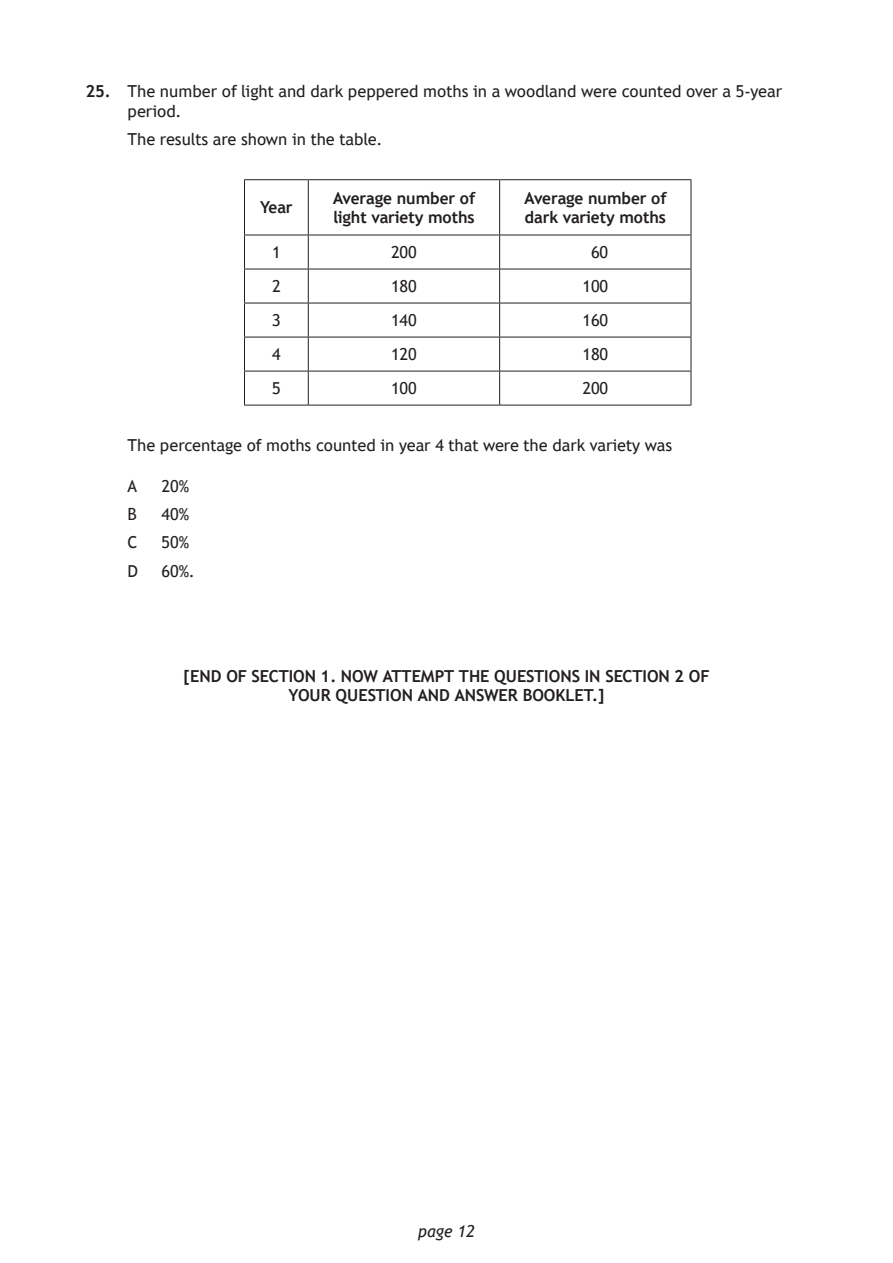
Selectable page text
25. The number of light and dark peppered moths in a woodland were counted over a 5-year
    period.

    The results are shown in the table.

                       Average number of Average number of
                Year
                       light variety moths dark variety moths
                 1          200               60
                 2          180               100

                 3          140               160

                 4          120               180

                 5          100               200

    The percentage of moths counted in year 4 that were the dark variety was

    A  20%
    B  40%
    C  50%

    D  60%.

         [END OF SECTION 1. NOW ATTEMPT THE QUESTIONS IN SECTION 2 OF
                   YOUR QUESTION AND ANSWER BOOKLET.]

                              page 12