2022 National 5 Biology - Paper 1 questions
Source: Scottish Qualifications Authority (SQA) / Qualifications Scotland. This is a StemInteract HTML companion, not an official HTML edition. Selectable text is supplied alongside original page images. Use the images or original PDF for equations, powers, fractions, vector notation, tables and diagrams; text extraction cannot fully preserve mathematical layout.
Jump to a question
PDF page 1
Selectable page text
N5
National
Qualications
2022
X807/75/02 Biology
Section 1 — Questions
THURSDAY, 19 MAY
1:00 PM – 3:30 PM
Instructions for the completion of Section 1 are given on page 02 of your question and answer
booklet X807/75/01.
Record your answers on the answer grid on page 03 of your question and answer booklet.
Before leaving the examination room you must give your question and answer booklet to the
Invigilator; if you do not, you may lose all the marks for this paper.
©
*X8077502*
A/PBPDF page 2
Paper 1, Question 1Paper 1, Question 2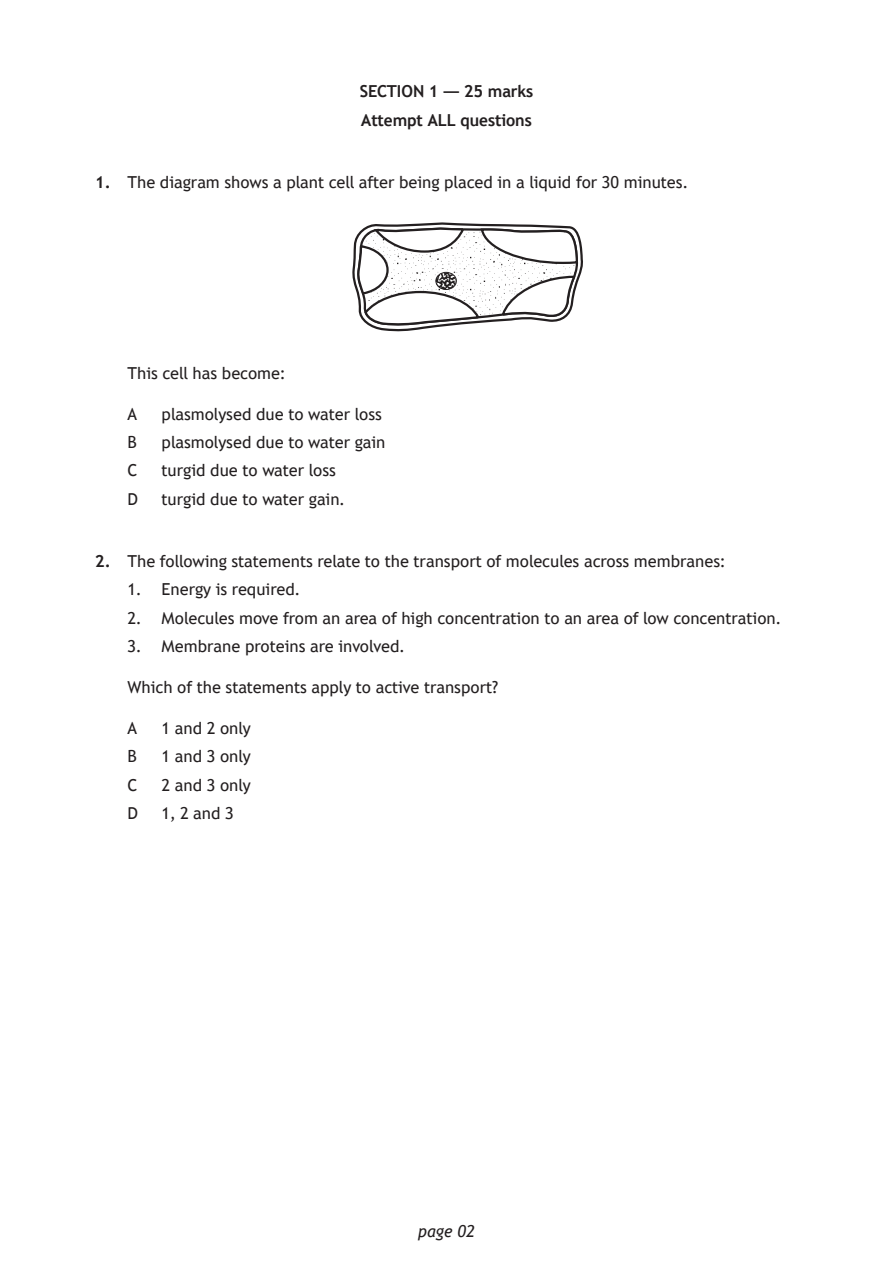
Selectable page text
SECTION 1 — 25 marks

                        Attempt ALL questions

1. The diagram shows a plant cell after being placed in a liquid for 30 minutes.

   This cell has become:

   A  plasmolysed due to water loss
   B  plasmolysed due to water gain

   C  turgid due to water loss
   D  turgid due to water gain.

2. The following statements relate to the transport of molecules across membranes:

   1. Energy is required.
   2. Molecules move from an area of high concentration to an area of low concentration.

   3. Membrane proteins are involved.

   Which of the statements apply to active transport?

   A  1 and 2 only
   B  1 and 3 only

   C  2 and 3 only
   D  1, 2 and 3

                             page 02
PDF page 3
Paper 1, Question 3Paper 1, Question 4Paper 1, Question 5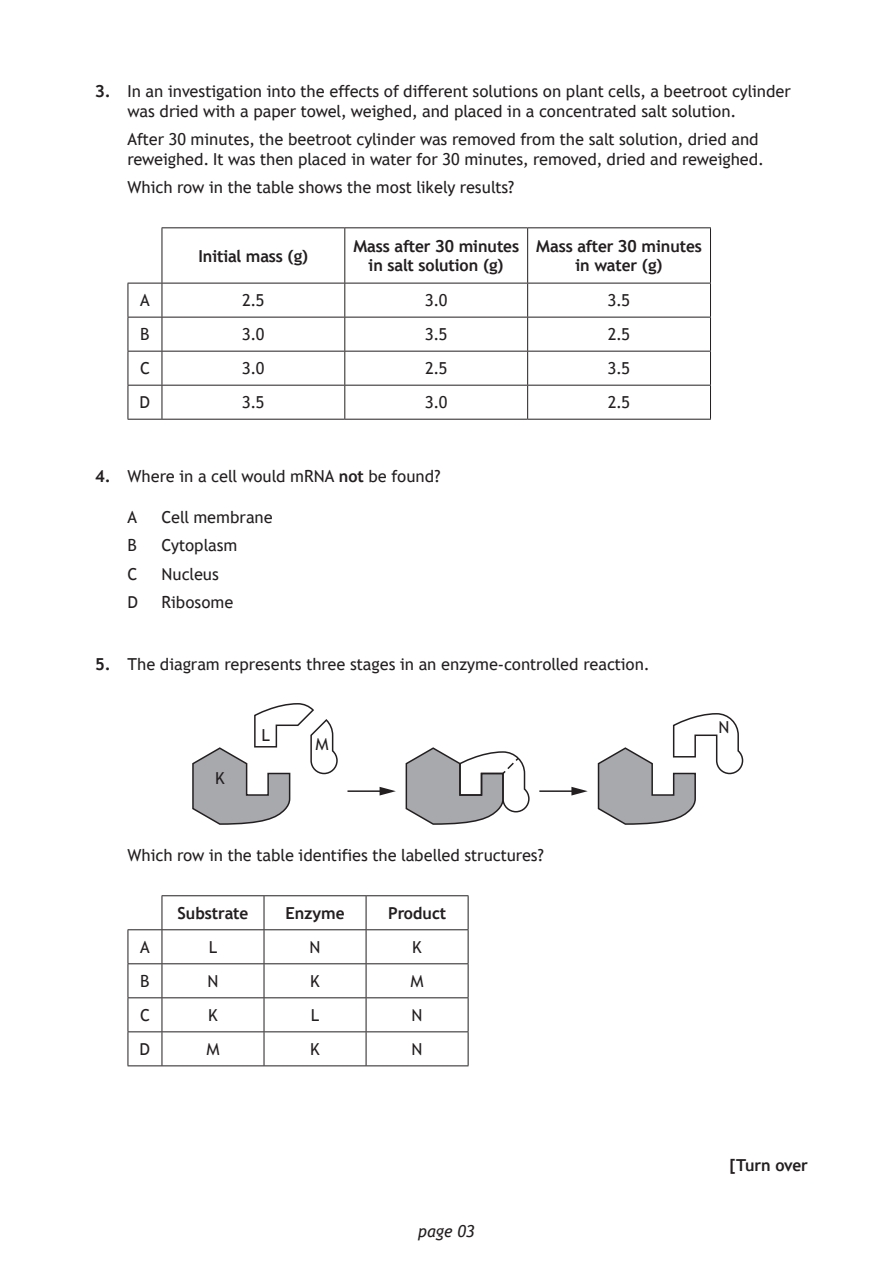
Selectable page text
3. In an investigation into the effects of different solutions on plant cells, a beetroot cylinder
   was dried with a paper towel, weighed, and placed in a concentrated salt solution.

   After 30 minutes, the beetroot cylinder was removed from the salt solution, dried and
   reweighed. It was then placed in water for 30 minutes, removed, dried and reweighed.
   Which row in the table shows the most likely results?

                       Mass after 30 minutes Mass after 30 minutes
         Initial mass (g)
                         in salt solution (g) in water (g)
    A        2.5              3.0              3.5

    B        3.0              3.5              2.5

    C        3.0              2.5              3.5
    D        3.5              3.0              2.5

4. Where in a cell would mRNA not be found?

   A  Cell membrane

   B  Cytoplasm
   C  Nucleus

   D  Ribosome

5. The diagram represents three stages in an enzyme-controlled reaction.

                                                         N
               L
                    M
           K

   Which row in the table identifies the labelled structures?

       Substrate Enzyme    Product

    A     L        N         K

    B     N         K        M

    C     K         L        N
    D     M         K        N

                                                          [Turn over

                             page 03
PDF page 4
Paper 1, Question 6Paper 1, Question 7Paper 1, Question 8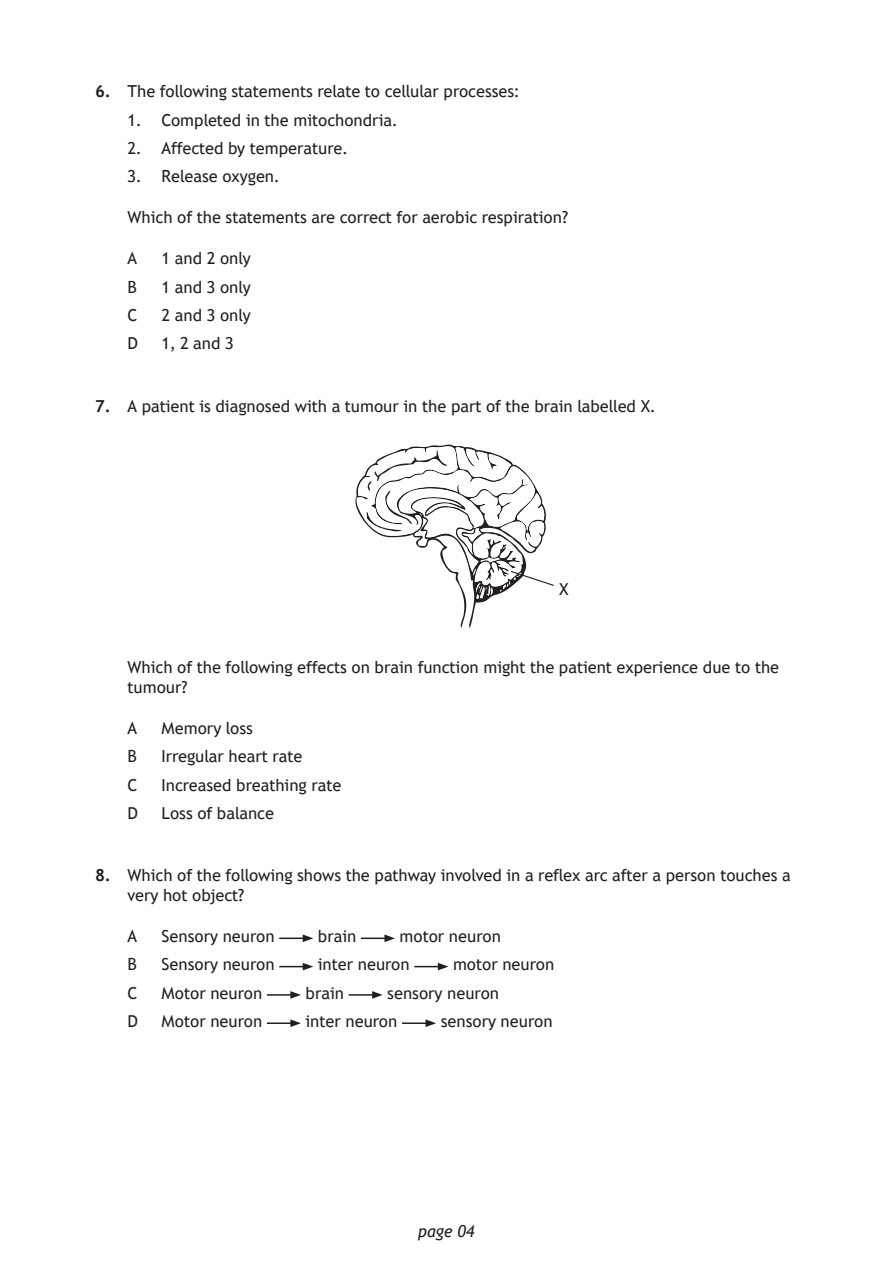
Selectable page text
6. The following statements relate to cellular processes:

   1. Completed in the mitochondria.
   2. Affected by temperature.

   3. Release oxygen.

   Which of the statements are correct for aerobic respiration?

   A  1 and 2 only
   B  1 and 3 only

   C  2 and 3 only
   D  1, 2 and 3

7. A patient is diagnosed with a tumour in the part of the brain labelled X.

                                          X

   Which of the following effects on brain function might the patient experience due to the
   tumour?

   A  Memory loss
   B  Irregular heart rate

   C  Increased breathing rate
   D  Loss of balance

8. Which of the following shows the pathway involved in a reflex arc after a person touches a
   very hot object?

   A  Sensory neuron brain  motor neuron
   B  Sensory neuron inter neuron motor neuron

   C  Motor neuron brain   sensory neuron
   D  Motor neuron inter neuron sensory neuron

                             page 04
PDF page 5
Paper 1, Question 9Paper 1, Question 10Paper 1, Question 11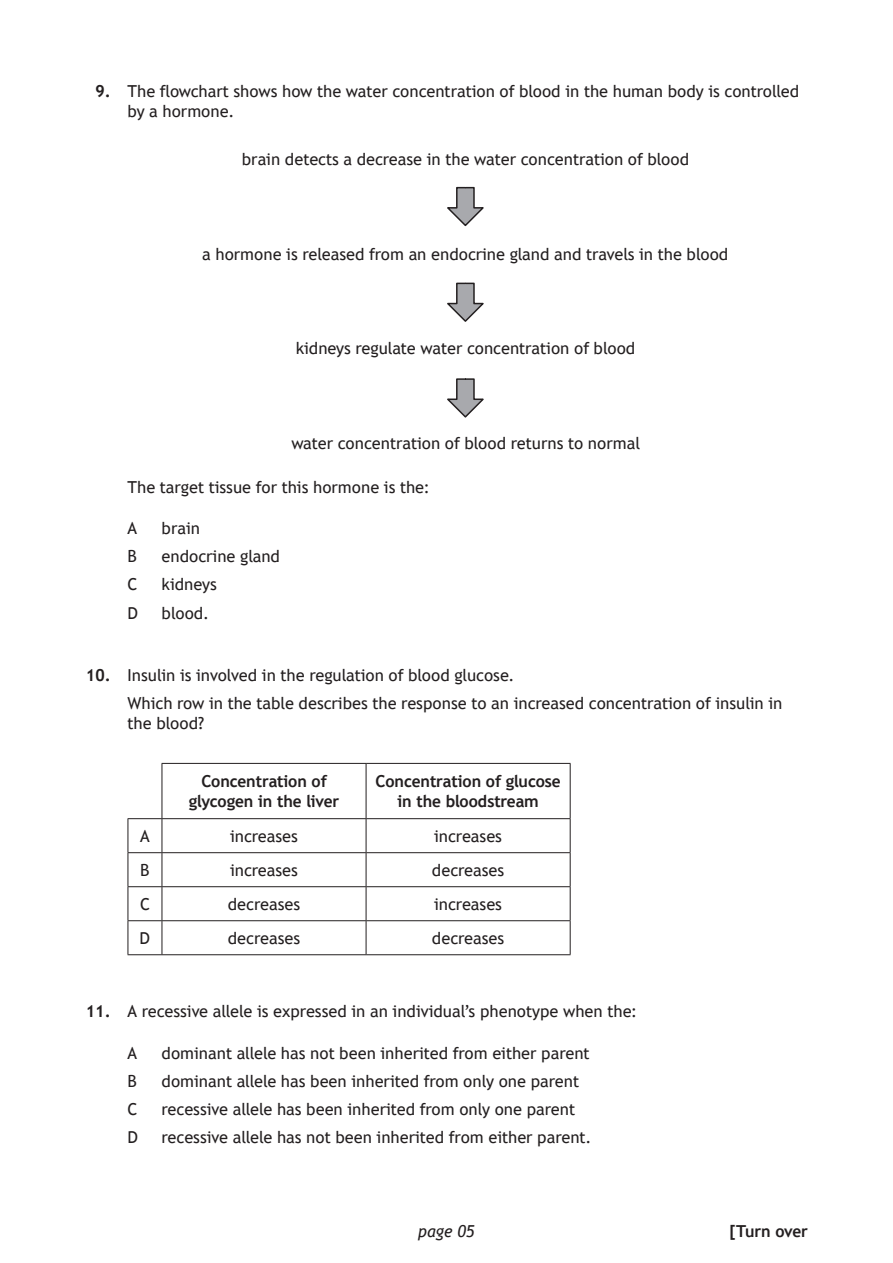
Selectable page text
9. The flowchart shows how the water concentration of blood in the human body is controlled
    by a hormone.

              brain detects a decrease in the water concentration of blood

           a hormone is released from an endocrine gland and travels in the blood

                   kidneys regulate water concentration of blood

                   water concentration of blood returns to normal

    The target tissue for this hormone is the:

    A  brain
    B  endocrine gland

    C  kidneys
    D  blood.

10. Insulin is involved in the regulation of blood glucose.

    Which row in the table describes the response to an increased concentration of insulin in
    the blood?

           Concentration of Concentration of glucose
         glycogen in the liver in the bloodstream

     A       increases          increases
     B       increases          decreases

     C       decreases          increases

     D       decreases          decreases

11. A recessive allele is expressed in an individual’s phenotype when the:

    A  dominant allele has not been inherited from either parent
    B  dominant allele has been inherited from only one parent

    C  recessive allele has been inherited from only one parent
    D  recessive allele has not been inherited from either parent.

                              page 05                      [Turn over
PDF page 6
Paper 1, Question 12Paper 1, Question 13Paper 1, Question 14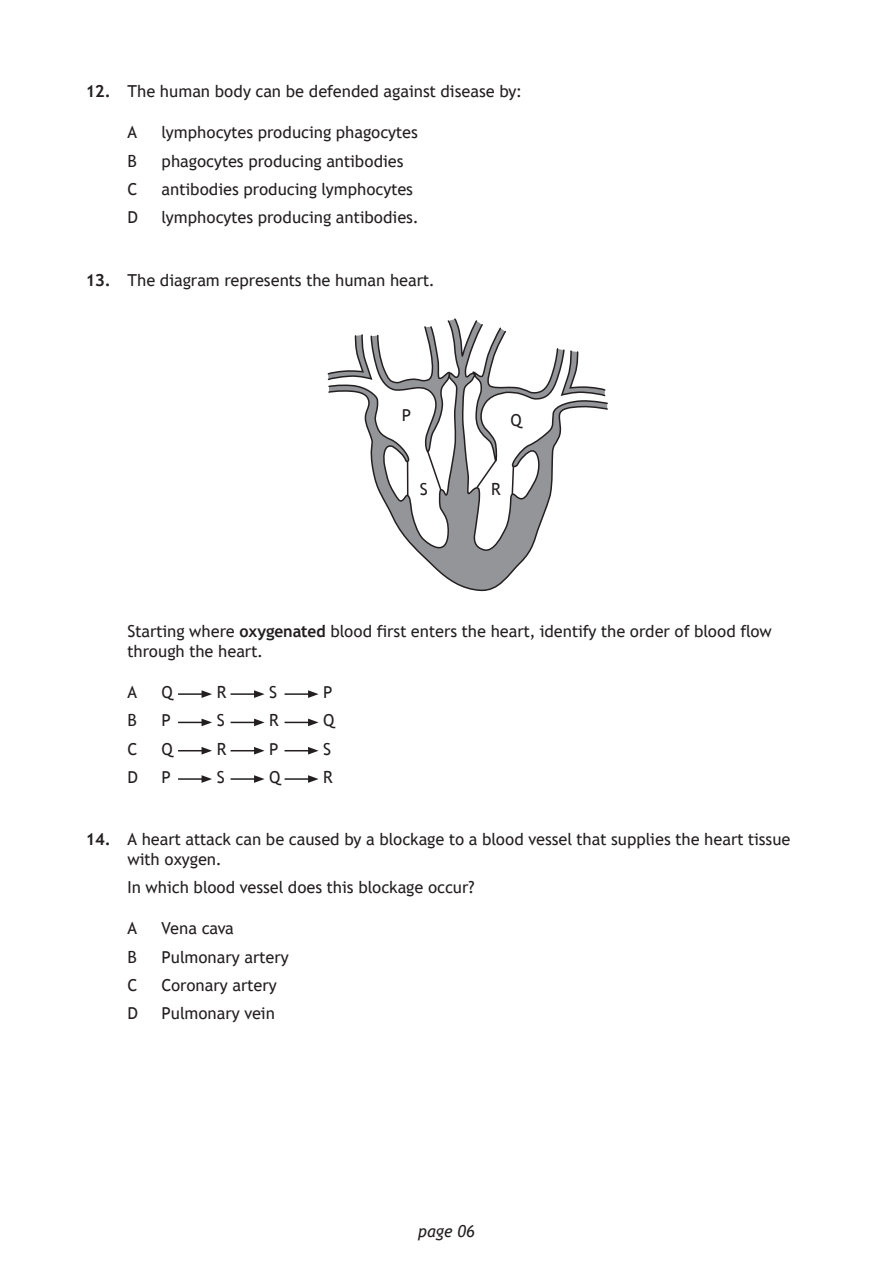
Selectable page text
12. The human body can be defended against disease by:

    A  lymphocytes producing phagocytes

    B  phagocytes producing antibodies
    C  antibodies producing lymphocytes

    D  lymphocytes producing antibodies.

13. The diagram represents the human heart.

                             P
                                       Q

                               S     R

    Starting where oxygenated blood first enters the heart, identify the order of blood flow
    through the heart.

    A  Q    R    S    P

    B  P    S    R    Q
    C  Q    R    P    S

    D  P    S    Q    R

14. A heart attack can be caused by a blockage to a blood vessel that supplies the heart tissue
    with oxygen.
    In which blood vessel does this blockage occur?

    A  Vena cava

    B  Pulmonary artery
    C  Coronary artery

    D  Pulmonary vein

                              page 06
PDF page 7
Paper 1, Question 15Paper 1, Question 16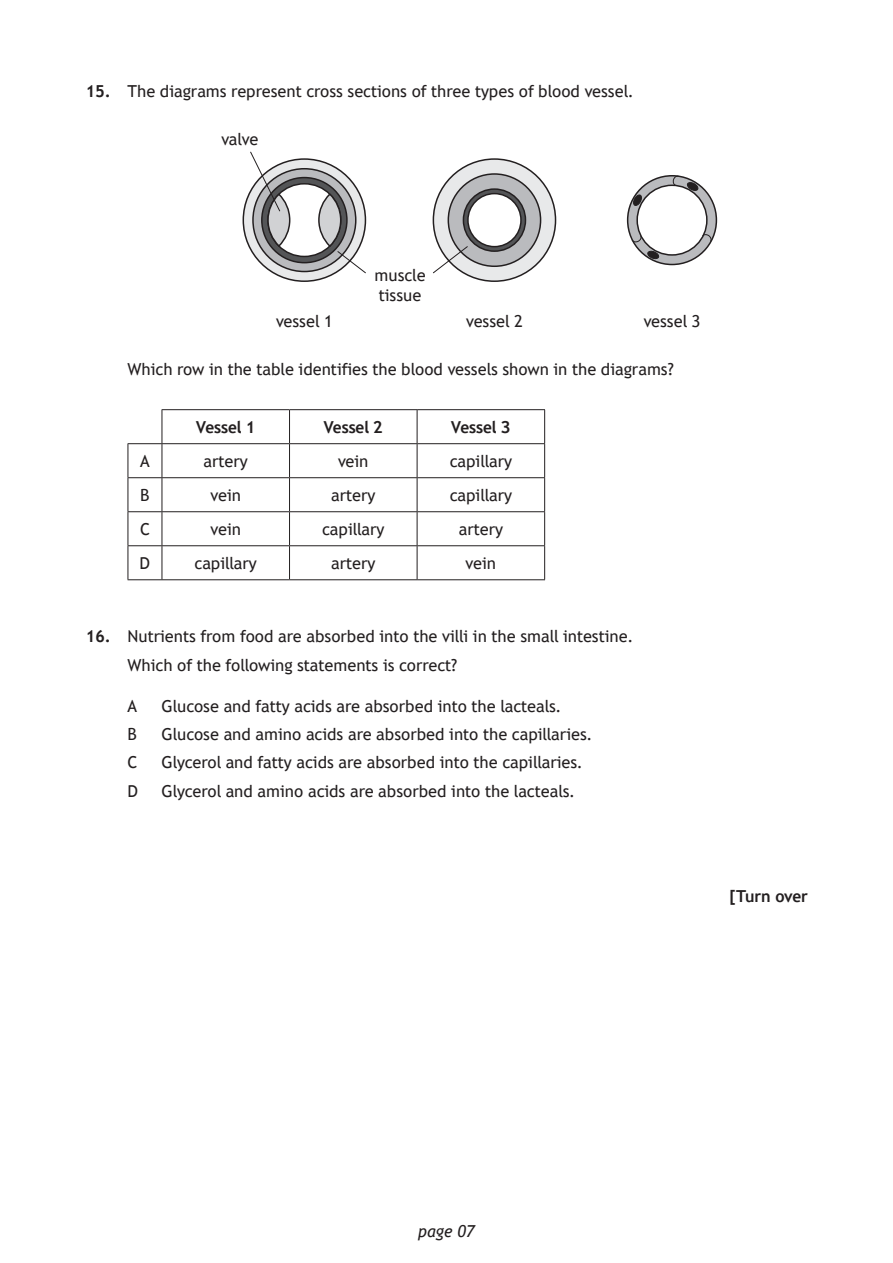
Selectable page text
15. The diagrams represent cross sections of three types of blood vessel.

            valve

                          muscle
                           tissue
                 vessel 1          vessel 2        vessel 3

    Which row in the table identifies the blood vessels shown in the diagrams?

          Vessel 1    Vessel 2   Vessel 3
     A     artery      vein      capillary

     B     vein       artery     capillary

     C     vein       capillary   artery

     D    capillary   artery       vein

16. Nutrients from food are absorbed into the villi in the small intestine.

    Which of the following statements is correct?

    A  Glucose and fatty acids are absorbed into the lacteals.
    B  Glucose and amino acids are absorbed into the capillaries.

    C  Glycerol and fatty acids are absorbed into the capillaries.
    D  Glycerol and amino acids are absorbed into the lacteals.

                                                           [Turn over

                              page 07
PDF page 8
Paper 1, Question 17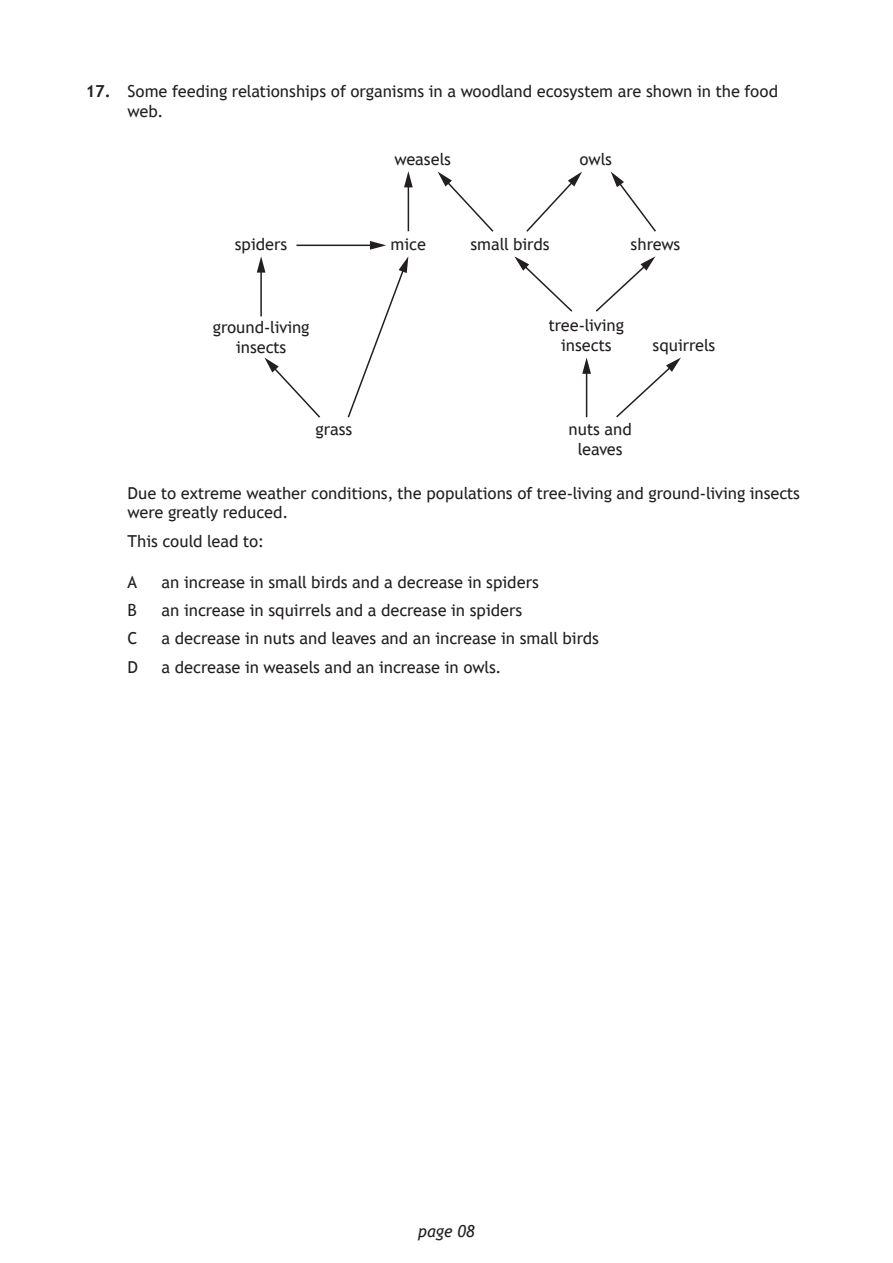
Selectable page text
17. Some feeding relationships of organisms in a woodland ecosystem are shown in the food
    web.

                            weasels          owls

              spiders       mice   small birds    shrews

            ground-living                 tree-living
              insects                       insects squirrels

                     grass                  nuts and
                                             leaves

    Due to extreme weather conditions, the populations of tree-living and ground-living insects
    were greatly reduced.
    This could lead to:

    A  an increase in small birds and a decrease in spiders

    B  an increase in squirrels and a decrease in spiders
    C  a decrease in nuts and leaves and an increase in small birds

    D  a decrease in weasels and an increase in owls.

                              page 08
PDF page 9
Paper 1, Question 18Paper 1, Question 19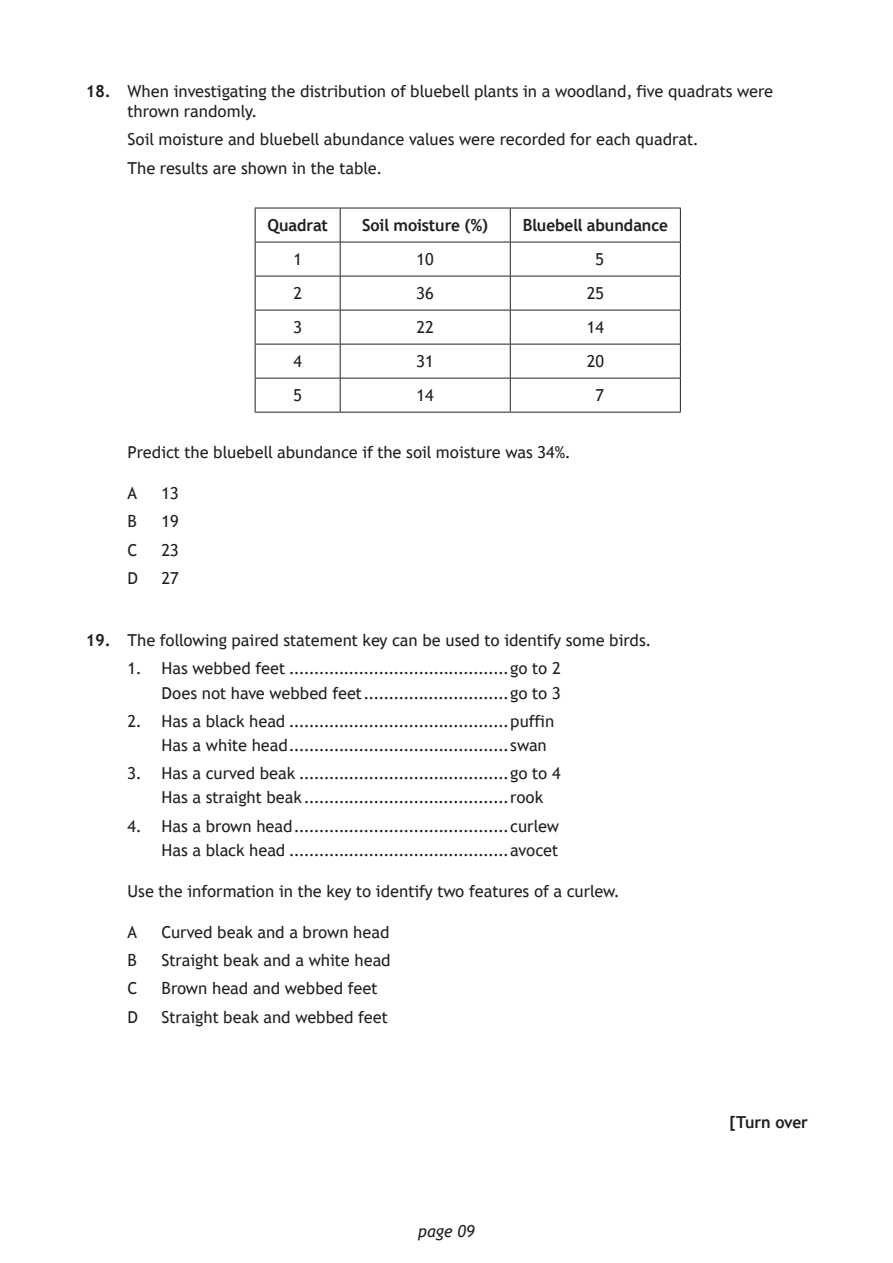
Selectable page text
18. When investigating the distribution of bluebell plants in a woodland, five quadrats were
    thrown randomly.

    Soil moisture and bluebell abundance values were recorded for each quadrat.
    The results are shown in the table.

                 Quadrat Soil moisture (%) Bluebell abundance

                   1          10               5

                   2          36              25
                   3          22              14

                   4          31              20

                   5          14               7

    Predict the bluebell abundance if the soil moisture was 34%.

    A  13
    B  19

    C  23
    D  27

19. The following paired statement key can be used to identify some birds.

    1. Has webbed feet ............................................go to 2
       Does not have webbed feet .............................go to 3

    2. Has a black head ............................................puffin
       Has a white head ............................................swan
    3. Has a curved beak ..........................................go to 4

       Has a straight beak .........................................rook
    4. Has a brown head ...........................................curlew
       Has a black head ............................................avocet

    Use the information in the key to identify two features of a curlew.

    A  Curved beak and a brown head

    B  Straight beak and a white head
    C  Brown head and webbed feet

    D  Straight beak and webbed feet

                                                           [Turn over

                              page 09
PDF page 10
Paper 1, Question 20Paper 1, Question 21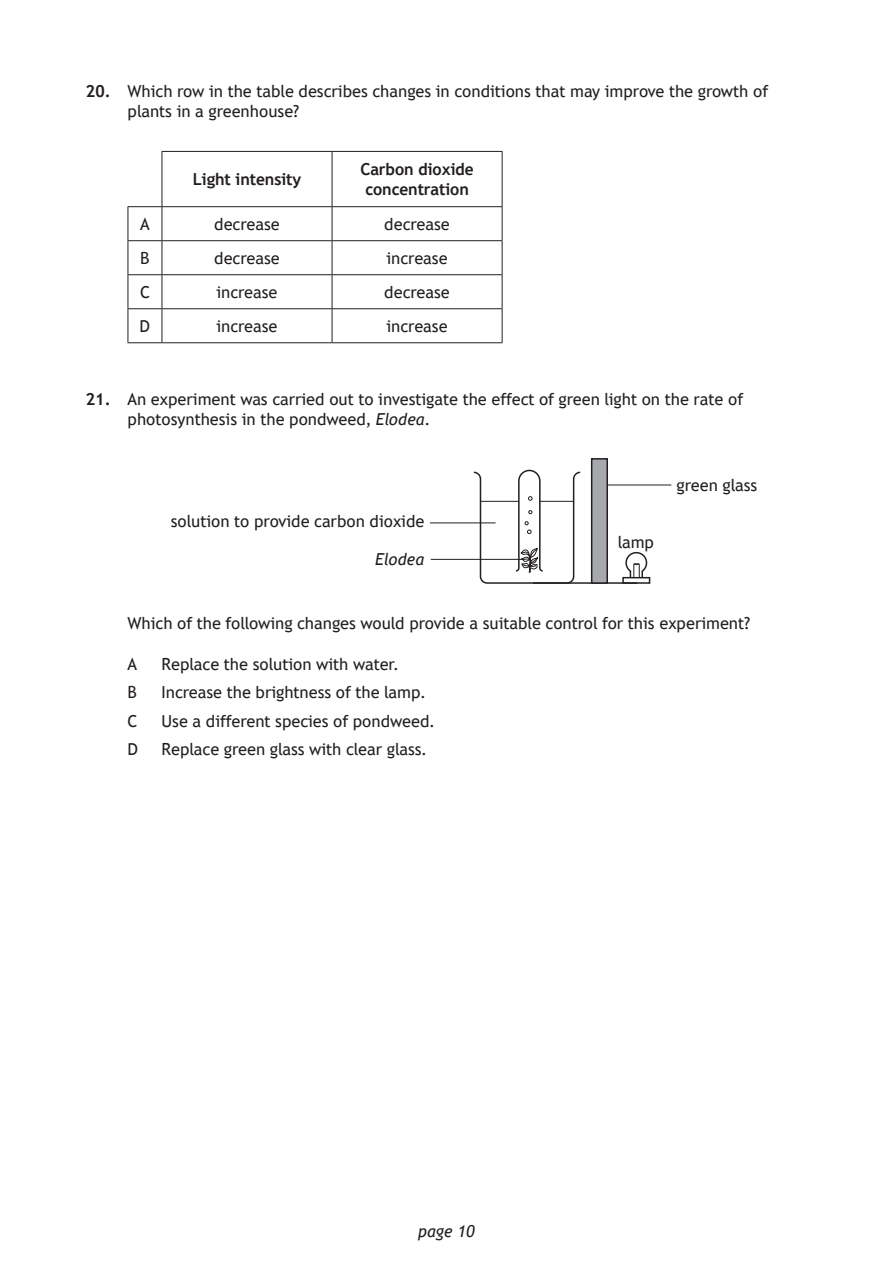
Selectable page text
20. Which row in the table describes changes in conditions that may improve the growth of
    plants in a greenhouse?

                         Carbon dioxide
          Light intensity
                          concentration
     A      decrease       decrease

     B      decrease        increase

     C      increase       decrease
     D      increase        increase

21. An experiment was carried out to investigate the effect of green light on the rate of
    photosynthesis in the pondweed, Elodea.

                                                      green glass
        solution to provide carbon dioxide
                                                 lamp
                           Elodea

    Which of the following changes would provide a suitable control for this experiment?

    A  Replace the solution with water.
    B  Increase the brightness of the lamp.

    C  Use a different species of pondweed.
    D  Replace green glass with clear glass.

                              page 10
PDF page 11
Paper 1, Question 22Paper 1, Question 23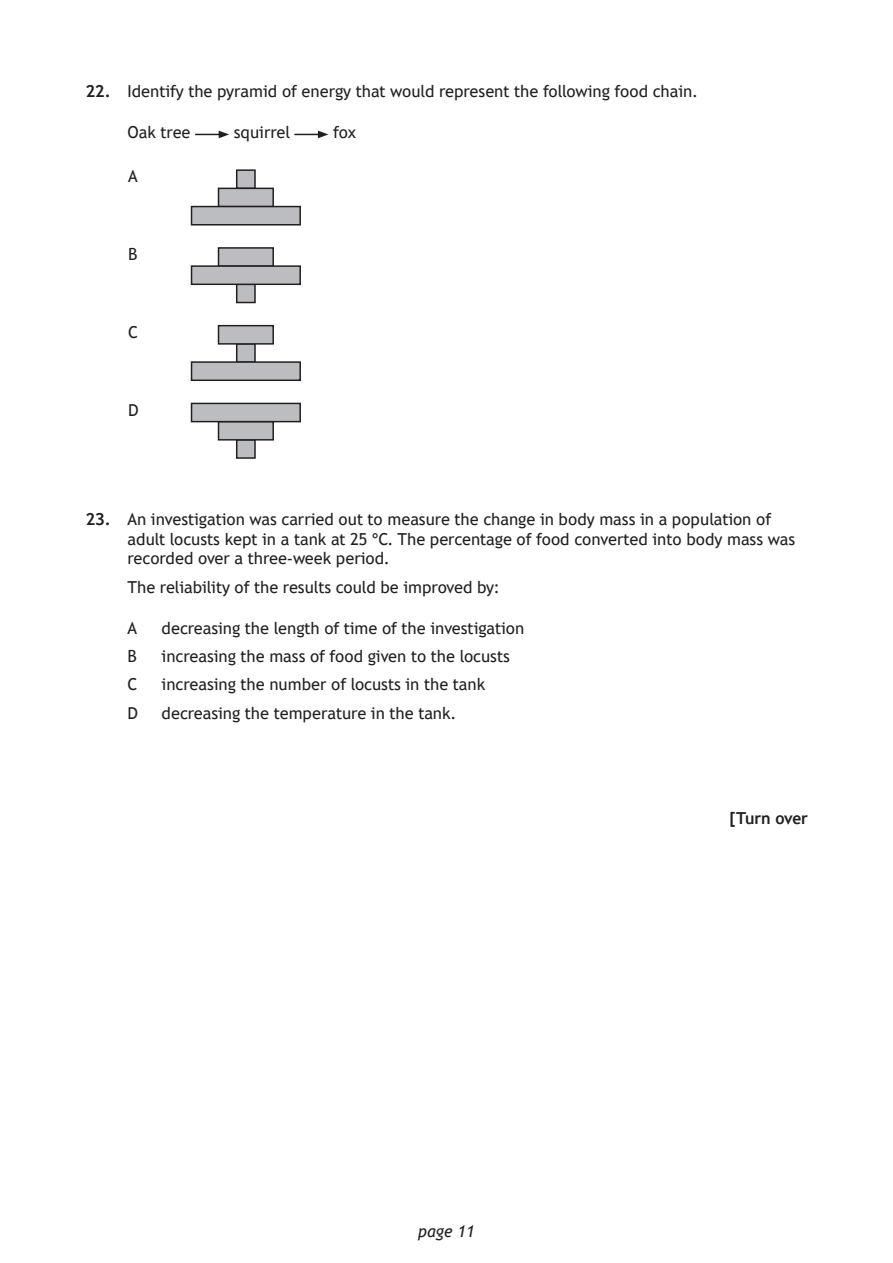
Selectable page text
22. Identify the pyramid of energy that would represent the following food chain.

    Oak tree squirrel  fox

    A

    B

    C

    D

23. An investigation was carried out to measure the change in body mass in a population of
    adult locusts kept in a tank at 25 °C. The percentage of food converted into body mass was
    recorded over a three-week period.

    The reliability of the results could be improved by:

    A  decreasing the length of time of the investigation
    B  increasing the mass of food given to the locusts

    C  increasing the number of locusts in the tank
    D  decreasing the temperature in the tank.

                                                           [Turn over

                              page 11
PDF page 12
Paper 1, Question 24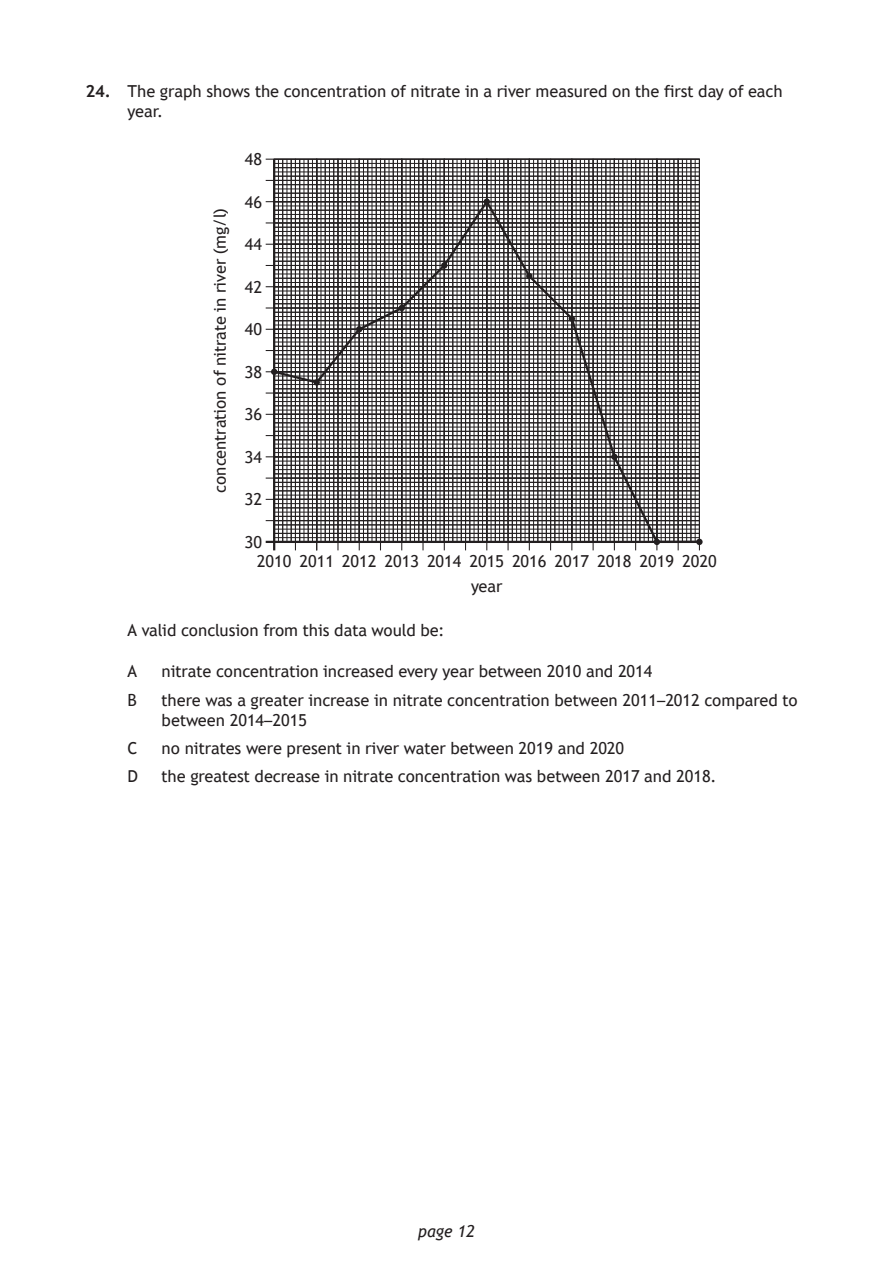
Selectable page text
24. The graph shows the concentration of nitrate in a river measured on the first day of each
    year.

               48

               46

               44

               42

               40

               38

               36

               34

               32

               30

                              page 12
            )l/gm(
            revir
            ni
            etartin
            fo
            noitartnecnoc
                2010 2011 2012 2013 2014 2015 2016 2017 2018 2019 2020
                                   year
    A valid conclusion from this data would be:
    A  nitrate concentration increased every year between 2010 and 2014
    B  there was a greater increase in nitrate concentration between 2011–2012 compared to
       between 2014–2015
    C  no nitrates were present in river water between 2019 and 2020
    D  the greatest decrease in nitrate concentration was between 2017 and 2018.
PDF page 13
Paper 1, Question 25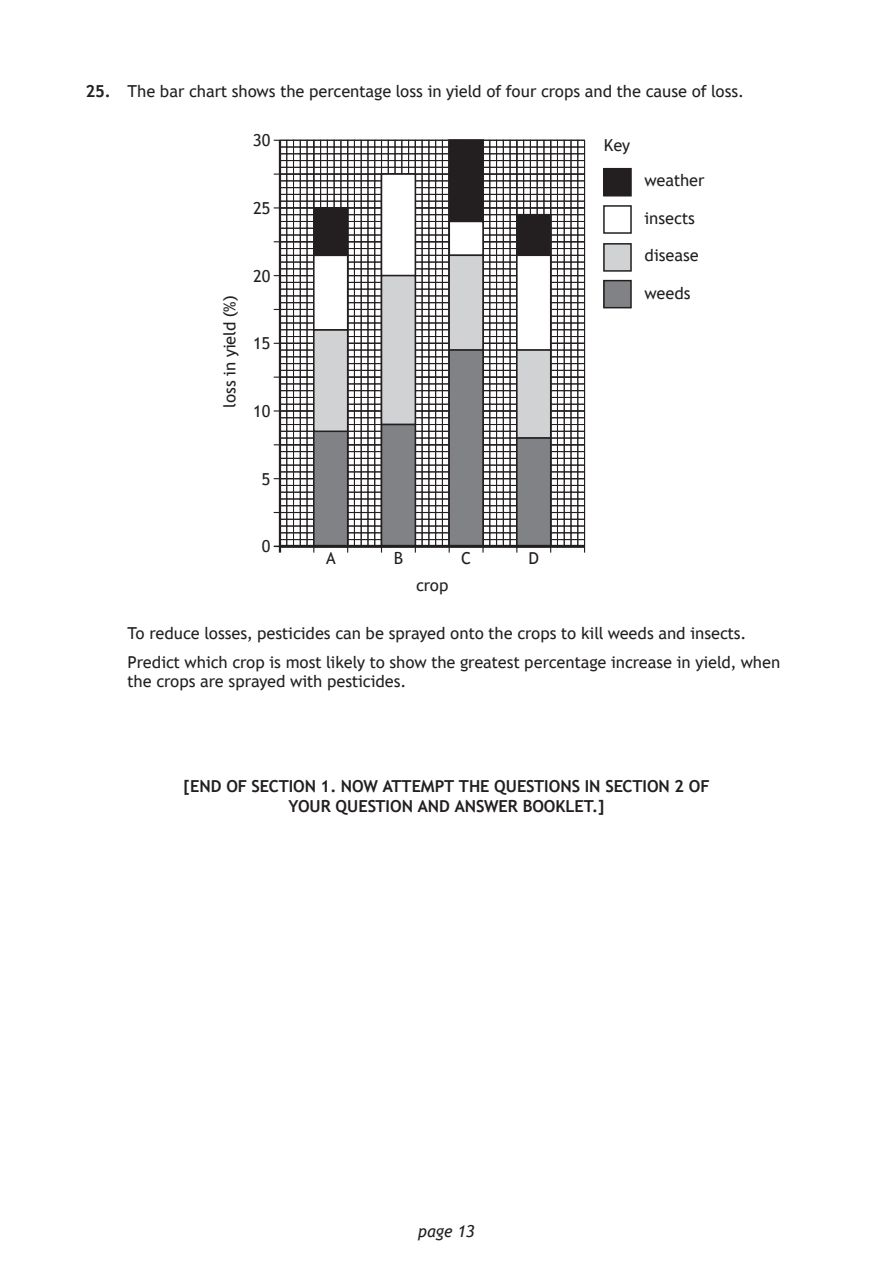
Selectable page text
25. The bar chart shows the percentage loss in yield of four crops and the cause of loss.

               30                               Key

                                                   weather
               25
                                                   insects

                                                   disease
               20
                                                   weeds

               15

               10

                5

                0
                      A     B     C      D
                              crop

                              page 13
             )%(
             dleiy
             ni
             ssol
    To reduce losses, pesticides can be sprayed onto the crops to kill weeds and insects.
    Predict which crop is most likely to show the greatest percentage increase in yield, when
    the crops are sprayed with pesticides.
         [END OF SECTION 1. NOW ATTEMPT THE QUESTIONS IN SECTION 2 OF
                   YOUR QUESTION AND ANSWER BOOKLET.]
PDF page 14

Selectable page text
[BLANK PAGE]

DO NOT WRITE ON THIS PAGE

       page 14
PDF page 15

Selectable page text
[BLANK PAGE]

DO NOT WRITE ON THIS PAGE

       page 15
PDF page 16

Selectable page text
[BLANK PAGE]

DO NOT WRITE ON THIS PAGE

       page 16