2025 Higher Human Biology - Paper 2 questions
Source: Scottish Qualifications Authority (SQA) / Qualifications Scotland. This is a StemInteract HTML companion, not an official HTML edition. Extracted text is supplied alongside unaltered page images; use the images or original PDF for table layout, diagrams and symbols.
Jump to a question
PDF page 1
Selectable page text
FOR OFFICIAL USE
H
National
Qualications
Mark
2025
X840/76/01 Human Biology
Paper 2
TUESDAY, 27 MAY
10:10 AM – 12:30 PM
*X8407601*
Fill in these boxes and read what is printed below.
Full name of centre Town
Forename(s) Surname Number of seat
Date of birth
Day Month Year Scottish candidate number
Total marks — 95
Attempt ALL questions.
You may use a calculator.
Question 15 contains a choice.
Write your answers clearly in the spaces provided in this booklet. Additional space for answers
and rough work is provided at the end of this booklet. If you use this space you must clearly
identify the question number you are attempting. Any rough work must be written in this
booklet. Score through your rough work when you have written your final copy.
Use blue or black ink.
Before leaving the examination room you must give this booklet to the Invigilator; if you do not,
you may lose all the marks for this paper.
©
*X840760101*
A/PBPDF page 2
Question 1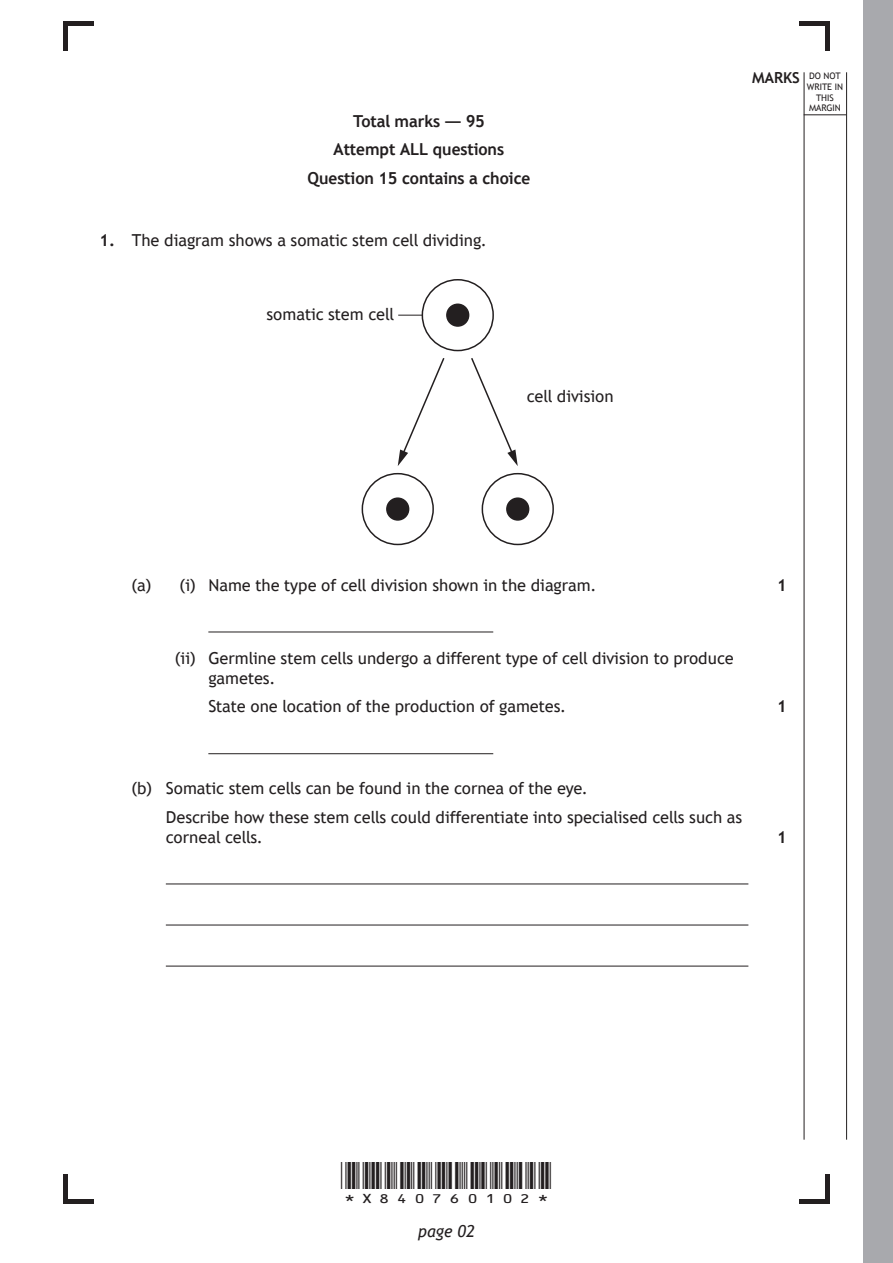
Selectable page text
MARKS DO NOT
                                                                 WRITE IN
                                                                  THIS
                                                                 MARGIN
                       Total marks — 95
                      Attempt ALL questions
                   Question 15 contains a choice

1. The diagram shows a somatic stem cell dividing.

                somatic stem cell

                                       cell division

   (a)  (i) Name the type of cell division shown in the diagram. 1

       (ii) Germline stem cells undergo a different type of cell division to produce
          gametes.

          State one location of the production of gametes.    1

   (b) Somatic stem cells can be found in the cornea of the eye.

      Describe how these stem cells could differentiate into specialised cells such as
      corneal cells.                                          1

                      *X840760102*

                             page 02
PDF page 3
Selectable page text
MARKS DO NOT
                                                                 WRITE IN
                                                                  THIS
                                                                 MARGIN
1. (continued)
   (c) Some conditions can cause severe damage to the cornea and somatic stem
      cells found in the eye. Stem cell transplants can be carried out to replace the
      damaged somatic stem cells with healthy stem cells.
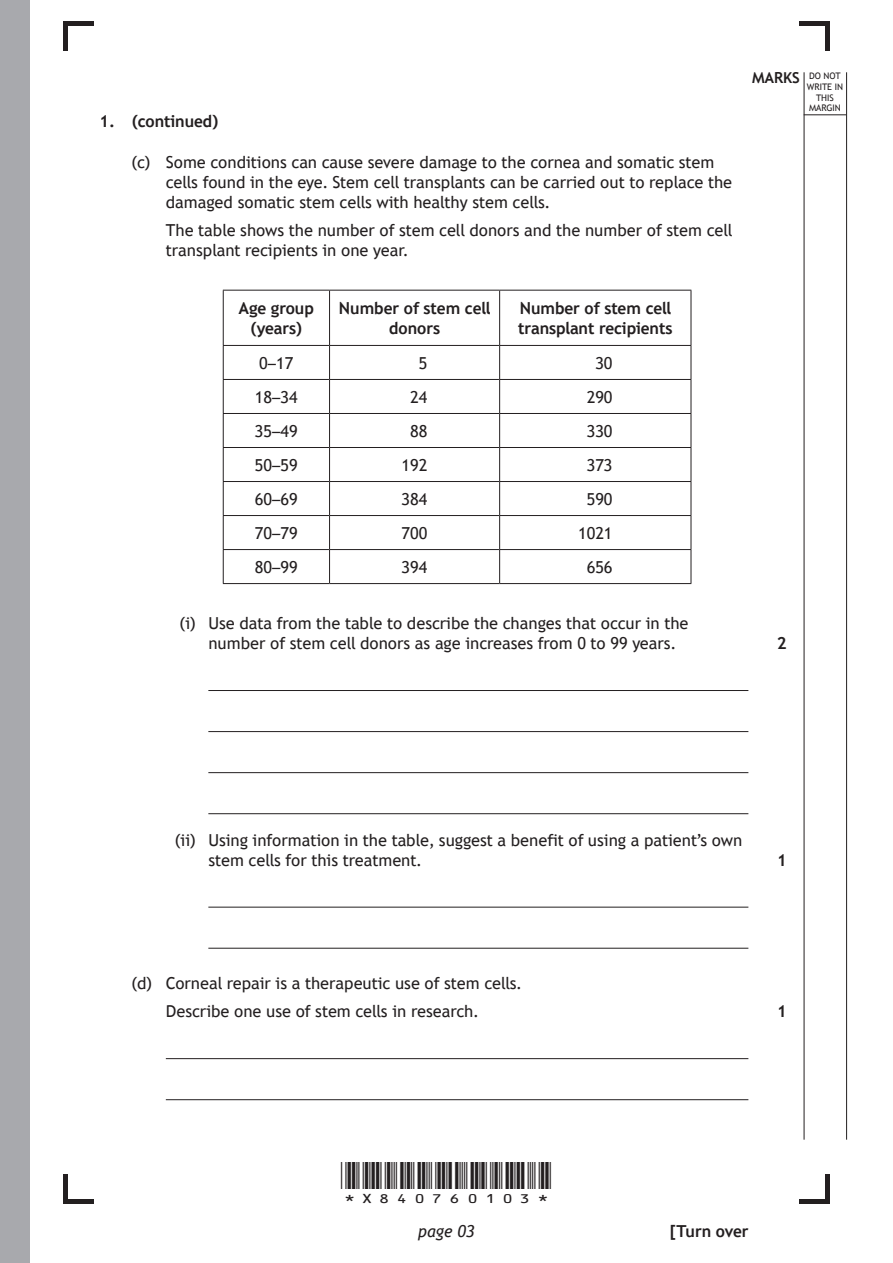
      The table shows the number of stem cell donors and the number of stem cell
      transplant recipients in one year.

             Age group Number of stem cell Number of stem cell
              (years)      donors      transplant recipients

               0–17           5               30

              18–34          24              290

              35–49          88              330
              50–59         192              373

              60–69         384              590

              70–79         700             1021

              80–99         394              656

        (i) Use data from the table to describe the changes that occur in the
          number of stem cell donors as age increases from 0 to 99 years. 2

       (ii) Using information in the table, suggest a benefit of using a patient’s own
          stem cells for this treatment.                      1

   (d) Corneal repair is a therapeutic use of stem cells.

      Describe one use of stem cells in research.             1

                      *X840760103*

                             page 03                 [Turn over
PDF page 4
Question 2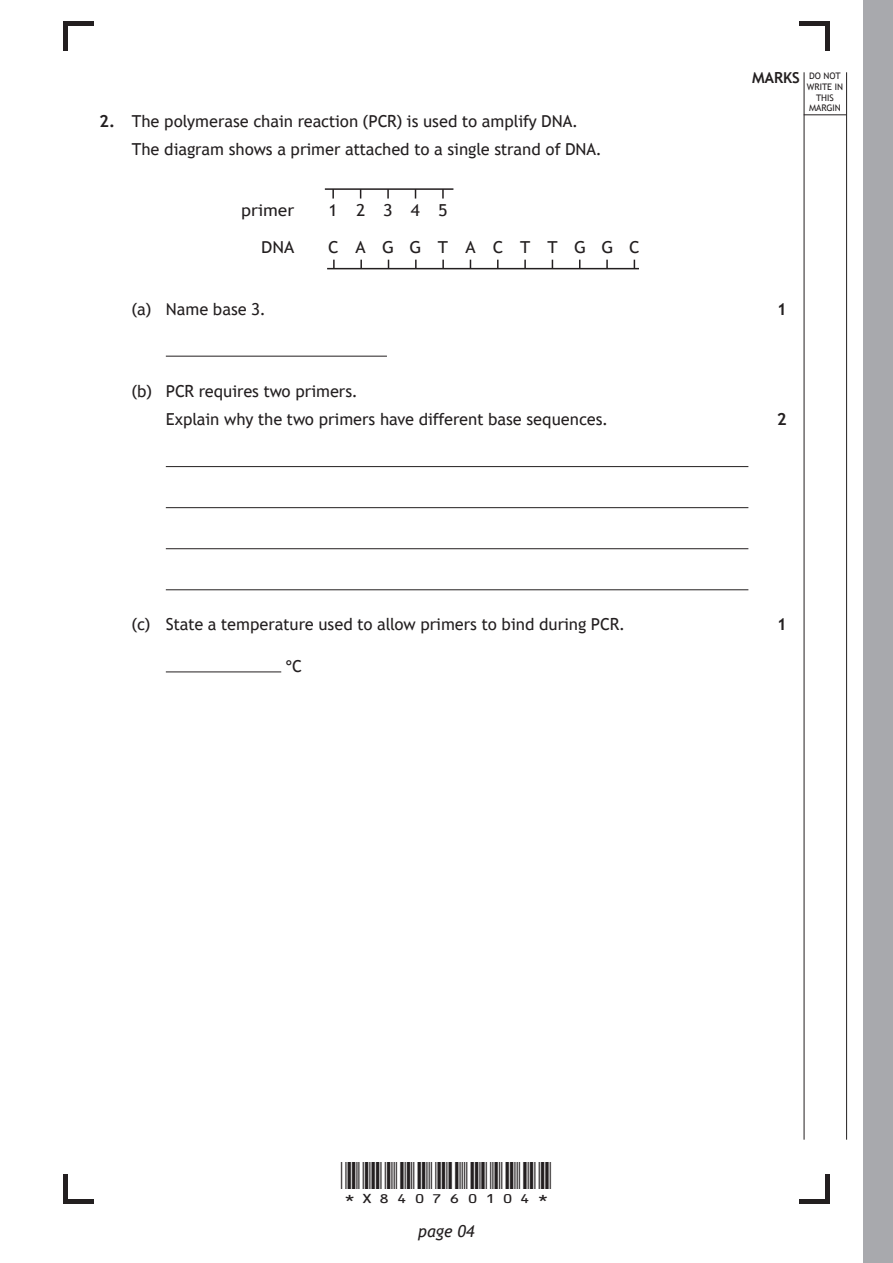
Selectable page text
MARKS DO NOT
                                                                 WRITE IN
                                                                  THIS
                                                                 MARGIN
2. The polymerase chain reaction (PCR) is used to amplify DNA.
   The diagram shows a primer attached to a single strand of DNA.
             primer  1  2 3  4 5

               DNA   C  A G  G T  A C  T T  G G  C

   (a) Name base 3.                                           1

   (b) PCR requires two primers.
      Explain why the two primers have different base sequences. 2

   (c) State a temperature used to allow primers to bind during PCR. 1

      ������������������������� °C

                      *X840760104*

                             page 04
PDF page 5
Question 3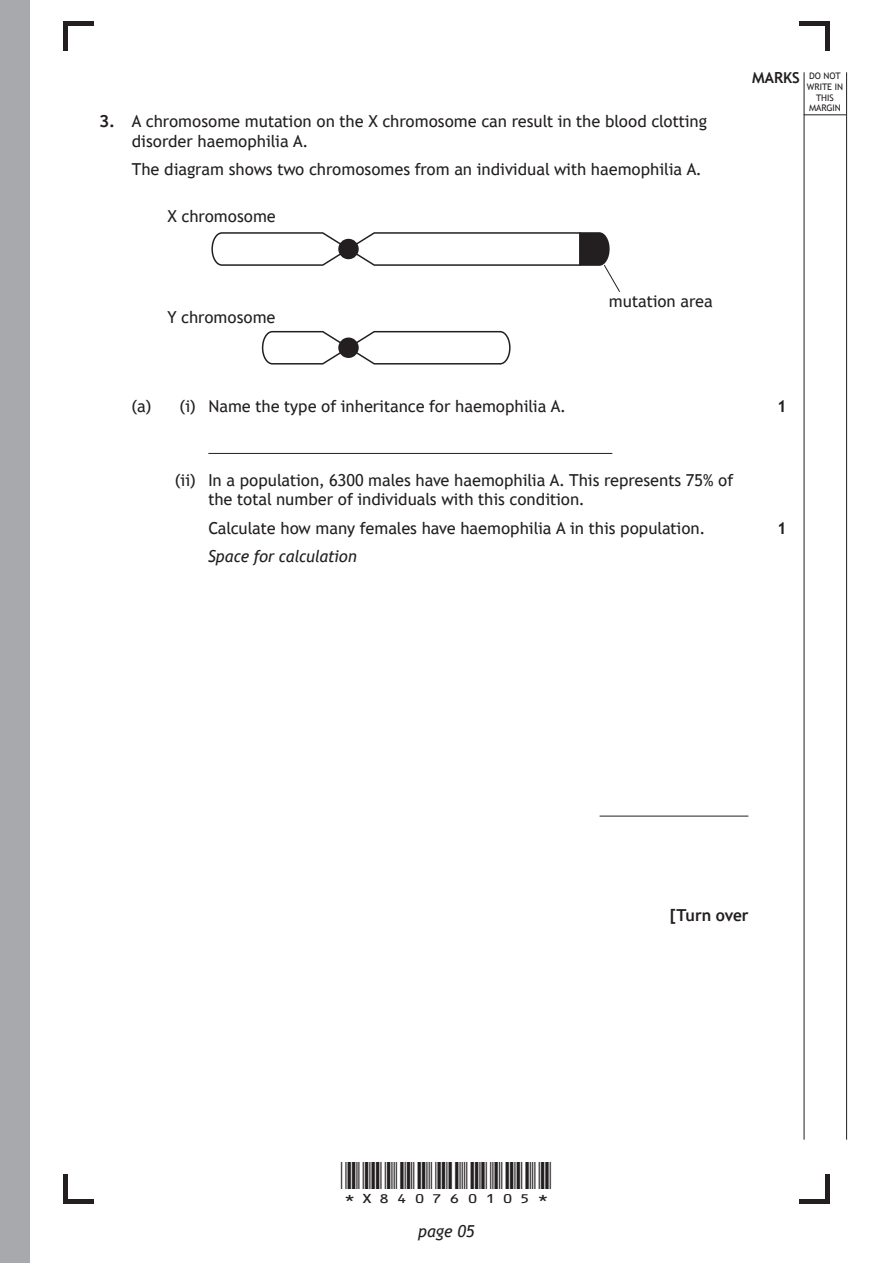
Selectable page text
MARKS DO NOT
                                                                 WRITE IN
                                                                  THIS
                                                                 MARGIN
3. A chromosome mutation on the X chromosome can result in the blood clotting
   disorder haemophilia A.
   The diagram shows two chromosomes from an individual with haemophilia A.
      X chromosome

                                               mutation area
      Y chromosome

   (a)  (i) Name the type of inheritance for haemophilia A.   1

       (ii) In a population, 6300 males have haemophilia A. This represents 75% of
          the total number of individuals with this condition.

          Calculate how many females have haemophilia A in this population. 1
          Space for calculation

                                                     [Turn over

                      *X840760105*

                             page 05
PDF page 6
Selectable page text
MARKS DO NOT
                                                                 WRITE IN
                                                                  THIS
                                                                 MARGIN
3. (continued)
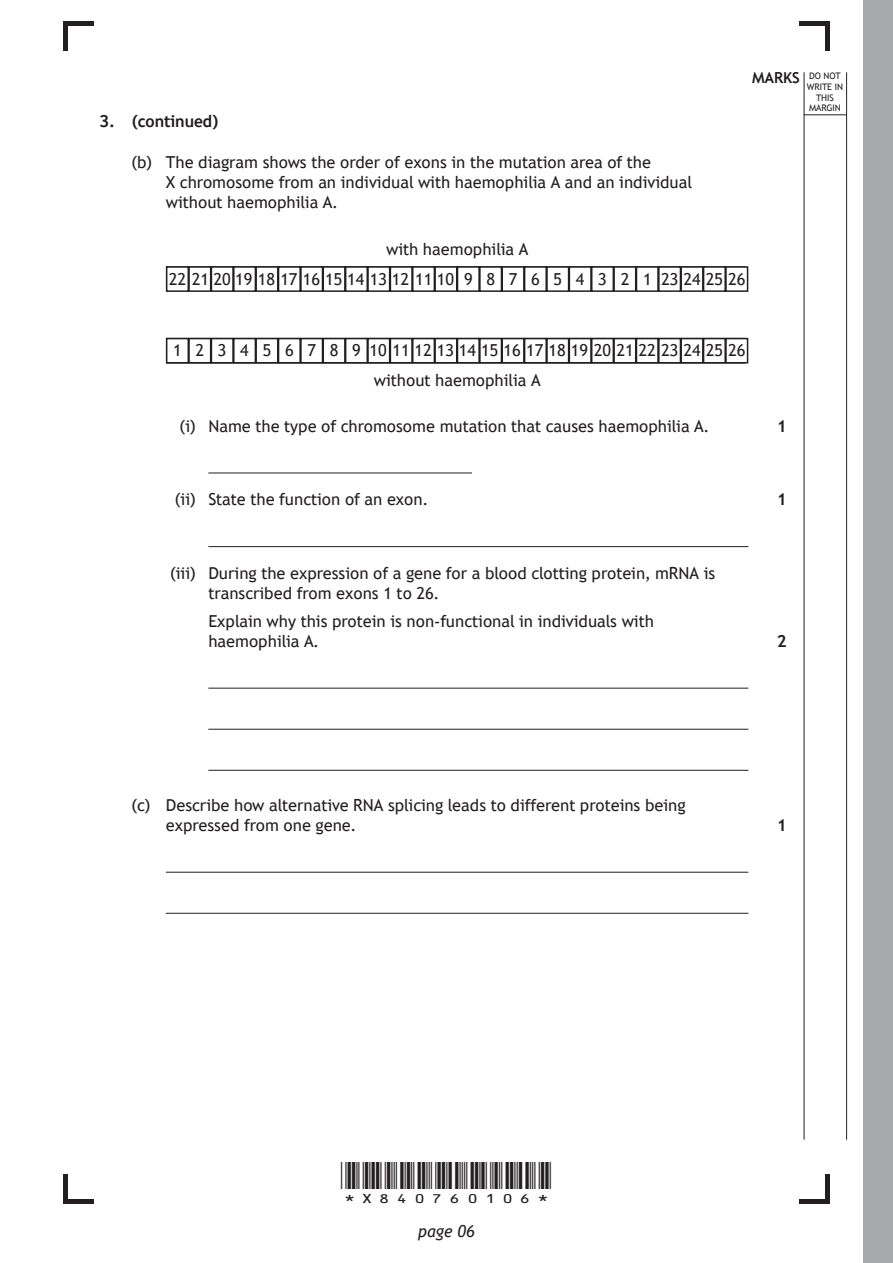
   (b) The diagram shows the order of exons in the mutation area of the
      X chromosome from an individual with haemophilia A and an individual
      without haemophilia A.
                           with haemophilia A

       22 212019 18 17 16 15 14 13 12 1110 9 8 7 6 5 4 3 2 1 23 24 25 26

       1 2 3 4 5 6 7 8 9 10 11 12 13 14 15 16 17 18 19 20 21 22 23 24 25 26
                         without haemophilia A

        (i) Name the type of chromosome mutation that causes haemophilia A. 1

       (ii) State the function of an exon.                    1

       (iii) During the expression of a gene for a blood clotting protein, mRNA is
          transcribed from exons 1 to 26.

          Explain why this protein is non‑functional in individuals with
          haemophilia A.                                      2

   (c) Describe how alternative RNA splicing leads to different proteins being
      expressed from one gene.                                1

                      *X840760106*

                             page 06
PDF page 7
Question 4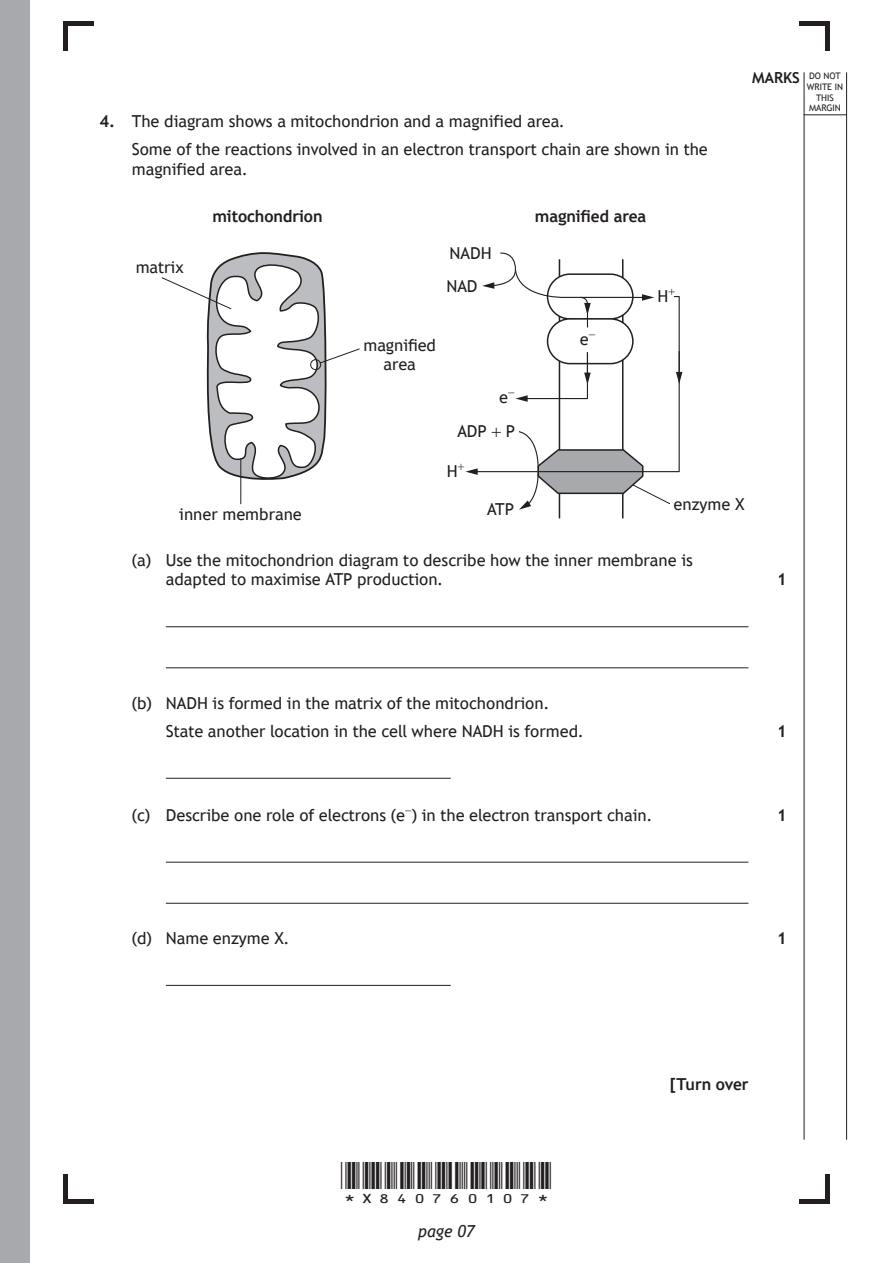
Selectable page text
MARKS DO NOT
                                                                 WRITE IN
                                                                  THIS
                                                                 MARGIN
4. The diagram shows a mitochondrion and a magnified area.
   Some of the reactions involved in an electron transport chain are shown in the
   magnified area.
           mitochondrion                magnified area

                                NADH
   matrix
                                NAD
                                                   H+
                                            e−
                        magnified
                          area
                                     e−

                                 ADP + P

                                H+
                                                     enzyme X
                                    ATP
       inner membrane
   (a) Use the mitochondrion diagram to describe how the inner membrane is
      adapted to maximise ATP production.                     1

   (b) NADH is formed in the matrix of the mitochondrion.
      State another location in the cell where NADH is formed. 1

   (c) Describe one role of electrons (e−) in the electron transport chain. 1

   (d) Name enzyme X.                                         1

                                                     [Turn over

                      *X840760107*

                             page 07
PDF page 8
Question 5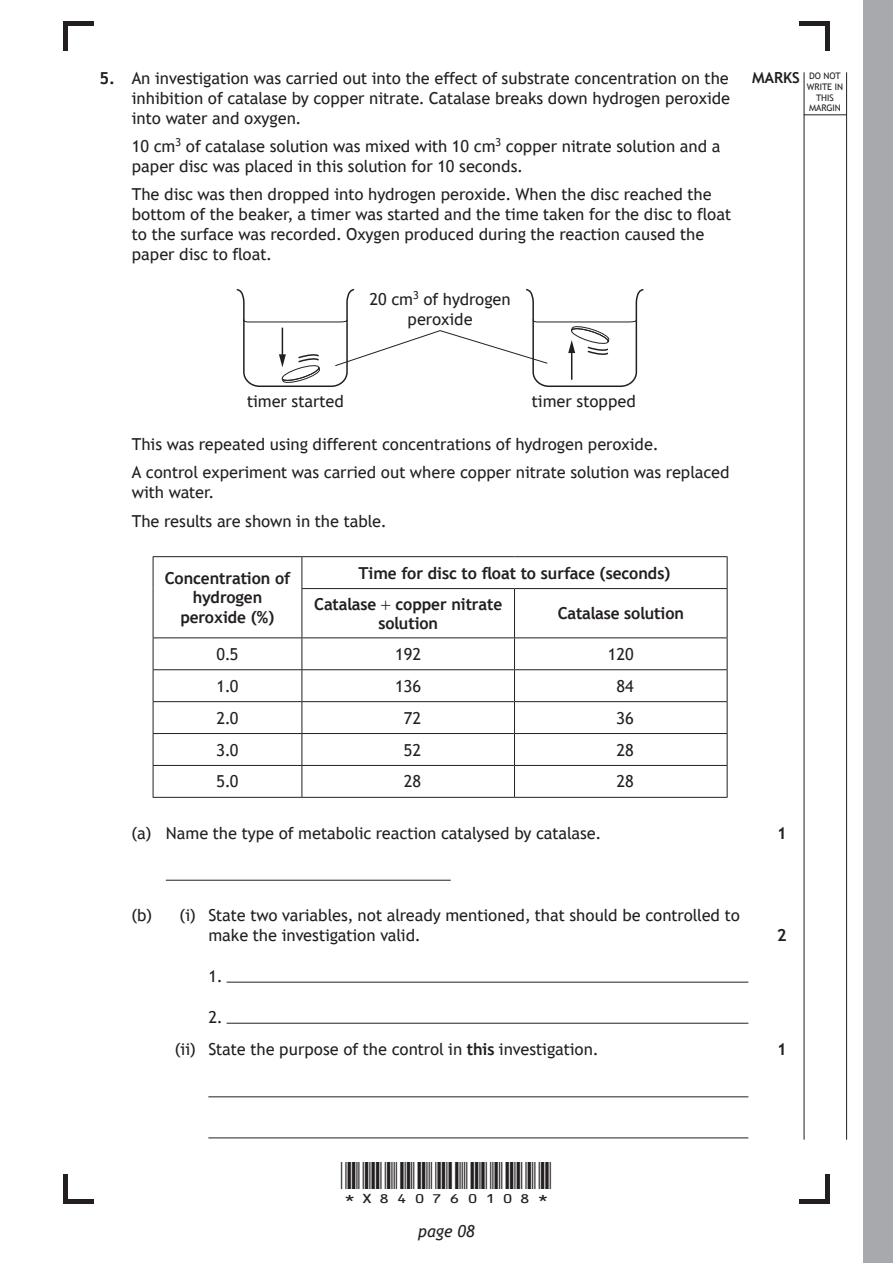
Selectable page text
5. An investigation was carried out into the effect of substrate concentration on the MARKS DO NOT
                                                                 WRITE IN
   inhibition of catalase by copper nitrate. Catalase breaks down hydrogen peroxide THIS
                                                                 MARGIN
   into water and oxygen.
   10 cm3 of catalase solution was mixed with 10 cm3 copper nitrate solution and a
   paper disc was placed in this solution for 10 seconds.
   The disc was then dropped into hydrogen peroxide. When the disc reached the
   bottom of the beaker, a timer was started and the time taken for the disc to float
   to the surface was recorded. Oxygen produced during the reaction caused the
   paper disc to float.
                         20 cm3 of hydrogen
                            peroxide

              timer started             timer stopped

   This was repeated using different concentrations of hydrogen peroxide.

   A control experiment was carried out where copper nitrate solution was replaced
   with water.
   The results are shown in the table.

                        Time for disc to float to surface (seconds)
      Concentration of
         hydrogen
                    Catalase + copper nitrate
        peroxide (%)                      Catalase solution
                          solution
           0.5             192                 120
           1.0             136                  84
           2.0              72                  36
           3.0              52                  28

           5.0              28                  28

   (a) Name the type of metabolic reaction catalysed by catalase. 1

   (b)  (i) State two variables, not already mentioned, that should be controlled to
          make the investigation valid.                       2

          1.

          2.
       (ii) State the purpose of the control in this investigation. 1

                      *X840760108*

                             page 08
PDF page 9
Selectable page text
5. (continued)                                              MARKS DO NOT
                                                                 WRITE IN
                                                                  THIS
                                                                 MARGIN
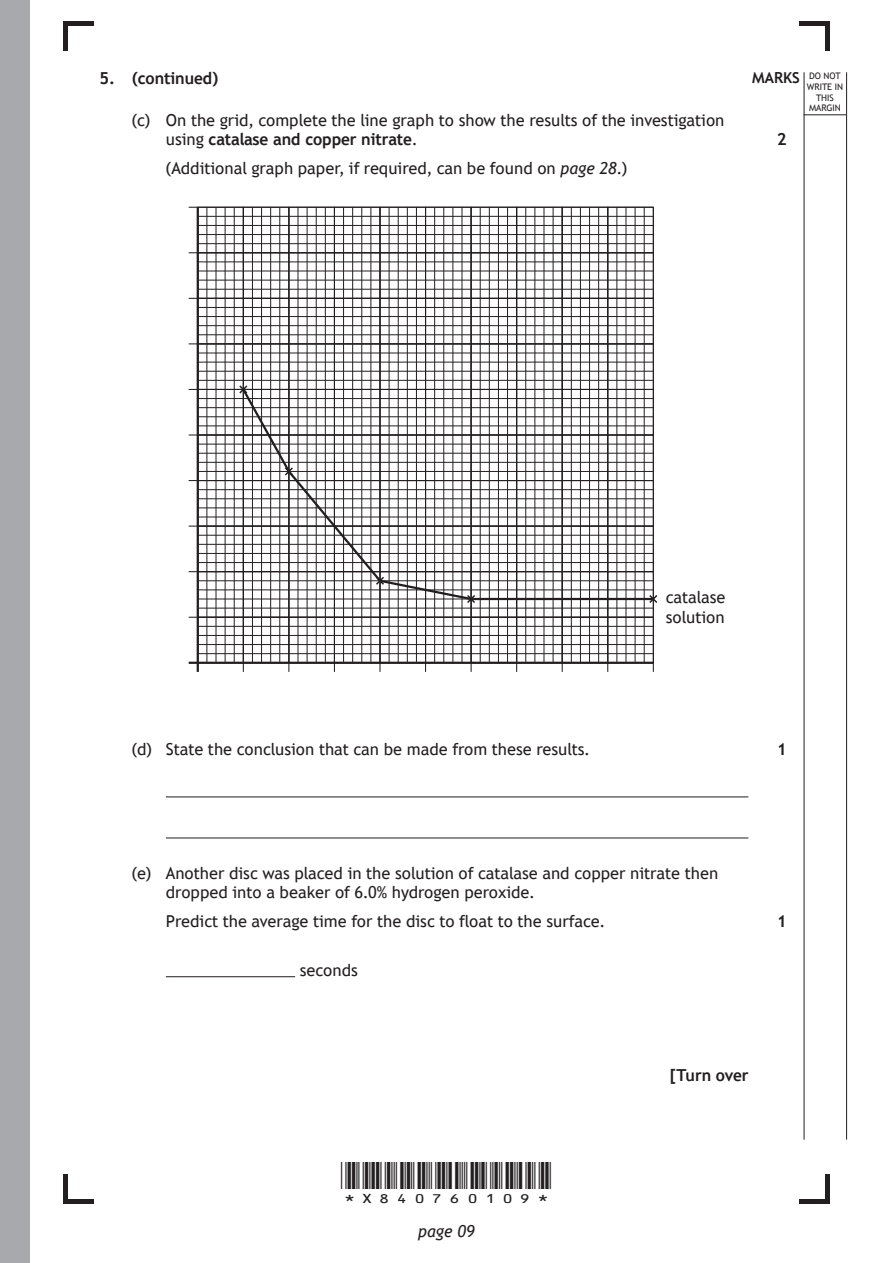
   (c) On the grid, complete the line graph to show the results of the investigation
      using catalase and copper nitrate.                      2
      (Additional graph paper, if required, can be found on page 28.)

                                                    catalase
                                                    solution

   (d) State the conclusion that can be made from these results. 1

   (e) Another disc was placed in the solution of catalase and copper nitrate then
      dropped into a beaker of 6.0% hydrogen peroxide.

      Predict the average time for the disc to float to the surface. 1

      ���������������������������� seconds

                                                     [Turn over

                      *X840760109*

                             page 09
PDF page 10
Question 6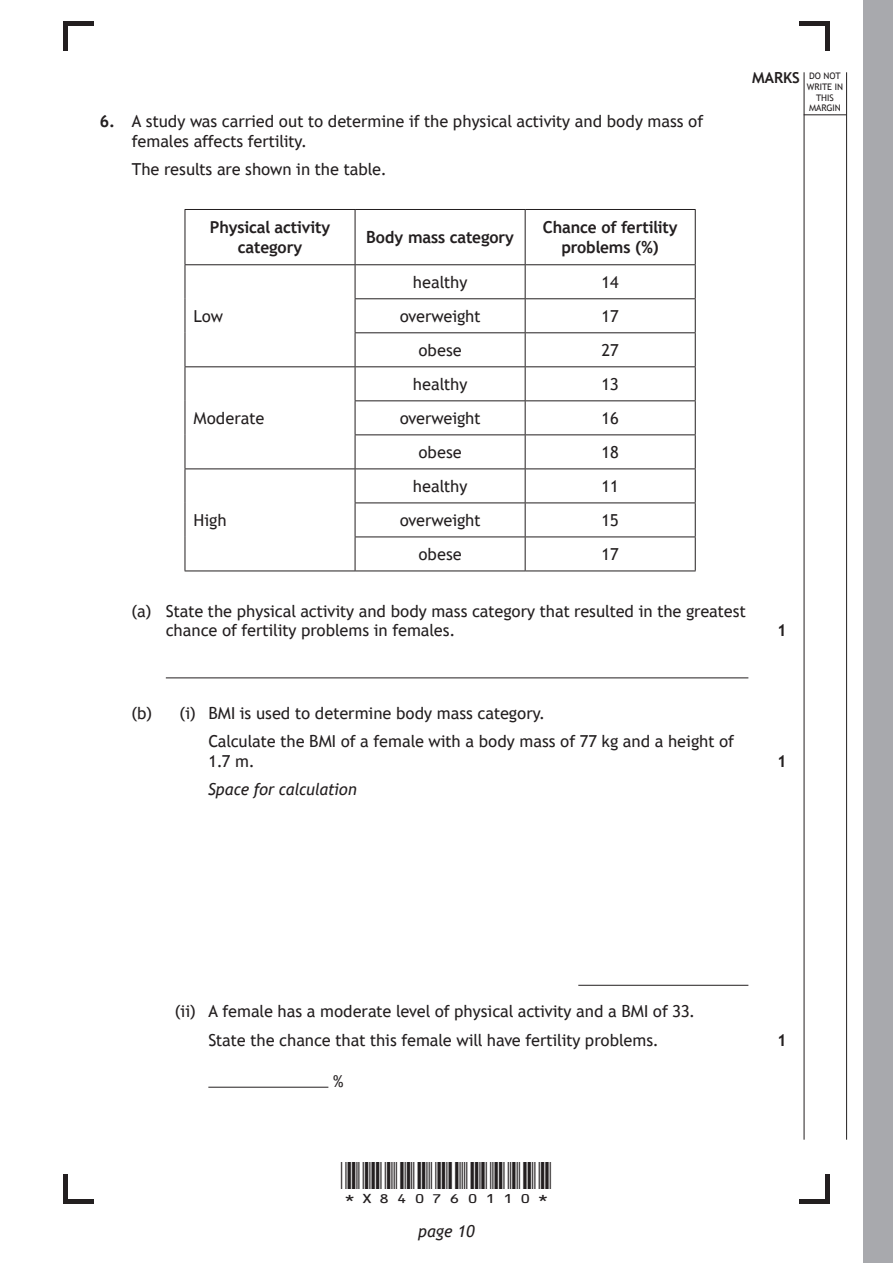
Selectable page text
MARKS DO NOT
                                                                 WRITE IN
                                                                  THIS
                                                                 MARGIN
6. A study was carried out to determine if the physical activity and body mass of
   females affects fertility.
   The results are shown in the table.
          Physical activity              Chance of fertility
                         Body mass category
             category                      problems (%)
                             healthy          14

         Low                overweight        17

                             obese            27
                             healthy          13

         Moderate           overweight        16

                             obese            18

                             healthy          11
         High               overweight        15

                             obese            17

   (a) State the physical activity and body mass category that resulted in the greatest
      chance of fertility problems in females.                1

   (b)  (i) BMI is used to determine body mass category.

          Calculate the BMI of a female with a body mass of 77 kg and a height of
          1.7 m.                                              1
          Space for calculation

       (ii) A female has a moderate level of physical activity and a BMI of 33.
          State the chance that this female will have fertility problems. 1

          �������������������������� %

                      *X840760110*

                             page 10
PDF page 11
Selectable page text
MARKS DO NOT
                                                                 WRITE IN
                                                                  THIS
                                                                 MARGIN
6. (b) (continued)
       (iii) The female and her partner are undergoing treatment for infertility
          because the partner has a low sperm count.
          Name and describe a suitable treatment for this couple. 2

          Treatment

          Description

                                                     [Turn over

                      *X840760111*

                             page 11
PDF page 12
Question 7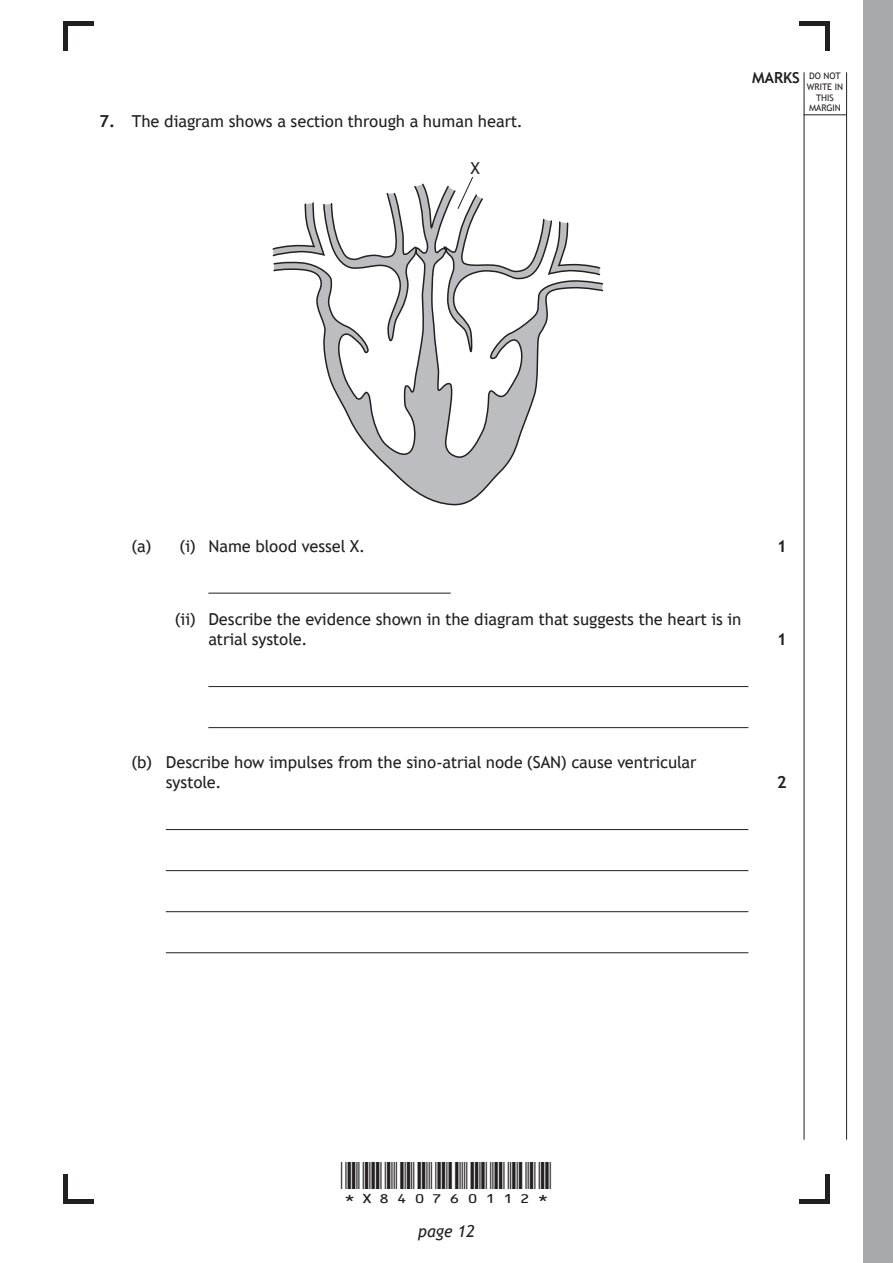
Selectable page text
MARKS DO NOT
                                                                 WRITE IN
                                                                  THIS
                                                                 MARGIN
7. The diagram shows a section through a human heart.
                                  X

   (a)  (i) Name blood vessel X.                              1

       (ii) Describe the evidence shown in the diagram that suggests the heart is in
          atrial systole.                                     1

   (b) Describe how impulses from the sino‑atrial node (SAN) cause ventricular
      systole.                                                2

                      *X840760112*

                             page 12
PDF page 13
Selectable page text
MARKS DO NOT
                                                                 WRITE IN
                                                                  THIS
                                                                 MARGIN
7. (continued)
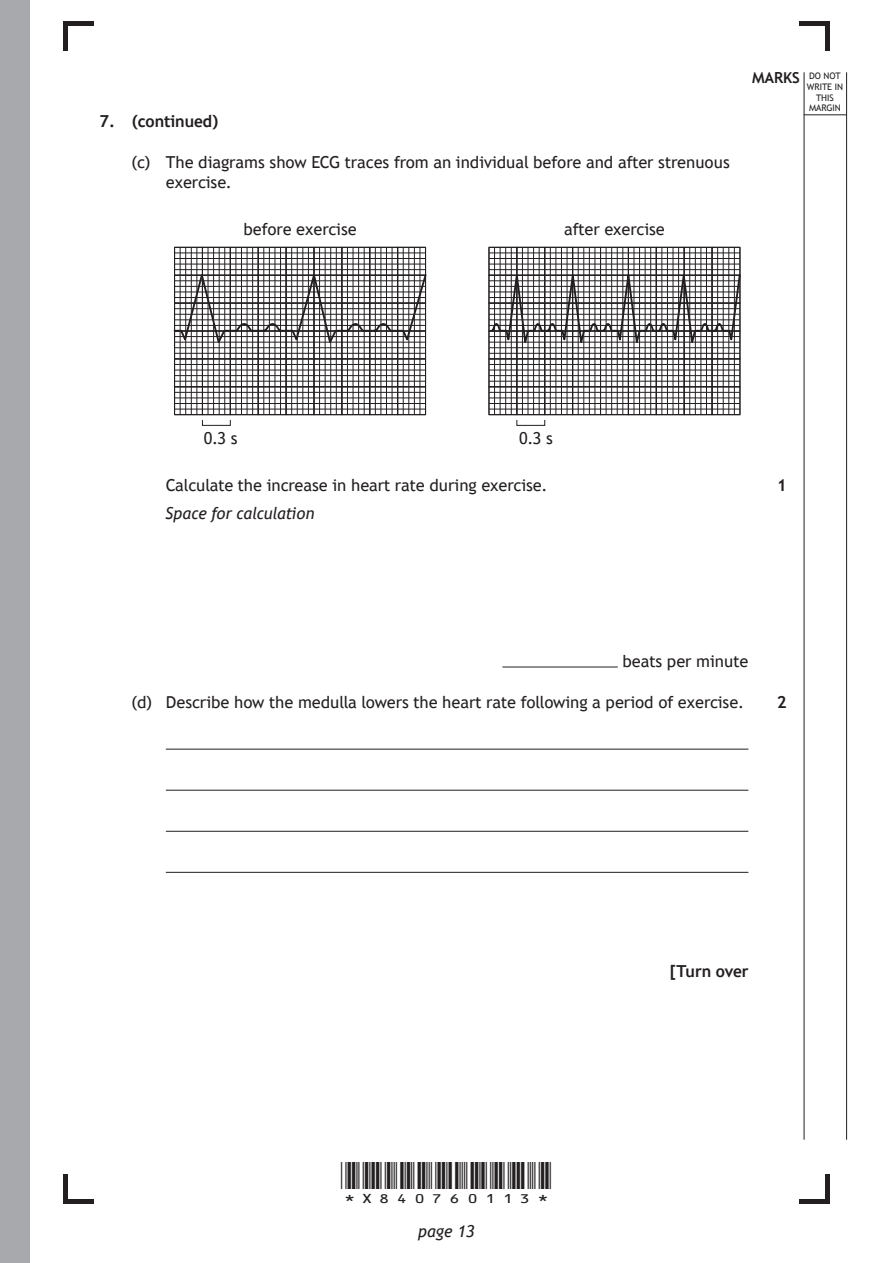
   (c) The diagrams show ECG traces from an individual before and after strenuous
      exercise.
             before exercise               after exercise

          0.3 s                        0.3 s

      Calculate the increase in heart rate during exercise.   1
      Space for calculation

                                     ������������������������� beats per minute

   (d) Describe how the medulla lowers the heart rate following a period of exercise. 2

                                                     [Turn over

                      *X840760113*

                             page 13
PDF page 14
Question 8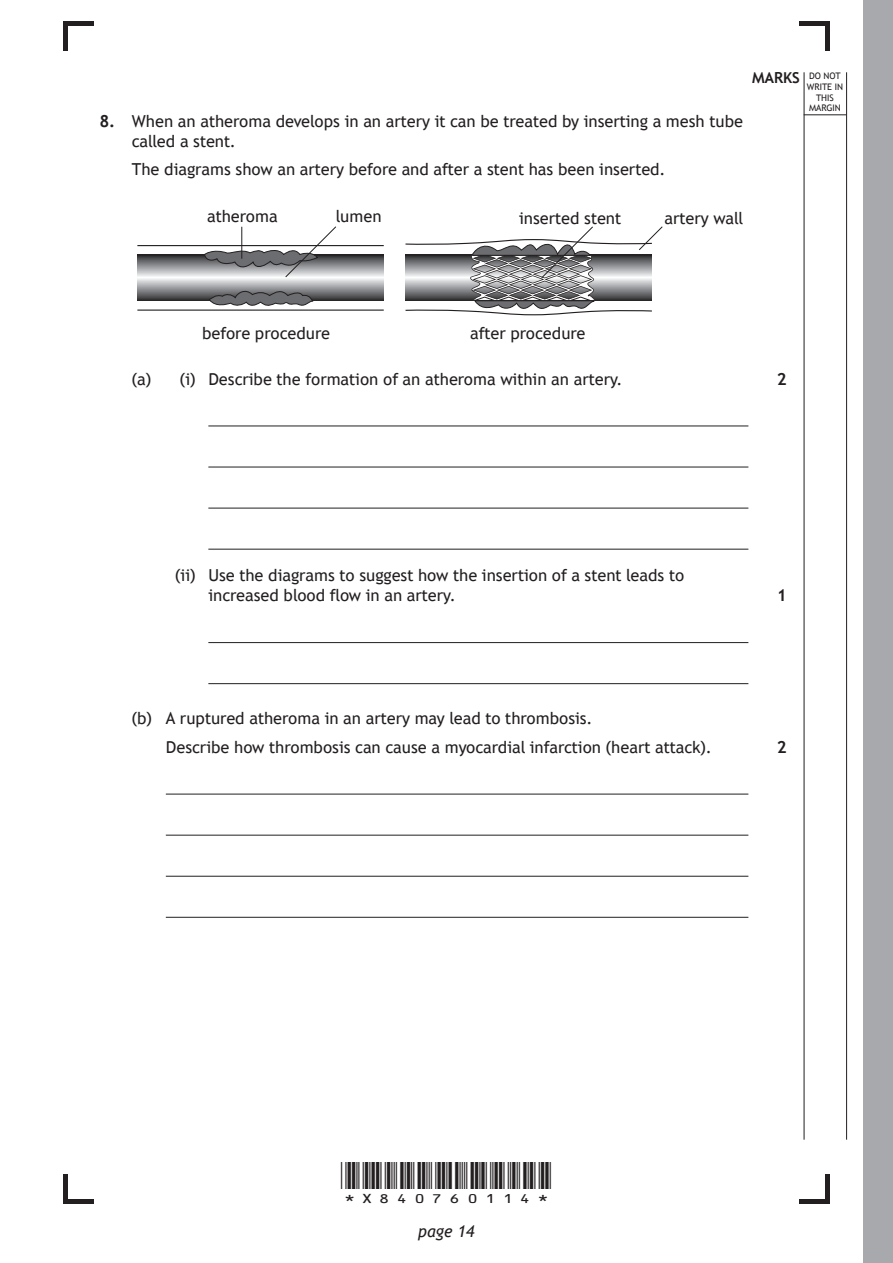
Selectable page text
MARKS DO NOT
                                                                 WRITE IN
                                                                  THIS
                                                                 MARGIN
8. When an atheroma develops in an artery it can be treated by inserting a mesh tube
   called a stent.
   The diagrams show an artery before and after a stent has been inserted.
          atheroma    lumen            inserted stent artery wall

          before procedure        after procedure

   (a)  (i) Describe the formation of an atheroma within an artery. 2

       (ii) Use the diagrams to suggest how the insertion of a stent leads to
          increased blood flow in an artery.                  1

   (b) A ruptured atheroma in an artery may lead to thrombosis.
      Describe how thrombosis can cause a myocardial infarction (heart attack). 2

                      *X840760114*

                             page 14
PDF page 15
Selectable page text
MARKS DO NOT
                                                                 WRITE IN
                                                                  THIS
                                                                 MARGIN
8. (continued)
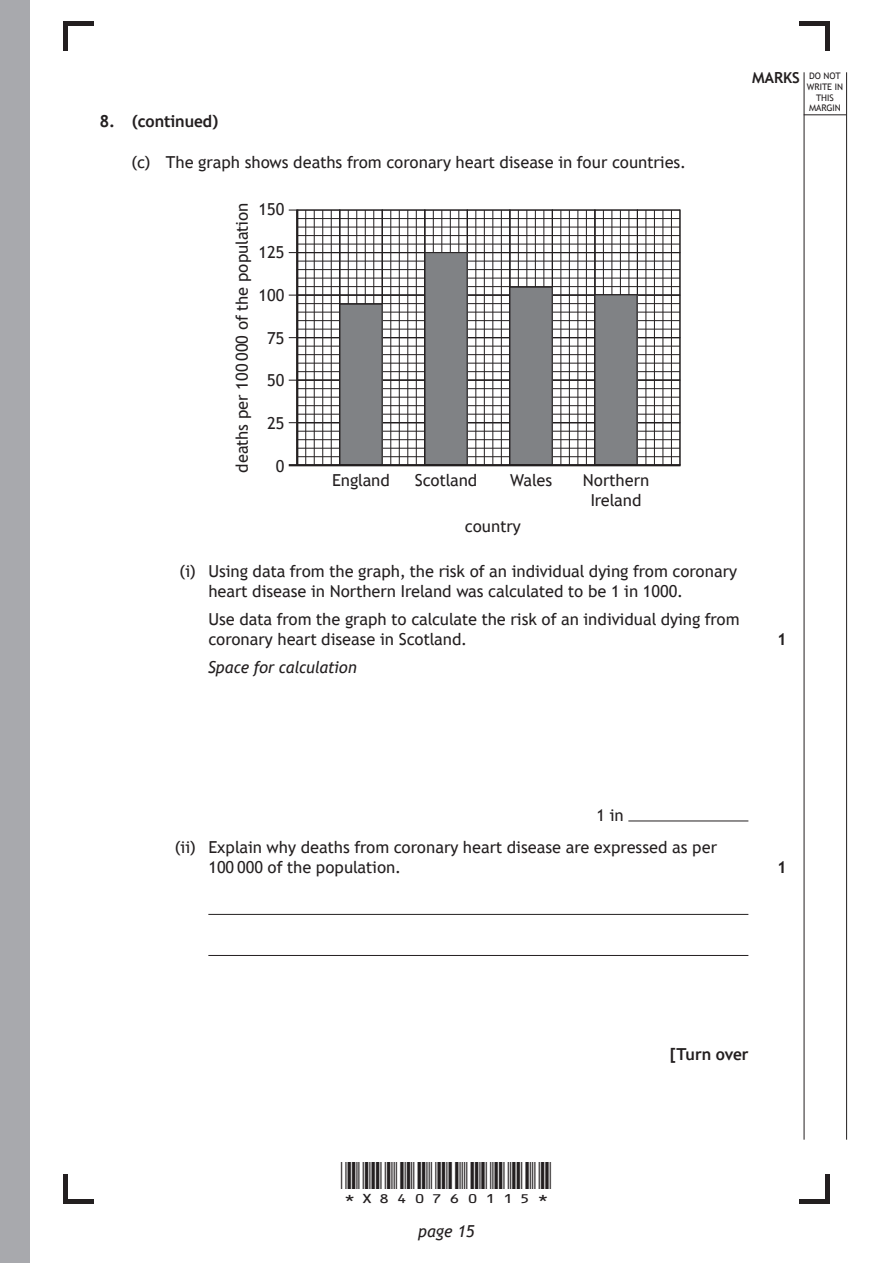
   (c) The graph shows deaths from coronary heart disease in four countries.
               150

               125

               100

                75

                50

                25

                0

                      *X840760115*

                             page 15
             noitalupop
             eht
             fo
             000001
             rep
             shtaed
                      England Scotland Wales Northern
                                             Ireland
                                  country
        (i) Using data from the graph, the risk of an individual dying from coronary
          heart disease in Northern Ireland was calculated to be 1 in 1000.
          Use data from the graph to calculate the risk of an individual dying from
          coronary heart disease in Scotland.                 1
          Space for calculation
                                              1 in ��������������������������
       (ii) Explain why deaths from coronary heart disease are expressed as per
          100 000 of the population.                          1
                                                     [Turn over
PDF page 16
Question 9
Selectable page text
MARKS DO NOT
                                                                 WRITE IN
                                                                  THIS
                                                                 MARGIN
9. High density lipoproteins (HDLs) and low density lipoproteins (LDLs) transport
   cholesterol around the body.
   (a)  (i) State a use of cholesterol in the body.           1

       (ii) Name the organ to which HDL transports excess cholesterol for
          elimination.                                        1

   (b) Familial hypercholesterolaemia (FH) is an inherited condition.
      Individuals with FH have high levels of LDLs in their bloodstream.

        (i) Statins are drugs, and can be prescribed to individuals with FH.

          Statins act as competitive inhibitors of an enzyme involved in the
          synthesis of cholesterol.
          Describe the mode of action of competitive inhibitors such as statins. 1

       (ii) FH is caused by an autosomal dominant allele.
          Describe two ways in which the patterns of inheritance in a family
          history would indicate autosomal dominance.         2

          1.

          2.

                      *X840760116*

                             page 16
PDF page 17
Question 10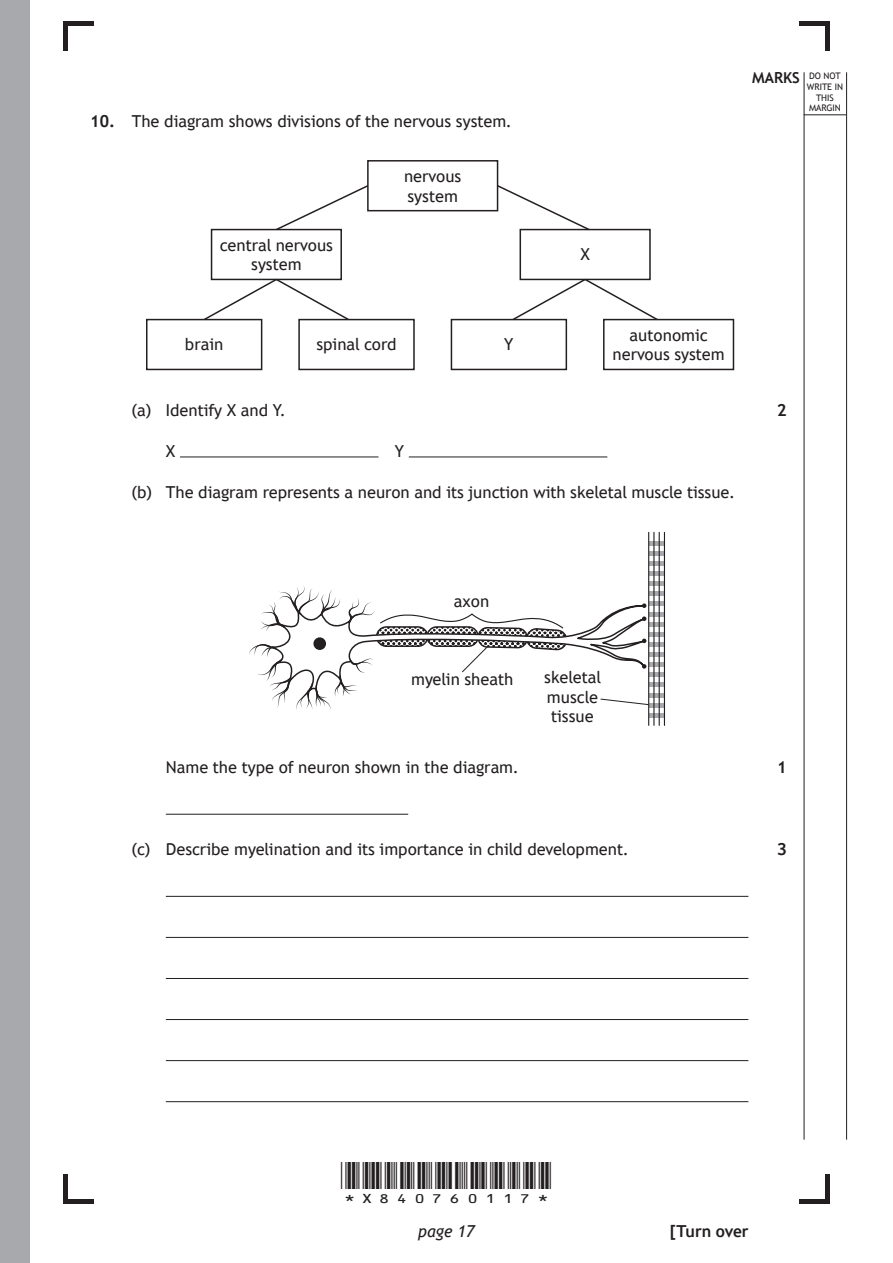
Selectable page text
MARKS DO NOT
                                                                  WRITE IN
                                                                   THIS
                                                                  MARGIN
10. The diagram shows divisions of the nervous system.
                             nervous
                             system

            central nervous
                                             X
               system

                                                  autonomic
         brain       spinal cord      Y
                                                nervous system

    (a) Identify X and Y.                                      2

       X ������������������������������������������� Y �������������������������������������������

    (b) The diagram represents a neuron and its junction with skeletal muscle tissue.

                                  axon

                              myelin sheath skeletal
                                          muscle
                                           tissue

       Name the type of neuron shown in the diagram.           1

    (c) Describe myelination and its importance in child development. 3

                       *X840760117*

                              page 17                 [Turn over
PDF page 18
Question 11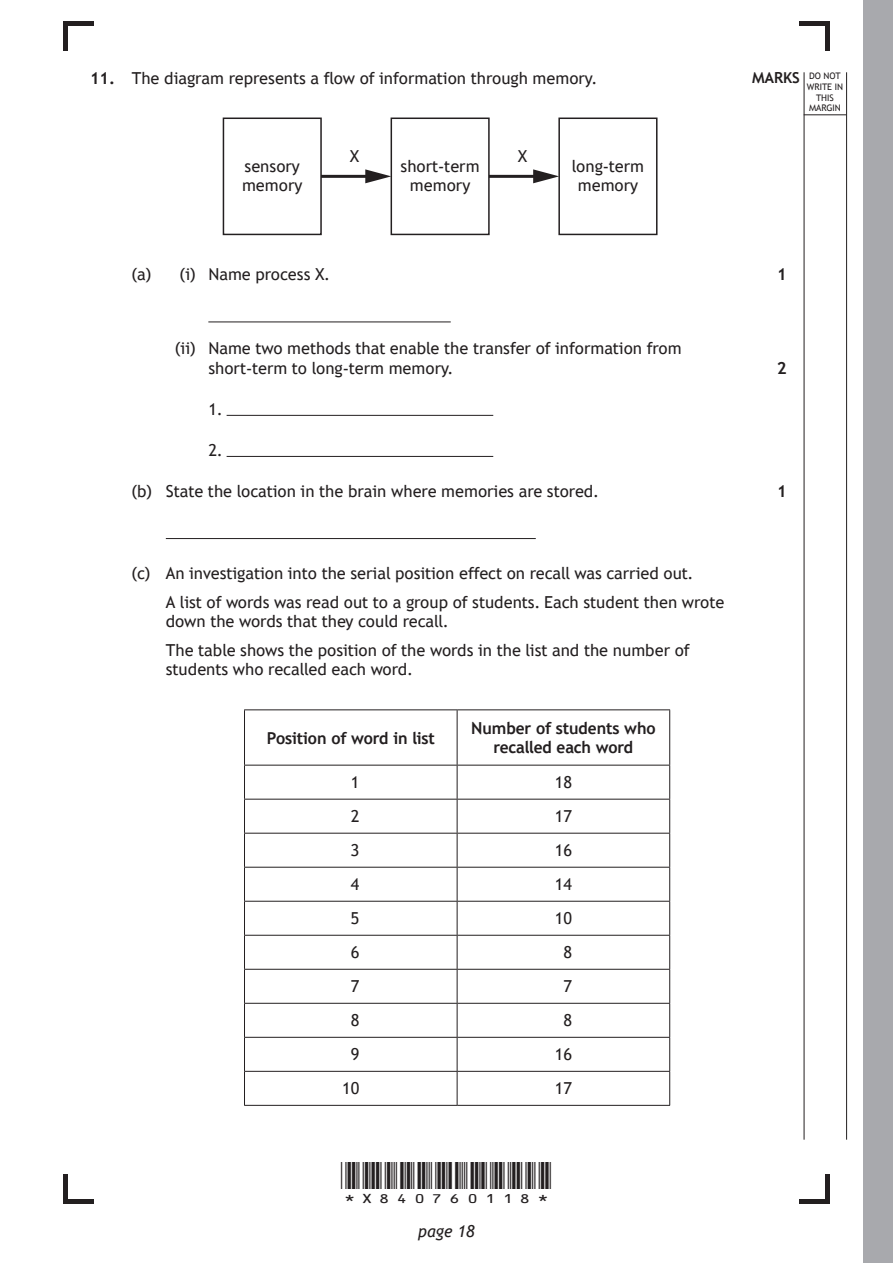
Selectable page text
11. The diagram represents a flow of information through memory. MARKS DO NOT
                                                                  WRITE IN
                                                                   THIS
                                                                  MARGIN
                        X               X
              sensory        short-term      long-term
              memory          memory         memory

    (a)  (i) Name process X.                                   1

        (ii) Name two methods that enable the transfer of information from
           short‑term to long‑term memory.                     2

           1.

           2.

    (b) State the location in the brain where memories are stored. 1

    (c) An investigation into the serial position effect on recall was carried out.

       A list of words was read out to a group of students. Each student then wrote
       down the words that they could recall.
       The table shows the position of the words in the list and the number of
       students who recalled each word.

                                   Number of students who
                 Position of word in list
                                     recalled each word
                        1                  18

                        2                  17
                        3                  16

                        4                  14

                        5                  10

                        6                   8
                        7                   7

                        8                   8

                        9                  16
                       10                  17

                       *X840760118*

                              page 18
PDF page 19
Selectable page text
MARKS DO NOT
                                                                  WRITE IN
                                                                   THIS
                                                                  MARGIN
11. (c) (continued)
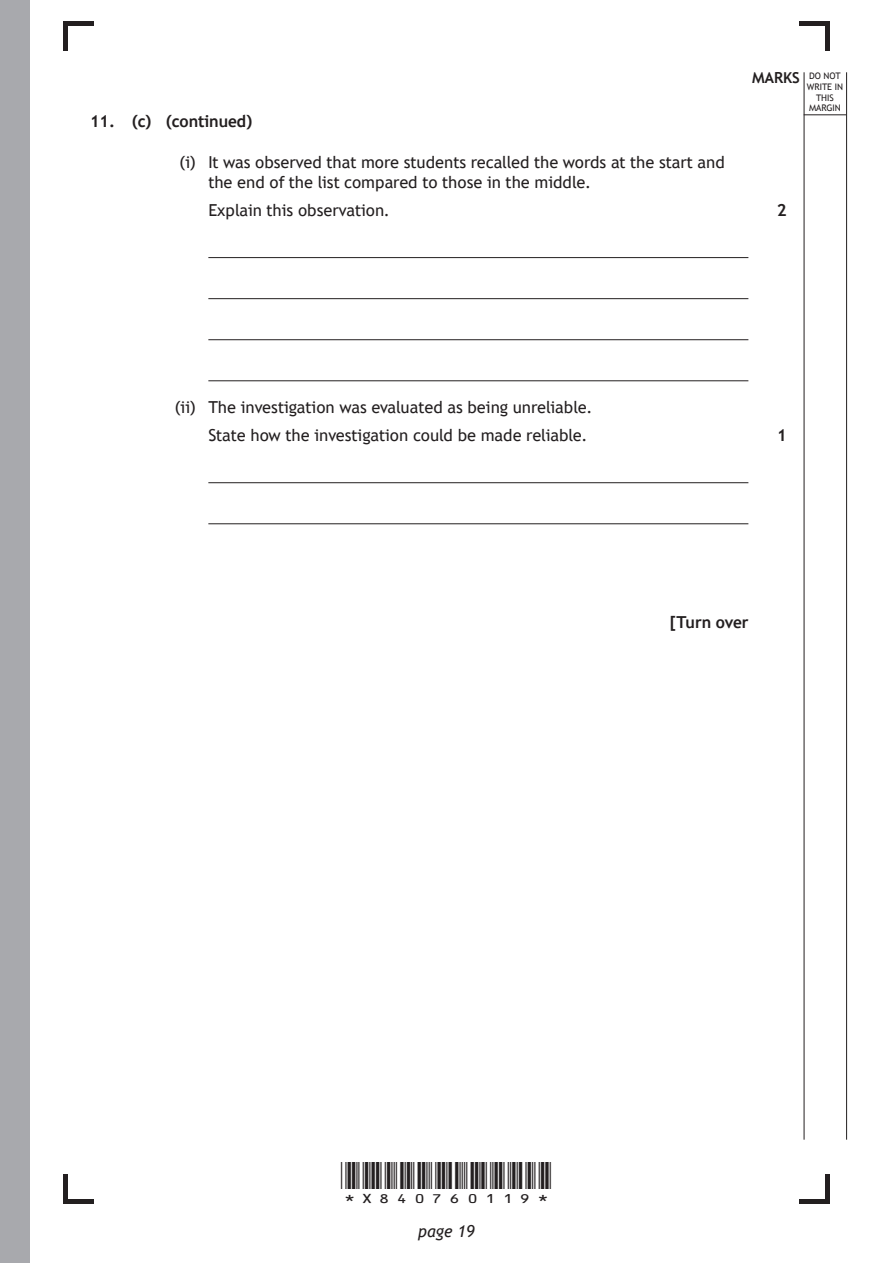
         (i) It was observed that more students recalled the words at the start and
           the end of the list compared to those in the middle.
           Explain this observation.                           2

        (ii) The investigation was evaluated as being unreliable.
           State how the investigation could be made reliable. 1

                                                      [Turn over

                       *X840760119*

                              page 19
PDF page 20
Question 12
Selectable page text
MARKS DO NOT
                                                                  WRITE IN
                                                                   THIS
                                                                  MARGIN
12. Dopamine is a neurotransmitter that activates the reward pathway in the brain.
    (a) State one effect of activating the reward pathway.     1

    (b) State one method of removal of dopamine from a synapse. 1

    (c)  (i) A dopamine agonist can be used in the treatment of Parkinson’s disease.

           State the effect of prolonged use of an agonist.    1

        (ii) In a clinical trial of a potential new drug for the treatment of Parkinson’s
           disease, individuals were divided into groups in a randomised way.
           Name one other protocol that could be used during this clinical trial and
           explain its importance to the results.              2

           Protocol

           Importance

        (iii) State one other design factor that would allow the results of the clinical
           trial to have statistical significance.             1

                       *X840760120*

                              page 20
PDF page 21
Question 13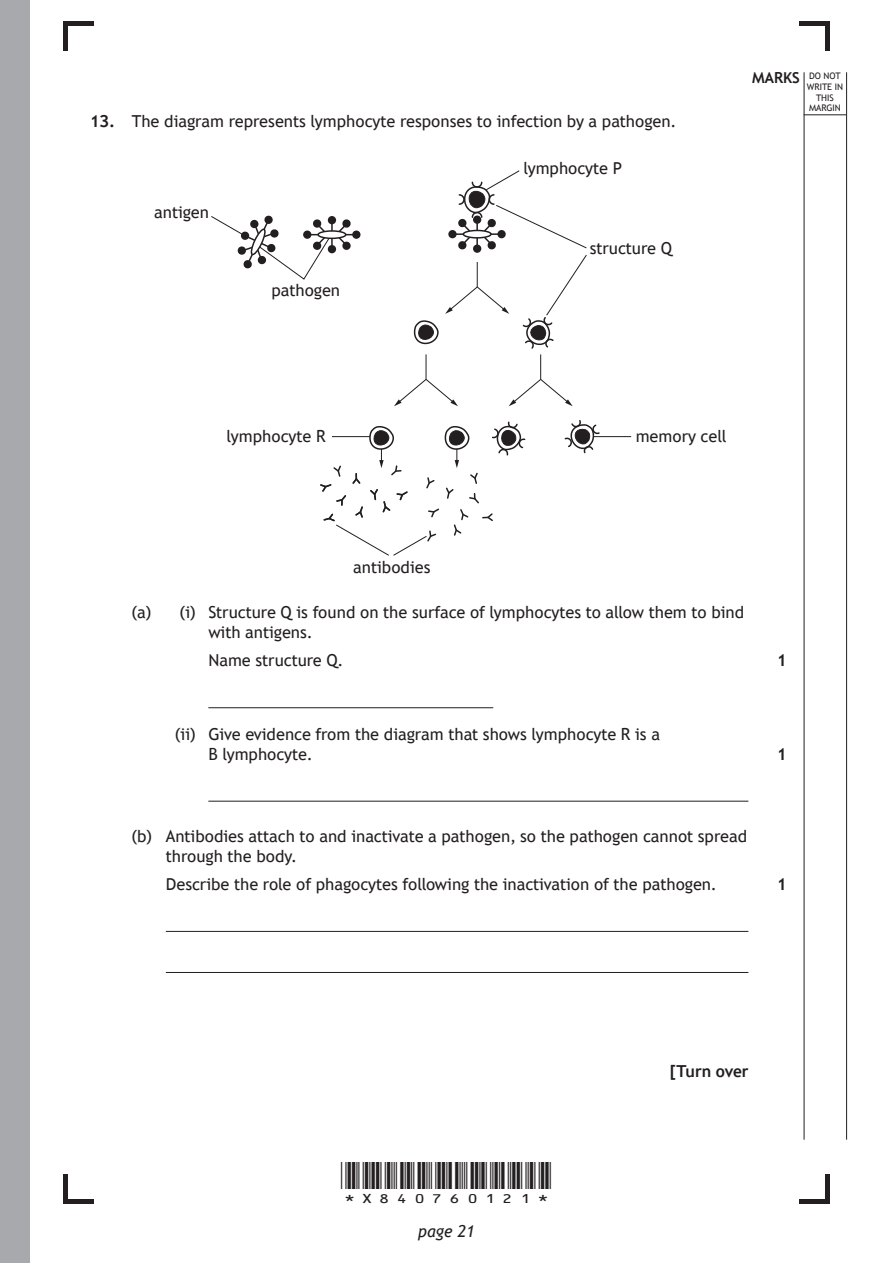
Selectable page text
MARKS DO NOT
                                                                  WRITE IN
                                                                   THIS
                                                                  MARGIN
13. The diagram represents lymphocyte responses to infection by a pathogen.
                                        lymphocyte P

      antigen
                                              structure Q

                 pathogen

             lymphocyte R                         memory cell

                        antibodies

    (a)  (i) Structure Q is found on the surface of lymphocytes to allow them to bind
           with antigens.

           Name structure Q.                                   1

        (ii) Give evidence from the diagram that shows lymphocyte R is a
           B lymphocyte.                                       1

    (b) Antibodies attach to and inactivate a pathogen, so the pathogen cannot spread
       through the body.
       Describe the role of phagocytes following the inactivation of the pathogen. 1

                                                      [Turn over

                       *X840760121*

                              page 21
PDF page 22
Selectable page text
MARKS DO NOT
                                                                  WRITE IN
                                                                   THIS
                                                                  MARGIN
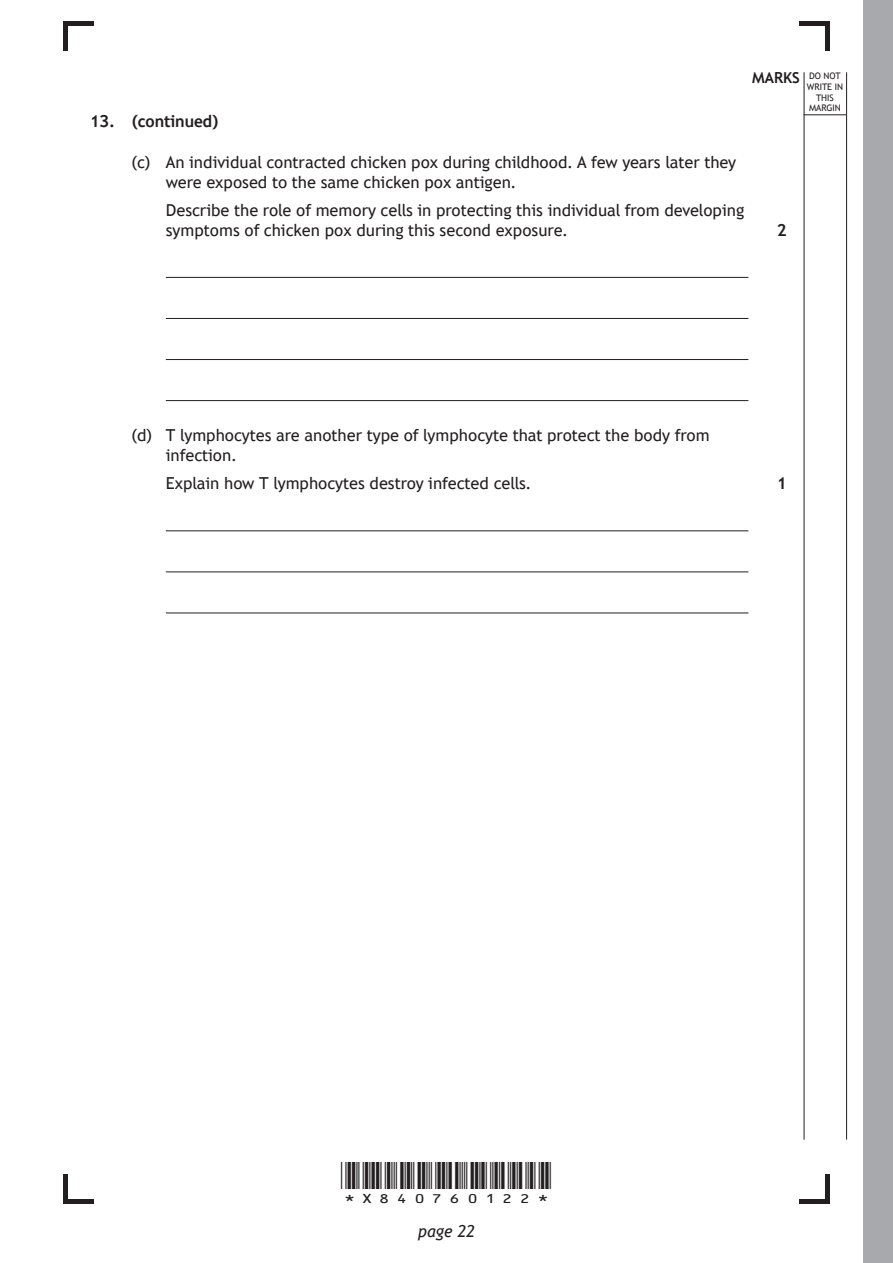
13. (continued)
    (c) An individual contracted chicken pox during childhood. A few years later they
       were exposed to the same chicken pox antigen.
       Describe the role of memory cells in protecting this individual from developing
       symptoms of chicken pox during this second exposure.    2

    (d) T lymphocytes are another type of lymphocyte that protect the body from
       infection.
       Explain how T lymphocytes destroy infected cells.       1

                       *X840760122*

                              page 22
PDF page 23

Selectable page text
[Turn over for next question

DO NOT WRITE ON THIS PAGE

*X840760123*

       page 23
PDF page 24
Question 14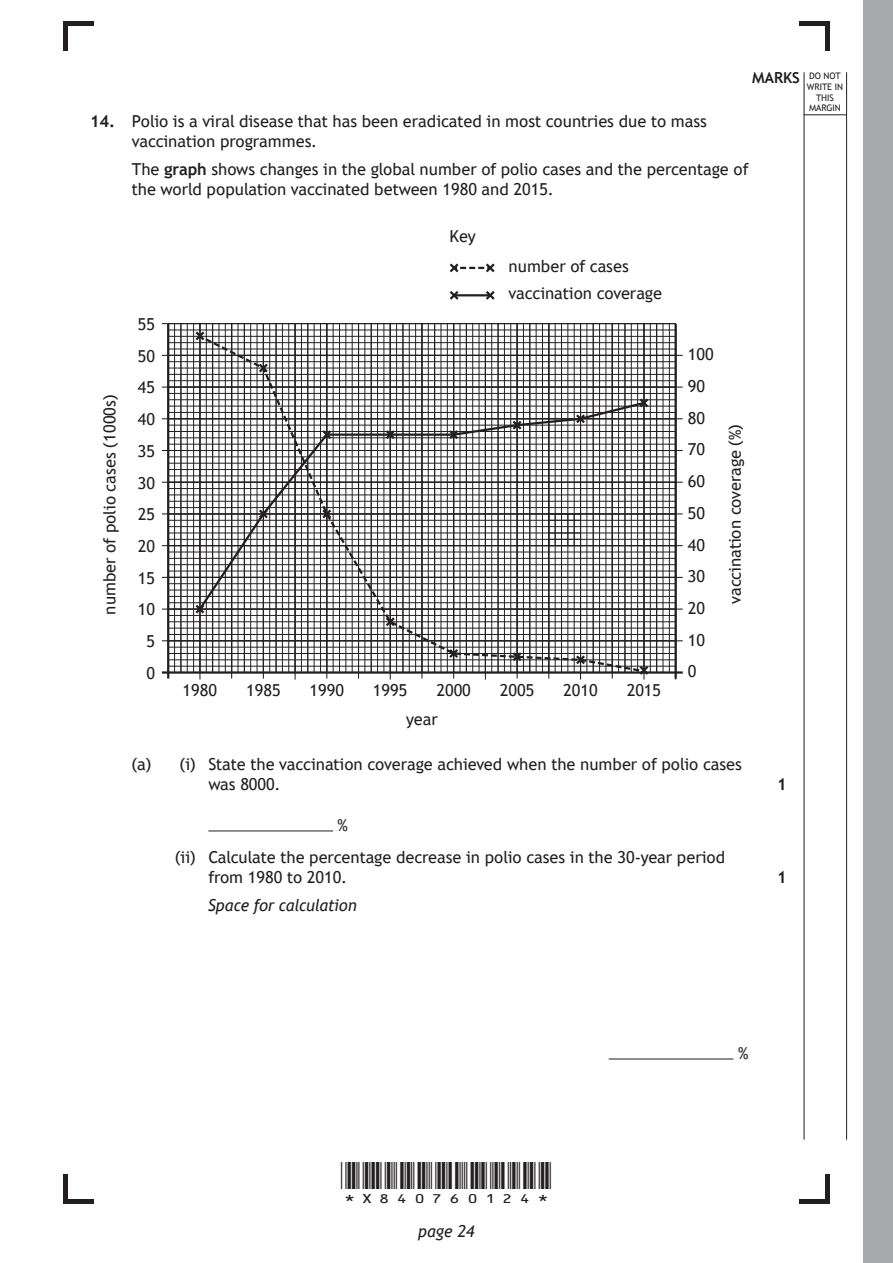
Selectable page text
MARKS DO NOT
                                                                  WRITE IN
                                                                   THIS
                                                                  MARGIN
14. Polio is a viral disease that has been eradicated in most countries due to mass
    vaccination programmes.
    The graph shows changes in the global number of polio cases and the percentage of
    the world population vaccinated between 1980 and 2015.
                                 Key
                                       number of cases

                                       vaccination coverage
     55

     50                                                100

     45                                                90
     40                                                80

     35                                                70
     30                                                60

     25                                                50

     20                                                40
     15                                                30

     10                                                20

     5                                                 10
     0                                                 0
         1980  1985 1990  1995  2000  2005  2010  2015

                             year

                       *X840760124*

                              page 24
 )s0001(
 sesac
 oilop
 fo
 rebmun
                                                           )%(
                                                           egarevoc
                                                           noitaniccav
    (a)  (i) State the vaccination coverage achieved when the number of polio cases
           was 8000.                                           1
           ��������������������������� %
        (ii) Calculate the percentage decrease in polio cases in the 30‑year period
           from 1980 to 2010.                                  1
           Space for calculation
                                                ��������������������������� %
PDF page 25

Selectable page text
14. (a) (continued)                                          MARKS DO NOT
                                                                  WRITE IN
                                                                   THIS
                                                                  MARGIN
        (iii) Use data from the graph to describe the changes in vaccination coverage
           between 1980 and 2000.                              2

    (b) Polio is still present in some developing countries.

       The table shows the number of polio cases in one of these countries between
       2000 and 2010.

         Year             2000  2002  2004  2006  2008  2010

         Number of polio cases 90 50   20    15   10    15

         (i) Using data in the table and graph, calculate the simple whole number
           ratio of the global number of cases of polio to the number of cases in
           this country in 2000.                               1

           Space for calculation

                                                  :

                                           global    country

        (ii) In order to establish herd immunity for polio, there has to be at least 85%
           vaccination coverage.
           If the population of this country is 2 million people, calculate the number
           of individuals that must be vaccinated to establish herd immunity for
           polio in this country.                              1

           Space for calculation

        (iii) Suggest why the herd immunity threshold may not be reached in this
           developing country despite a 10‑year mass vaccination programme. 1

                       *X840760125*

                              page 25                 [Turn over
PDF page 26
Question 15
Selectable page text
MARKS DO NOT
                                                                  WRITE IN
                                                                   THIS
                                                                  MARGIN
15. Attempt either A or B.
    Write your answer in the space below and on page 27.
    A  Write notes on the follicular and luteal phases of the menstrual cycle. 9

    OR

    B  Write notes on the biology of controlling fertility and the methods of
       contraception.                                          9

    You may use labelled diagrams where appropriate.

                       *X840760126*

                              page 26
PDF page 27

Selectable page text
MARKS DO NOT
                                                    WRITE IN
                                                     THIS
                                                    MARGIN
ADDITIONAL SPACE FOR ANSWER to question 15

          [END OF QUESTION PAPER]

         *X840760127*

                page 27
PDF page 28
Selectable page text
MARKS DO NOT
                                                                  WRITE IN
                                                                   THIS
                                                                  MARGIN
            ADDITIONAL SPACE FOR ANSWERS AND ROUGH WORK
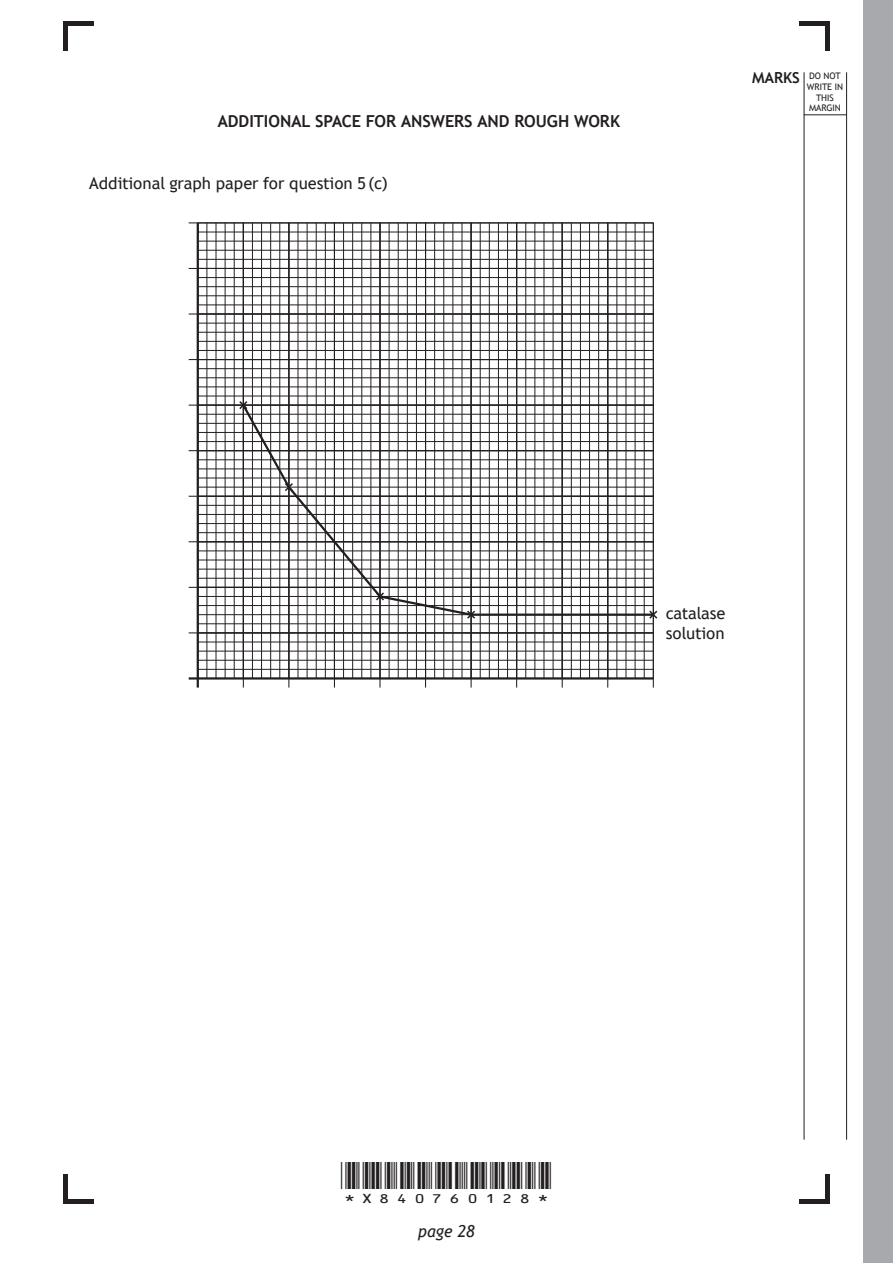
Additional graph paper for question 5 (c)

                                                     catalase
                                                     solution

                       *X840760128*

                              page 28
PDF page 29

Selectable page text
MARKS DO NOT
                                                      WRITE IN
                                                       THIS
                                                      MARGIN
ADDITIONAL SPACE FOR ANSWERS AND ROUGH WORK

           *X840760129*

                  page 29
PDF page 30

Selectable page text
MARKS DO NOT
                                                      WRITE IN
                                                       THIS
                                                      MARGIN
ADDITIONAL SPACE FOR ANSWERS AND ROUGH WORK

           *X840760130*

                  page 30
PDF page 31

Selectable page text
[BLANK PAGE]

DO NOT WRITE ON THIS PAGE

*X840760131*

       page 31
PDF page 32

Selectable page text
[BLANK PAGE]

DO NOT WRITE ON THIS PAGE

*X840760132*

       page 32