2024 Higher Human Biology - Paper 2 questions
Source: Scottish Qualifications Authority (SQA) / Qualifications Scotland. This is a StemInteract HTML companion, not an official HTML edition. Extracted text is supplied alongside unaltered page images; use the images or original PDF for table layout, diagrams and symbols.
Jump to a question
PDF page 1
Selectable page text
FOR OFFICIAL USE
H
National
Qualications
Mark
2024
X840/76/01 Human Biology
Paper 2
WEDNESDAY, 15 MAY
10:10 AM – 12:30 PM
*X8407601*
Fill in these boxes and read what is printed below.
Full name of centre Town
Forename(s) Surname Number of seat
Date of birth
Day Month Year Scottish candidate number
Total marks — 95
Attempt ALL questions.
You may use a calculator.
Question 15 contains a choice.
Write your answers clearly in the spaces provided in this booklet. Additional space for answers
and rough work is provided at the end of this booklet. If you use this space you must clearly
identify the question number you are attempting. Any rough work must be written in this
booklet. Score through your rough work when you have written your final copy.
Use blue or black ink.
Before leaving the examination room you must give this booklet to the Invigilator; if you do not,
you may lose all the marks for this paper.
©
*X840760101*
A/HTPPDF page 2
Question 1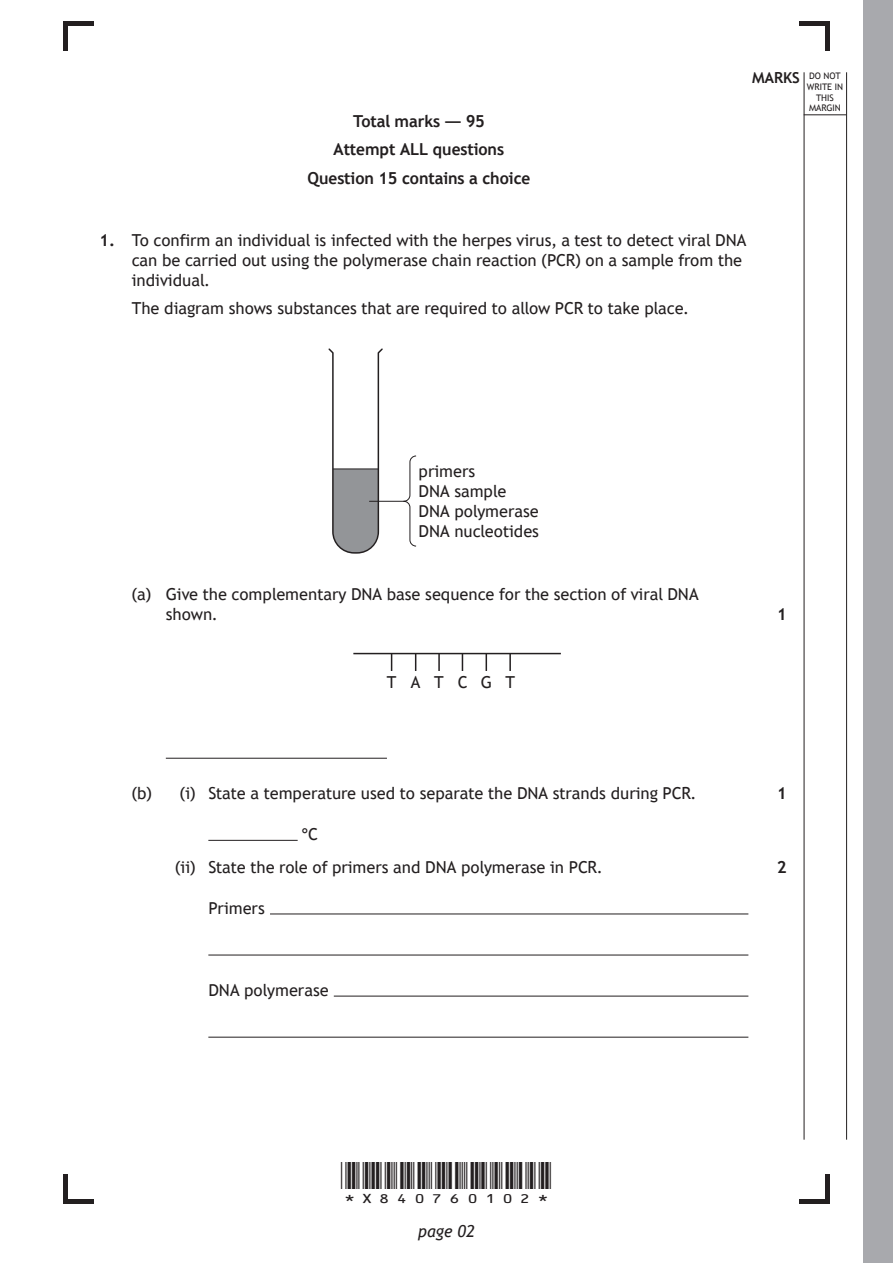
Selectable page text
MARKS DO NOT
                                                                 WRITE IN
                                                                  THIS
                                                                 MARGIN
                       Total marks — 95
                      Attempt ALL questions
                   Question 15 contains a choice

1. To confirm an individual is infected with the herpes virus, a test to detect viral DNA
   can be carried out using the polymerase chain reaction (PCR) on a sample from the
   individual.
   The diagram shows substances that are required to allow PCR to take place.

                             primers
                             DNA sample
                             DNA polymerase
                             DNA nucleotides

   (a) Give the complementary DNA base sequence for the section of viral DNA
      shown.                                                  1

                           T A T C G T

   (b)  (i) State a temperature used to separate the DNA strands during PCR. 1

                   °C

       (ii) State the role of primers and DNA polymerase in PCR. 2

          Primers

          DNA polymerase

                      *X840760102*

                             page 02
PDF page 3

Selectable page text
MARKS DO NOT
                                                                 WRITE IN
                                                                  THIS
                                                                 MARGIN
1. (continued)
   (c) State two uses of PCR, other than diagnosing viral infections. 2
      1.

      2.

                                                     [Turn over

                      *X840760103*

                             page 03
PDF page 4
Question 2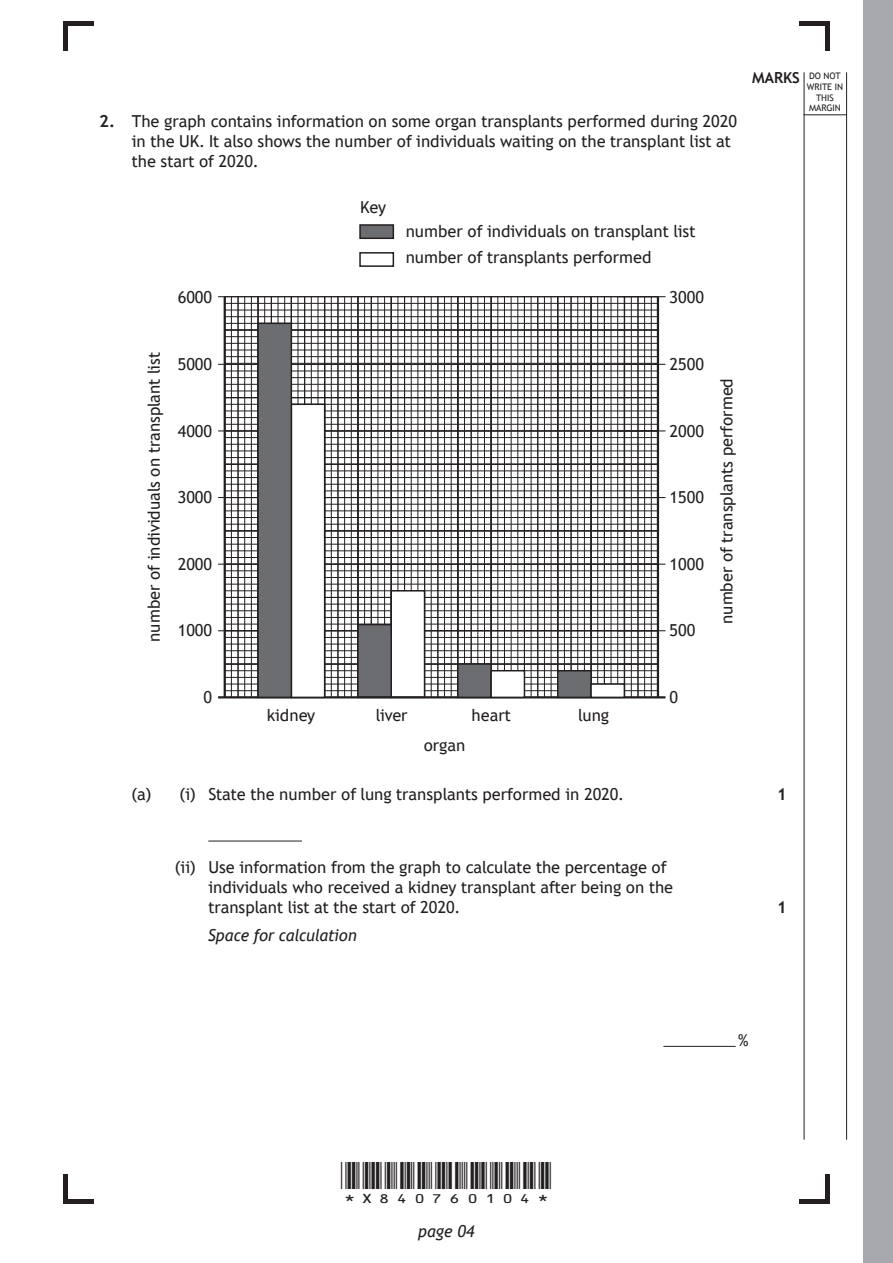
Selectable page text
MARKS DO NOT
                                                                 WRITE IN
                                                                  THIS
                                                                 MARGIN
2. The graph contains information on some organ transplants performed during 2020
   in the UK. It also shows the number of individuals waiting on the transplant list at
   the start of 2020.

                                                     3000

                                                     2500

                                                     2000

                                                     1500

                                                     1000

                                                     500

                                                     0

                      *X840760104*

                             page 04
                                                         demrofrep
                                                         stnalpsnart
                                                         fo
                                                         rebmun
       6000
       5000
       4000
       3000
       2000
       1000
          0
                kidney    liver   heart     lung
                              organ
     tsil
     tnalpsnart
     no
     slaudividni
     fo
     rebmun
                        Key
                            number of individuals on transplant list
                            number of transplants performed
   (a)  (i) State the number of lung transplants performed in 2020. 1
       (ii) Use information from the graph to calculate the percentage of
          individuals who received a kidney transplant after being on the
          transplant list at the start of 2020.               1
          Space for calculation
                                                           %
PDF page 5

Selectable page text
MARKS DO NOT
                                                                 WRITE IN
                                                                  THIS
                                                                 MARGIN
2. (continued)
   (b) The table shows the total number of transplants performed in three different
      countries in 2020.

                          Number of transplants performed
                  Country
                           (per million of the population)
                 Scotland            72

                 England             47
                 Wales               40

        (i) In 2020 the population of England was 57 million.

          Calculate how many transplants were performed in England during 2020. 1
          Space for calculation

       (ii) Explain why the data are presented as the number of transplants
          performed per million of the population.            1

                                                     [Turn over

                      *X840760105*

                             page 05
PDF page 6
Question 3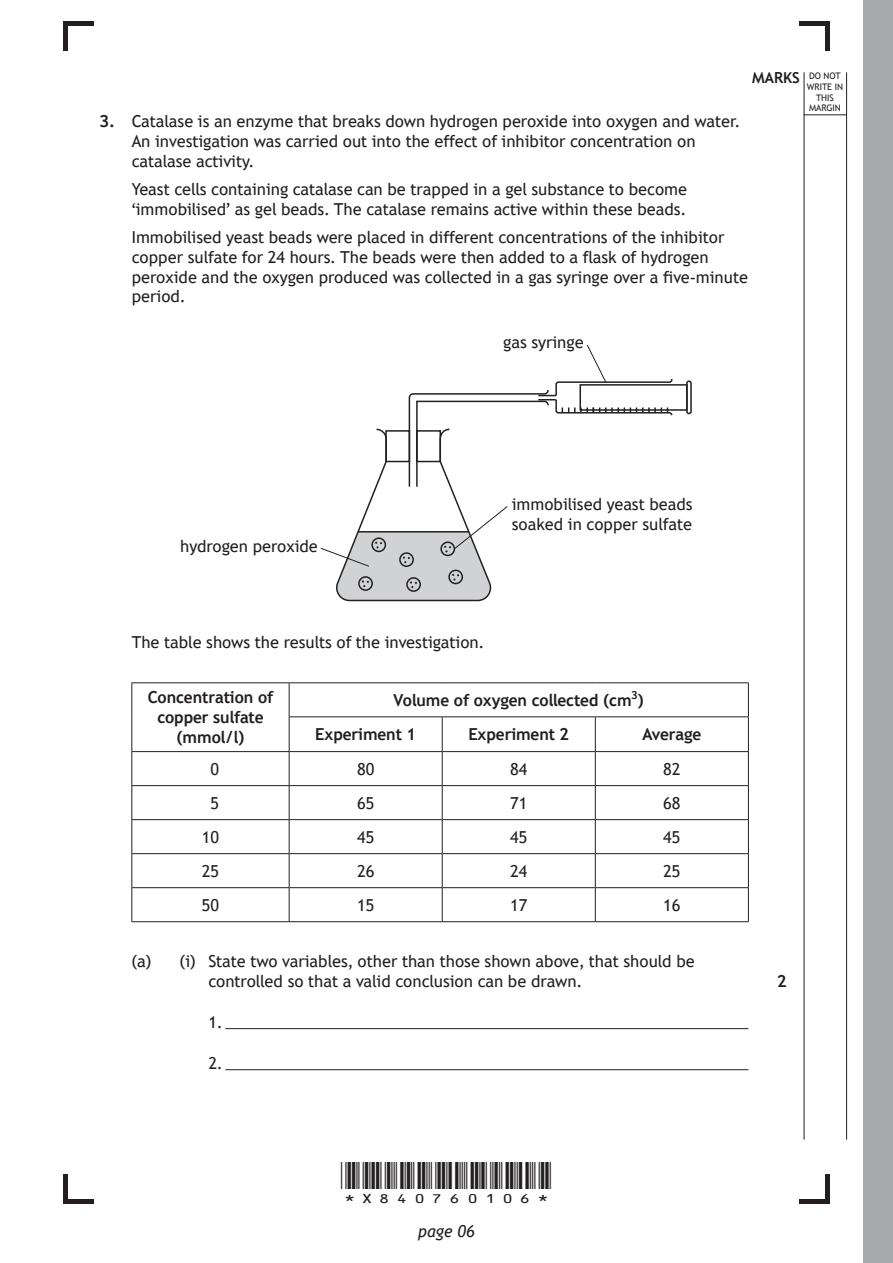
Selectable page text
MARKS DO NOT
                                                                 WRITE IN
                                                                  THIS
                                                                 MARGIN
3. Catalase is an enzyme that breaks down hydrogen peroxide into oxygen and water.
   An investigation was carried out into the effect of inhibitor concentration on
   catalase activity.
   Yeast cells containing catalase can be trapped in a gel substance to become
   ‘immobilised’ as gel beads. The catalase remains active within these beads.
   Immobilised yeast beads were placed in different concentrations of the inhibitor
   copper sulfate for 24 hours. The beads were then added to a flask of hydrogen
   peroxide and the oxygen produced was collected in a gas syringe over a five-minute
   period.
                                     gas syringe

                                      immobilised yeast beads
                                      soaked in copper sulfate
        hydrogen peroxide

   The table shows the results of the investigation.

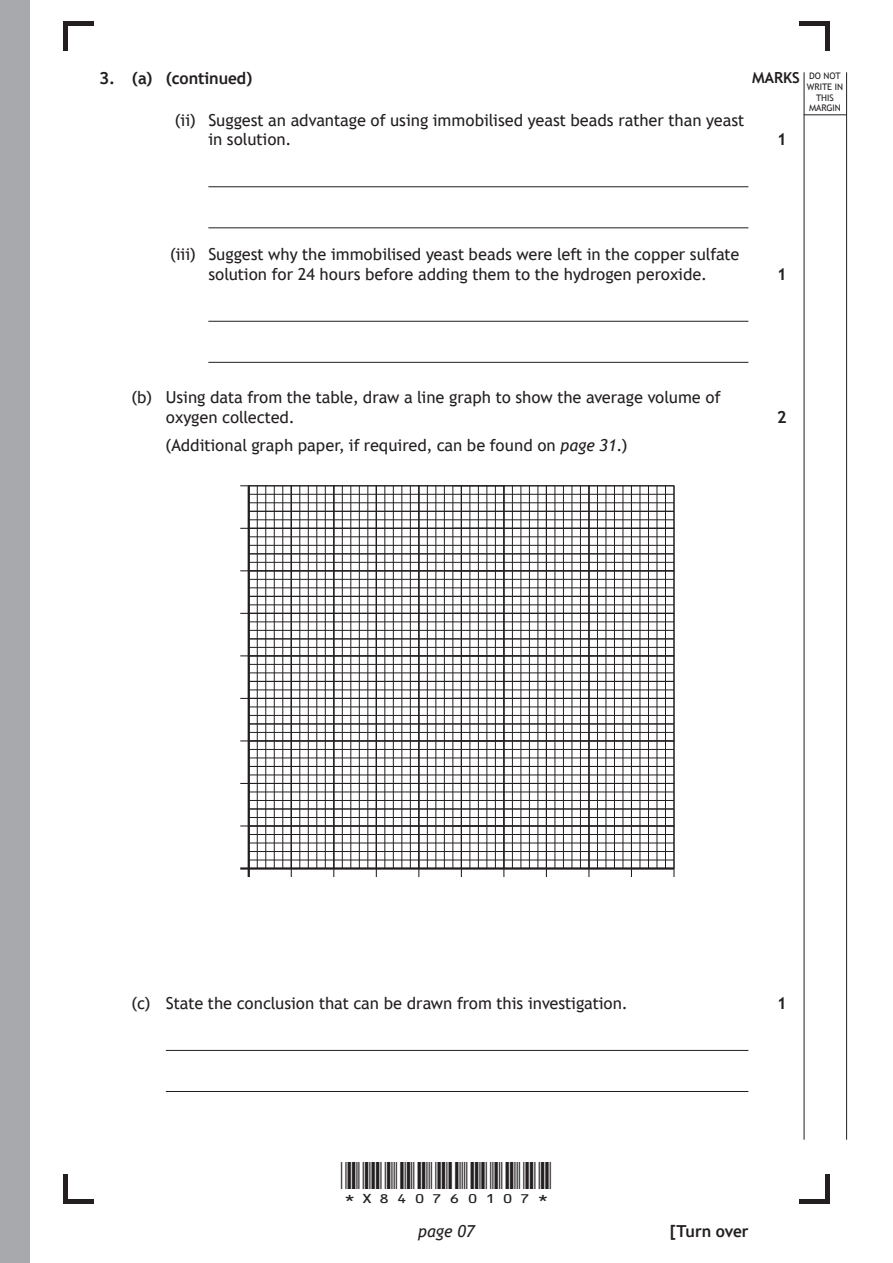
     Concentration of      Volume of oxygen collected (cm3)
     copper sulfate
       (mmol/l)     Experiment 1  Experiment 2    Average

          0             80            84            82

          5             65            71            68

          10            45            45            45
          25            26            24            25

          50            15            17            16

   (a)  (i) State two variables, other than those shown above, that should be
          controlled so that a valid conclusion can be drawn. 2

          1.

          2.

                      *X840760106*

                             page 06
PDF page 7
Selectable page text
3. (a) (continued)                                          MARKS DO NOT
                                                                 WRITE IN
                                                                  THIS
                                                                 MARGIN
       (ii) Suggest an advantage of using immobilised yeast beads rather than yeast
          in solution.                                        1

       (iii) Suggest why the immobilised yeast beads were left in the copper sulfate
          solution for 24 hours before adding them to the hydrogen peroxide. 1

   (b) Using data from the table, draw a line graph to show the average volume of
      oxygen collected.                                       2
      (Additional graph paper, if required, can be found on page 31.)

   (c) State the conclusion that can be drawn from this investigation. 1

                      *X840760107*

                             page 07                 [Turn over
PDF page 8
Question 4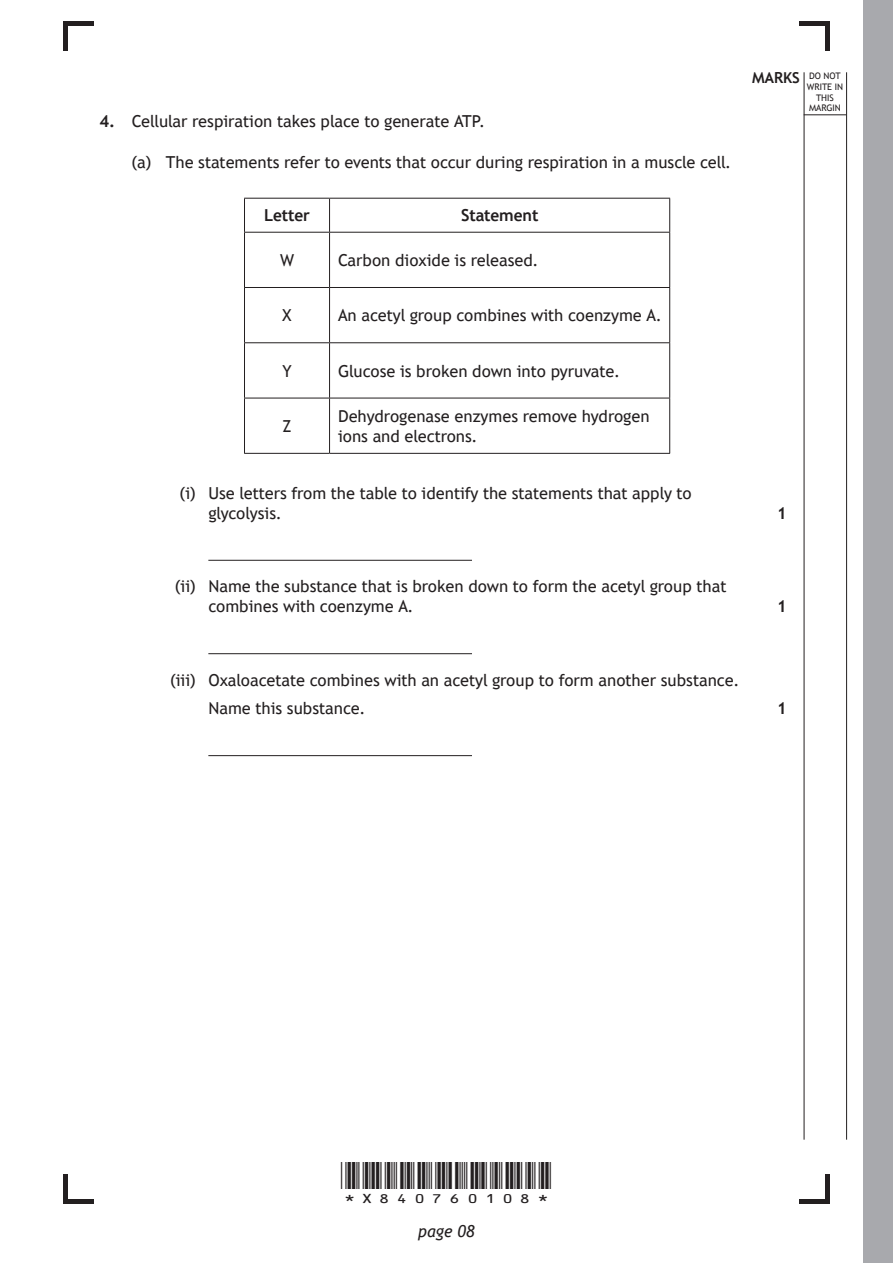
Selectable page text
MARKS DO NOT
                                                                 WRITE IN
                                                                  THIS
                                                                 MARGIN
4. Cellular respiration takes place to generate ATP.
   (a) The statements refer to events that occur during respiration in a muscle cell.

               Letter            Statement

                 W    Carbon dioxide is released.

                 X    An acetyl group combines with coenzyme A.

                 Y    Glucose is broken down into pyruvate.

                      Dehydrogenase enzymes remove hydrogen
                 Z
                      ions and electrons.

        (i) Use letters from the table to identify the statements that apply to
          glycolysis.                                         1

       (ii) Name the substance that is broken down to form the acetyl group that
          combines with coenzyme A.                           1

       (iii) Oxaloacetate combines with an acetyl group to form another substance.
          Name this substance.                                1

                      *X840760108*

                             page 08
PDF page 9
Selectable page text
MARKS DO NOT
                                                                 WRITE IN
                                                                  THIS
                                                                 MARGIN
4. (continued)
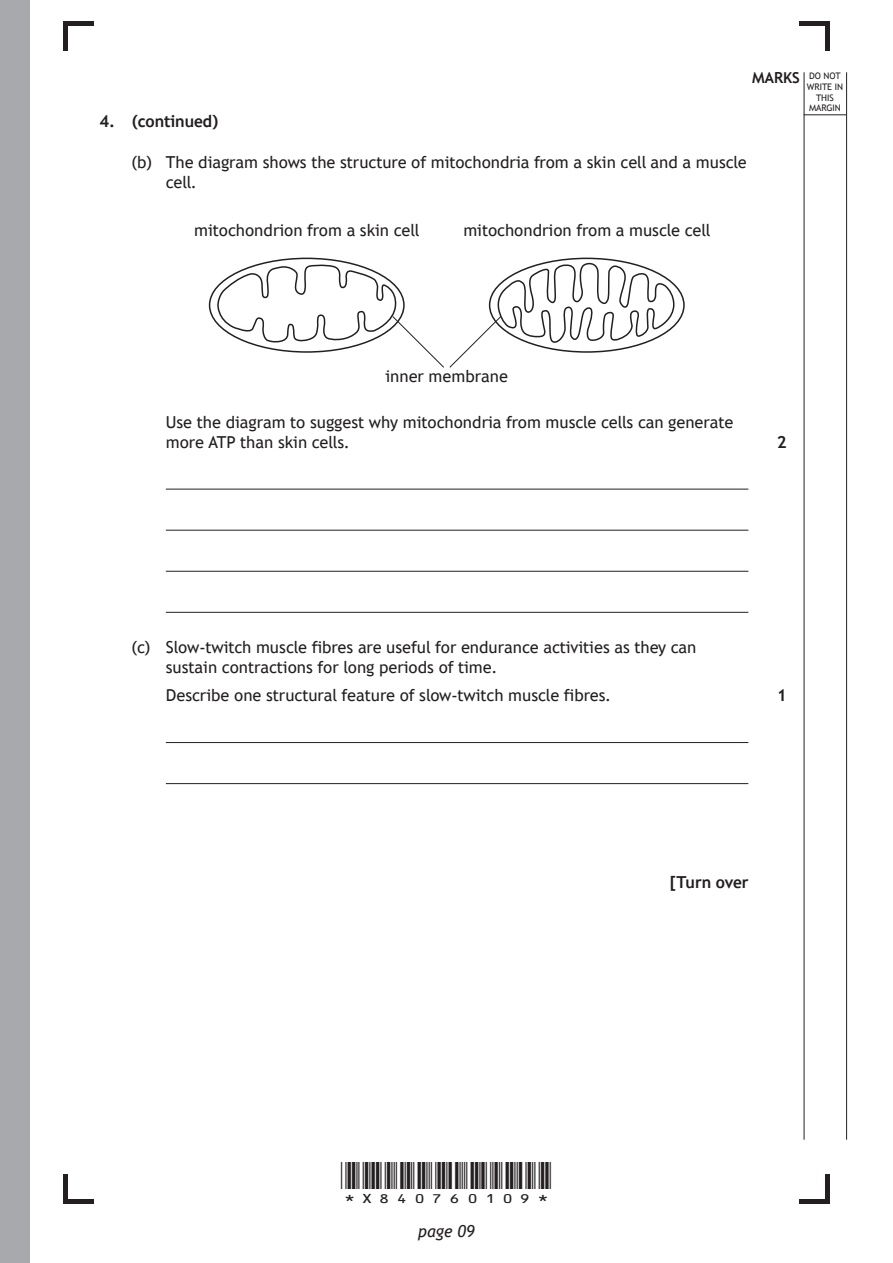
   (b) The diagram shows the structure of mitochondria from a skin cell and a muscle
      cell.
         mitochondrion from a skin cell mitochondrion from a muscle cell

                          inner membrane

      Use the diagram to suggest why mitochondria from muscle cells can generate
      more ATP than skin cells.                               2

   (c) Slow-twitch muscle fibres are useful for endurance activities as they can
      sustain contractions for long periods of time.
      Describe one structural feature of slow-twitch muscle fibres. 1

                                                     [Turn over

                      *X840760109*

                             page 09
PDF page 10
Question 5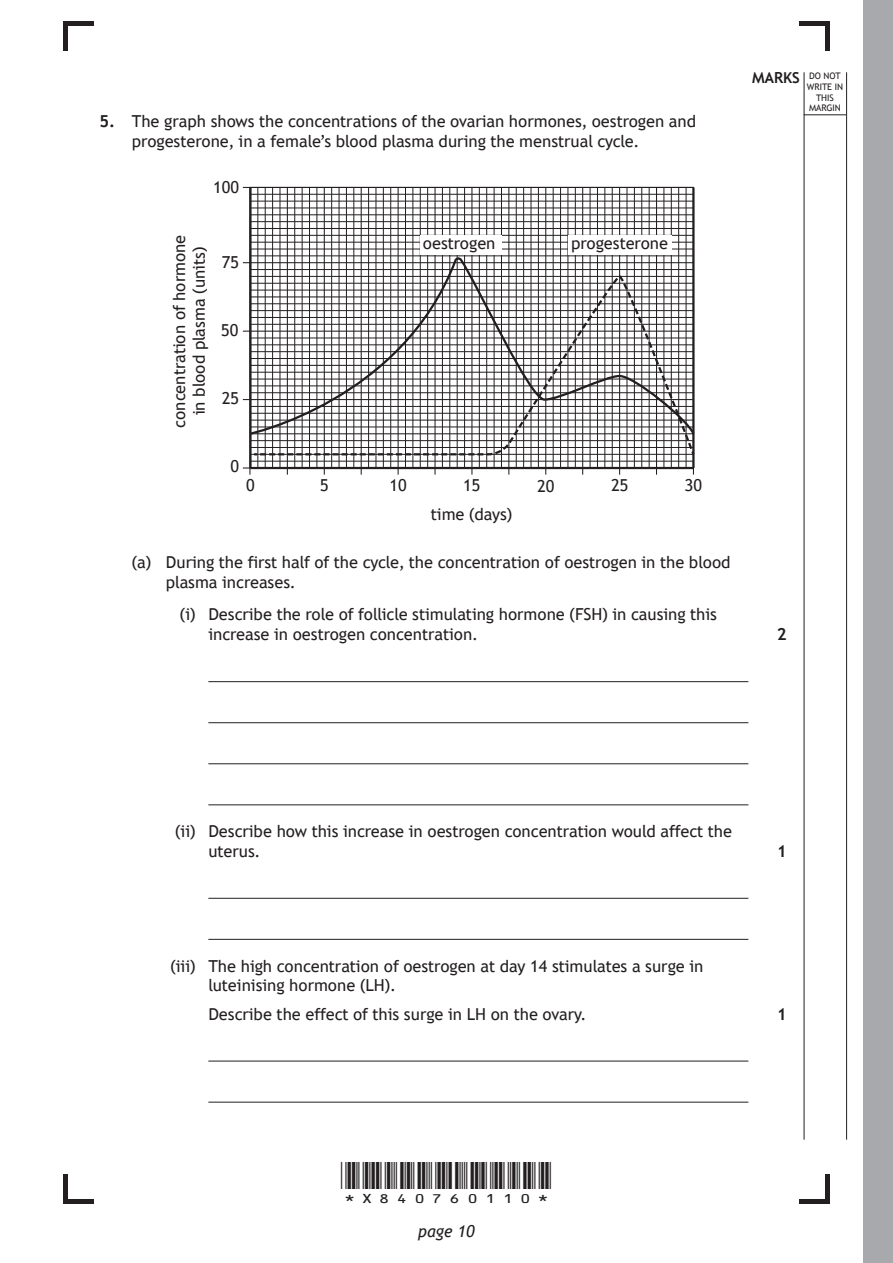
Selectable page text
MARKS DO NOT
                                                                 WRITE IN
                                                                  THIS
                                                                 MARGIN
5. The graph shows the concentrations of the ovarian hormones, oestrogen and
   progesterone, in a female’s blood plasma during the menstrual cycle.
           100

           75

           50

           25

            0
              0     5      10     15    20     25     30
                               time (days)

                      *X840760110*

                             page 10
       enomroh
       fo
       noitartnecnoc
         )stinu(
         amsalp
         doolb
         ni
                              oestrogen     progesterone
   (a) During the first half of the cycle, the concentration of oestrogen in the blood
      plasma increases.
        (i) Describe the role of follicle stimulating hormone (FSH) in causing this
          increase in oestrogen concentration.                2
       (ii) Describe how this increase in oestrogen concentration would affect the
          uterus.                                             1
       (iii) The high concentration of oestrogen at day 14 stimulates a surge in
          luteinising hormone (LH).
          Describe the effect of this surge in LH on the ovary. 1
PDF page 11
Selectable page text
MARKS DO NOT
                                                                 WRITE IN
                                                                  THIS
                                                                 MARGIN
5. (continued)
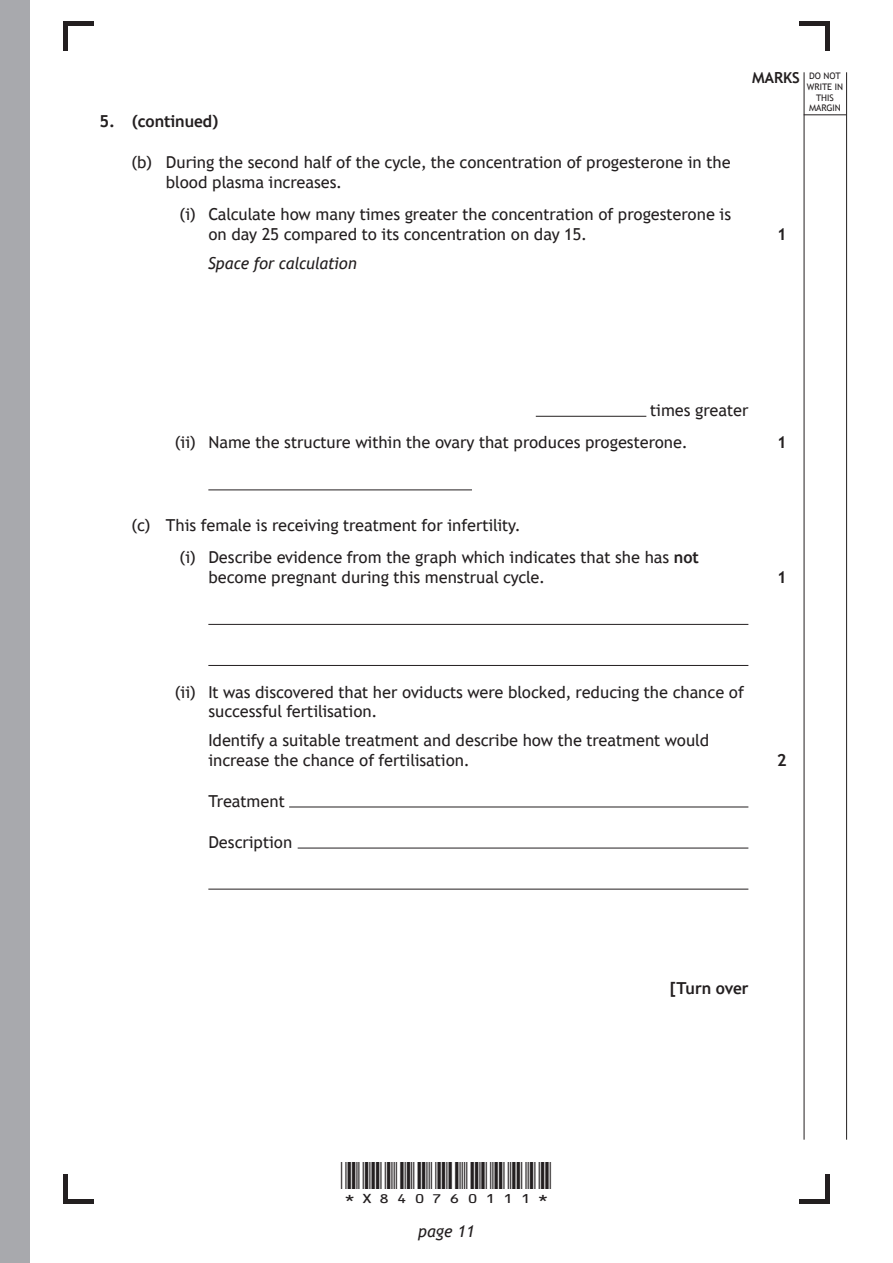
   (b) During the second half of the cycle, the concentration of progesterone in the
      blood plasma increases.
        (i) Calculate how many times greater the concentration of progesterone is
          on day 25 compared to its concentration on day 15.  1
          Space for calculation

                                                   times greater
       (ii) Name the structure within the ovary that produces progesterone. 1

   (c) This female is receiving treatment for infertility.
        (i) Describe evidence from the graph which indicates that she has not
          become pregnant during this menstrual cycle.        1

       (ii) It was discovered that her oviducts were blocked, reducing the chance of
          successful fertilisation.

          Identify a suitable treatment and describe how the treatment would
          increase the chance of fertilisation.               2

          Treatment

          Description

                                                     [Turn over

                      *X840760111*

                             page 11
PDF page 12
Question 6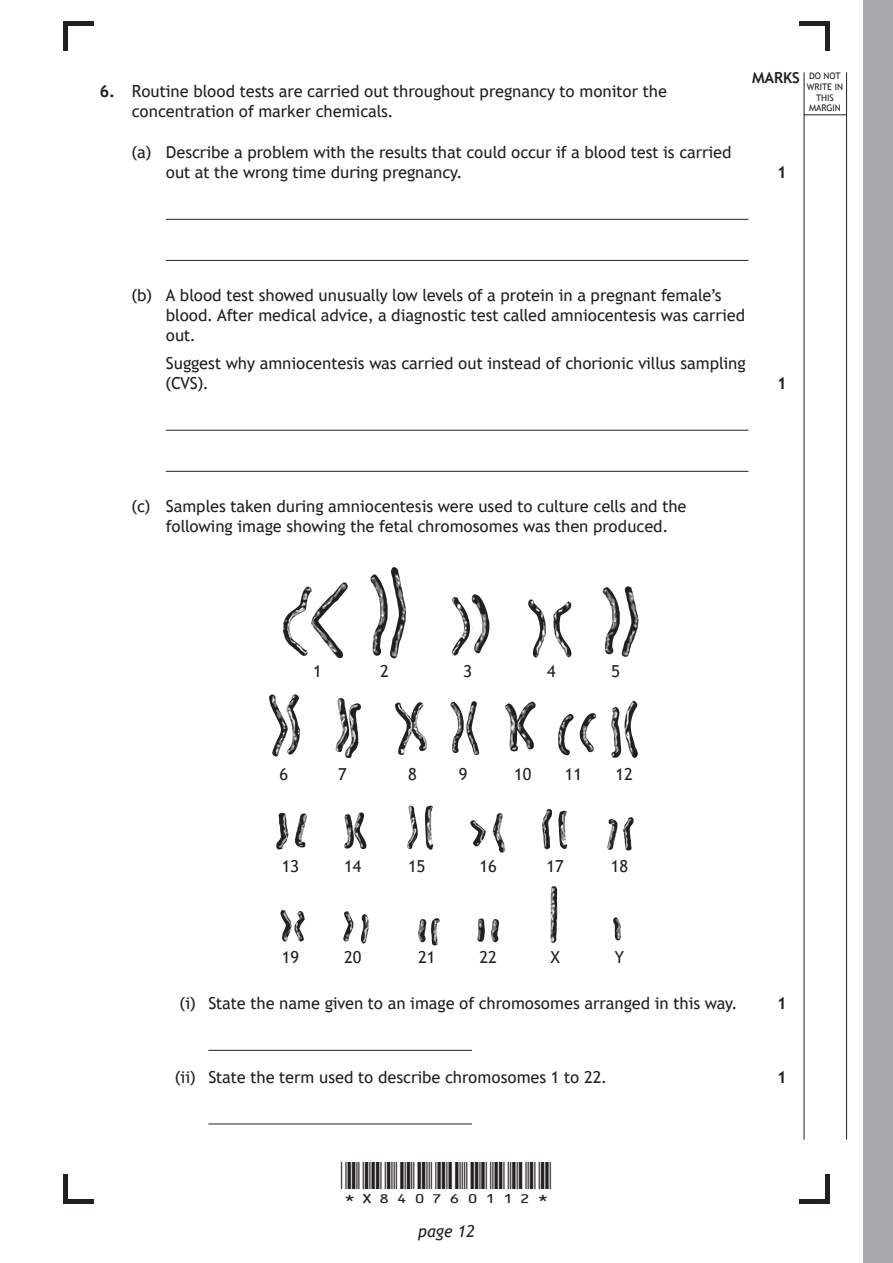
Selectable page text
MARKS DO NOT
6. Routine blood tests are carried out throughout pregnancy to monitor the WRITE IN
                                                                  THIS
   concentration of marker chemicals.                            MARGIN
   (a) Describe a problem with the results that could occur if a blood test is carried
      out at the wrong time during pregnancy.                 1

   (b) A blood test showed unusually low levels of a protein in a pregnant female’s
      blood. After medical advice, a diagnostic test called amniocentesis was carried
      out.
      Suggest why amniocentesis was carried out instead of chorionic villus sampling
      (CVS).                                                  1

   (c) Samples taken during amniocentesis were used to culture cells and the
      following image showing the fetal chromosomes was then produced.

                    1     2       3      4     5

                 6    7      8   9    10   11   12

                 13    14    15    16    17    18

                 19    20    21    22     X     Y

        (i) State the name given to an image of chromosomes arranged in this way. 1

       (ii) State the term used to describe chromosomes 1 to 22. 1

                      *X840760112*

                             page 12
PDF page 13

Selectable page text
[Turn over for next question

DO NOT WRITE ON THIS PAGE

*X840760113*

       page 13
PDF page 14
Question 7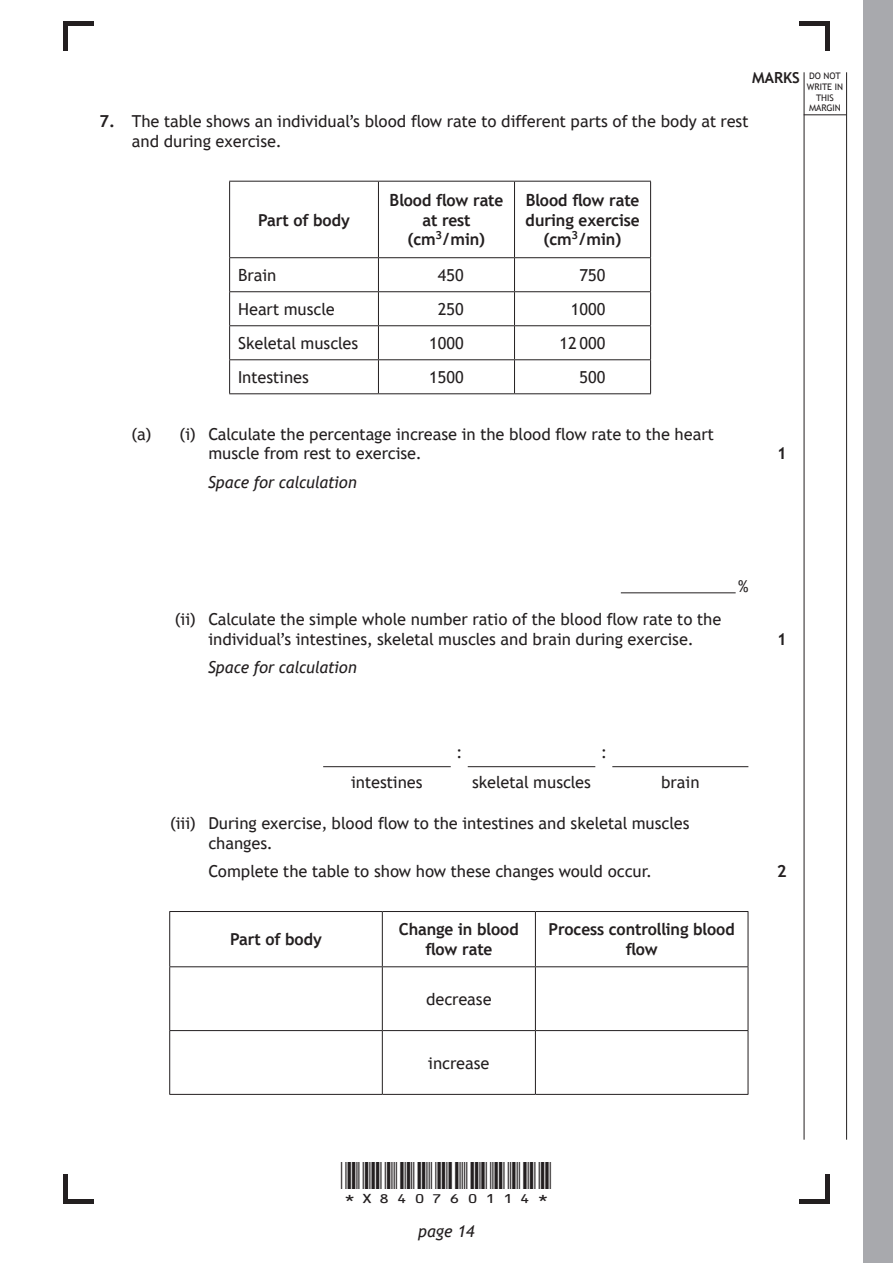
Selectable page text
MARKS DO NOT
                                                                 WRITE IN
                                                                  THIS
                                                                 MARGIN
7. The table shows an individual’s blood flow rate to different parts of the body at rest
   and during exercise.
                           Blood flow rate Blood flow rate
               Part of body   at rest  during exercise
                            (cm3/min)    (cm3/min)

             Brain             450          750

             Heart muscle      250         1000
             Skeletal muscles 1000        12 000

             Intestines       1500          500

   (a)  (i) Calculate the percentage increase in the blood flow rate to the heart
          muscle from rest to exercise.                       1
          Space for calculation

                                                           %
       (ii) Calculate the simple whole number ratio of the blood flow rate to the
          individual’s intestines, skeletal muscles and brain during exercise. 1

          Space for calculation

                                 :            :

                       intestines skeletal muscles  brain

       (iii) During exercise, blood flow to the intestines and skeletal muscles
          changes.
          Complete the table to show how these changes would occur. 2

                            Change in blood Process controlling blood
            Part of body
                              flow rate          flow

                              decrease

                              increase

                      *X840760114*

                             page 14
PDF page 15
Selectable page text
MARKS DO NOT
                                                                 WRITE IN
                                                                  THIS
                                                                 MARGIN
7. (continued)
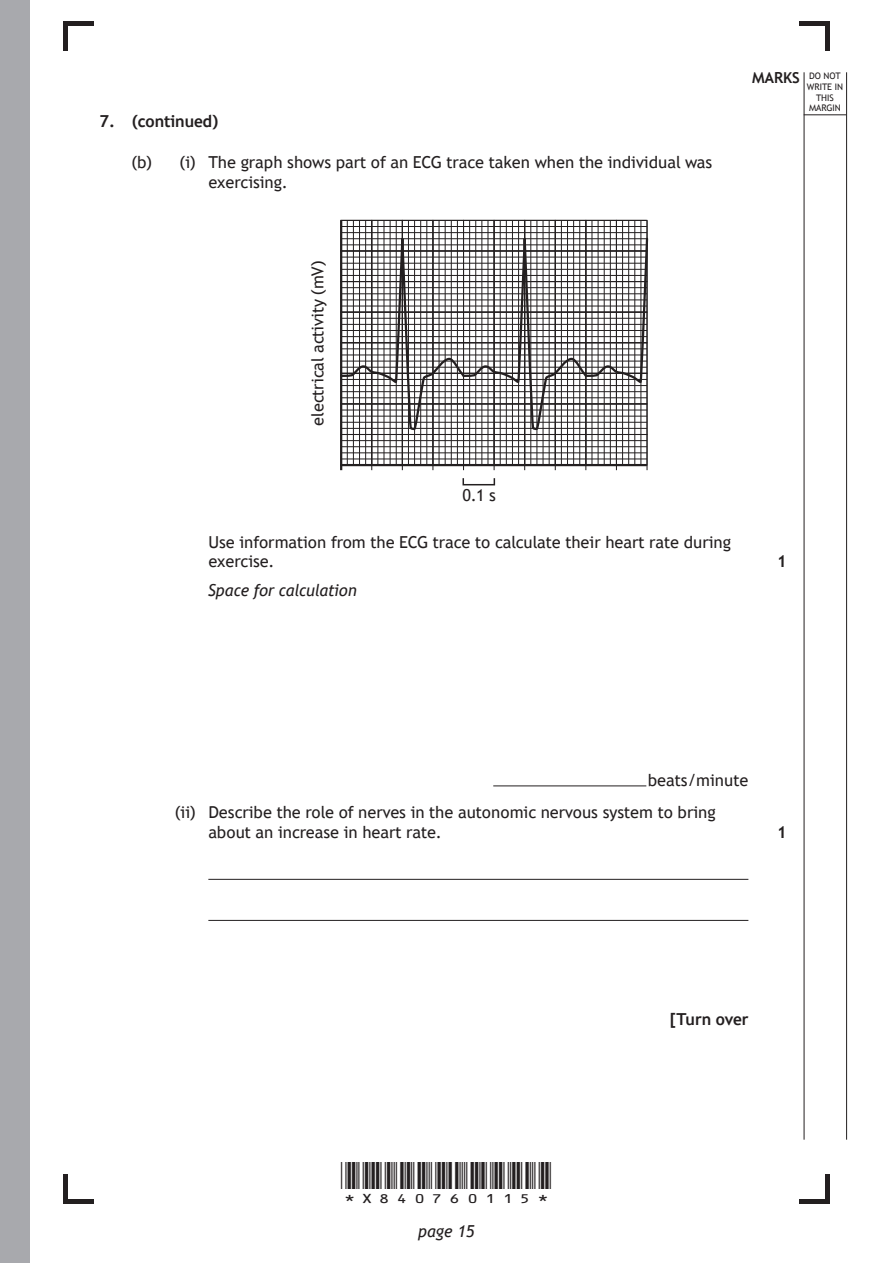
   (b)  (i) The graph shows part of an ECG trace taken when the individual was
          exercising.

                      *X840760115*

                             page 15
                    )Vm(
                    ytivitca
                    lacirtcele
                                  0.1 s
          Use information from the ECG trace to calculate their heart rate during
          exercise.                                           1
          Space for calculation
                                                   beats/minute
       (ii) Describe the role of nerves in the autonomic nervous system to bring
          about an increase in heart rate.                    1
                                                     [Turn over
PDF page 16
Question 8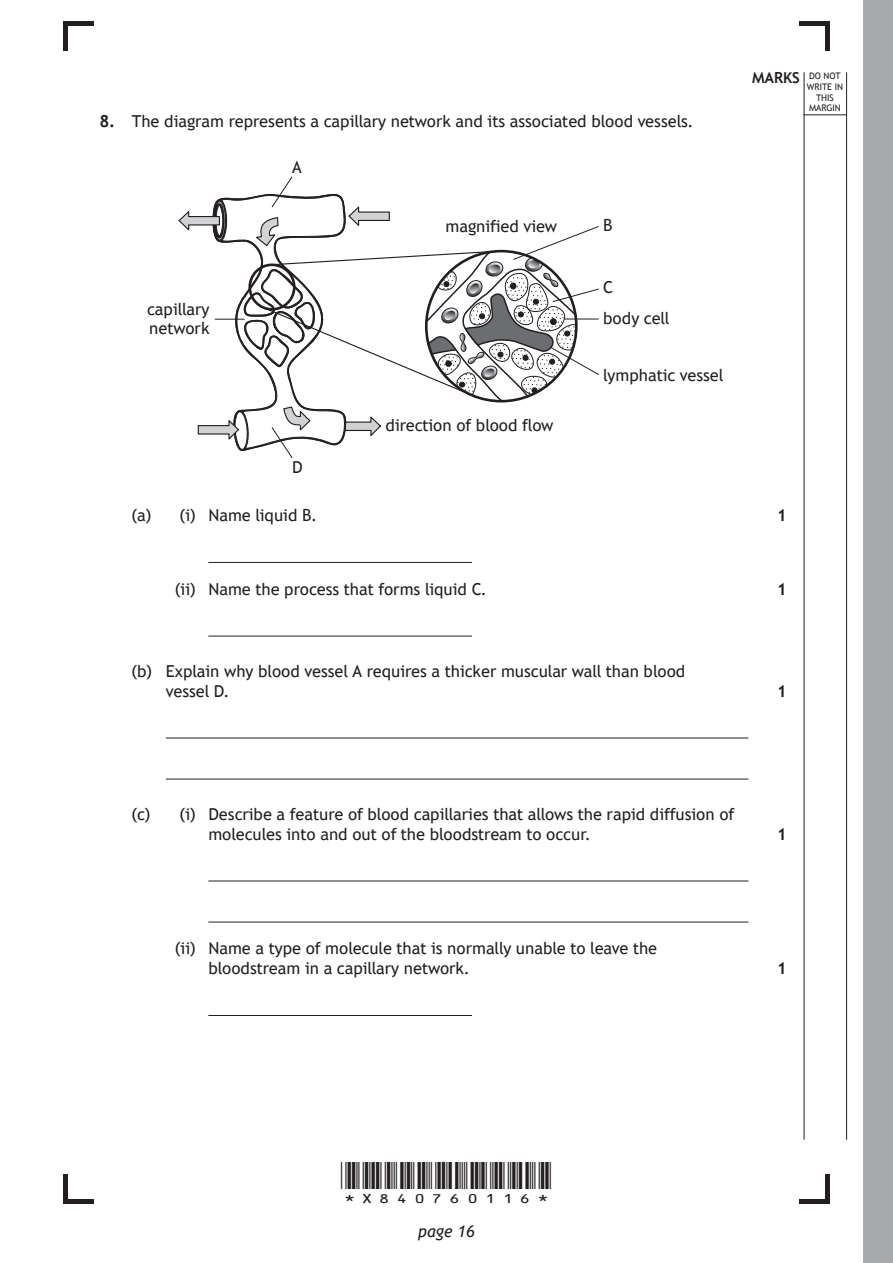
Selectable page text
MARKS DO NOT
                                                                 WRITE IN
                                                                  THIS
                                                                 MARGIN
8. The diagram represents a capillary network and its associated blood vessels.
                  A

                                magnified view B

                                              C
     capillary
                                              body cell
     network

                                              lymphatic vessel

                          direction of blood flow

                  D

   (a)  (i) Name liquid B.                                    1

       (ii) Name the process that forms liquid C.             1

   (b) Explain why blood vessel A requires a thicker muscular wall than blood
      vessel D.                                               1

   (c)  (i) Describe a feature of blood capillaries that allows the rapid diffusion of
          molecules into and out of the bloodstream to occur. 1

       (ii) Name a type of molecule that is normally unable to leave the
          bloodstream in a capillary network.                 1

                      *X840760116*

                             page 16
PDF page 17

Selectable page text
MARKS DO NOT
                                                                 WRITE IN
                                                                  THIS
                                                                 MARGIN
8. (continued)
   (d)  (i) Describe the function of the lymphatic vessel shown in the diagram. 1

       (ii) Suggest a reason why lymphatic vessels contain valves. 1

                                                     [Turn over

                      *X840760117*

                             page 17
PDF page 18
Question 9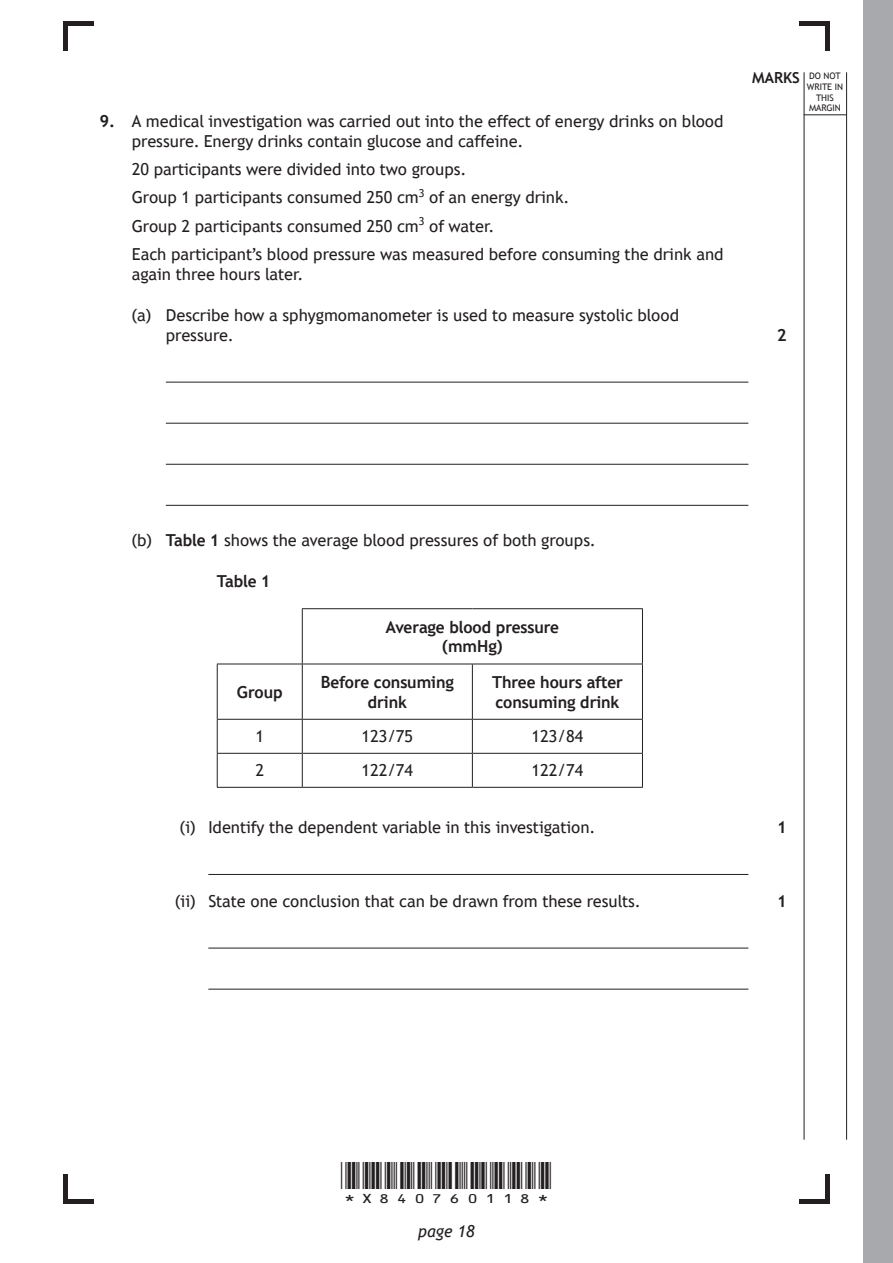
Selectable page text
MARKS DO NOT
                                                                 WRITE IN
                                                                  THIS
                                                                 MARGIN
9. A medical investigation was carried out into the effect of energy drinks on blood
   pressure. Energy drinks contain glucose and caffeine.
   20 participants were divided into two groups.
   Group 1 participants consumed 250 cm3 of an energy drink.
   Group 2 participants consumed 250 cm3 of water.
   Each participant’s blood pressure was measured before consuming the drink and
   again three hours later.

   (a) Describe how a sphygmomanometer is used to measure systolic blood
      pressure.                                               2

   (b) Table 1 shows the average blood pressures of both groups.

           Table 1

                          Average blood pressure
                                (mmHg)

                    Before consuming Three hours after
             Group
                         drink       consuming drink
              1         123/75          123/84
              2         122/74          122/74

        (i) Identify the dependent variable in this investigation. 1

       (ii) State one conclusion that can be drawn from these results. 1

                      *X840760118*

                             page 18
PDF page 19
Selectable page text
MARKS DO NOT
WRITE IN
THIS
MARGIN
9. (b) (continued)
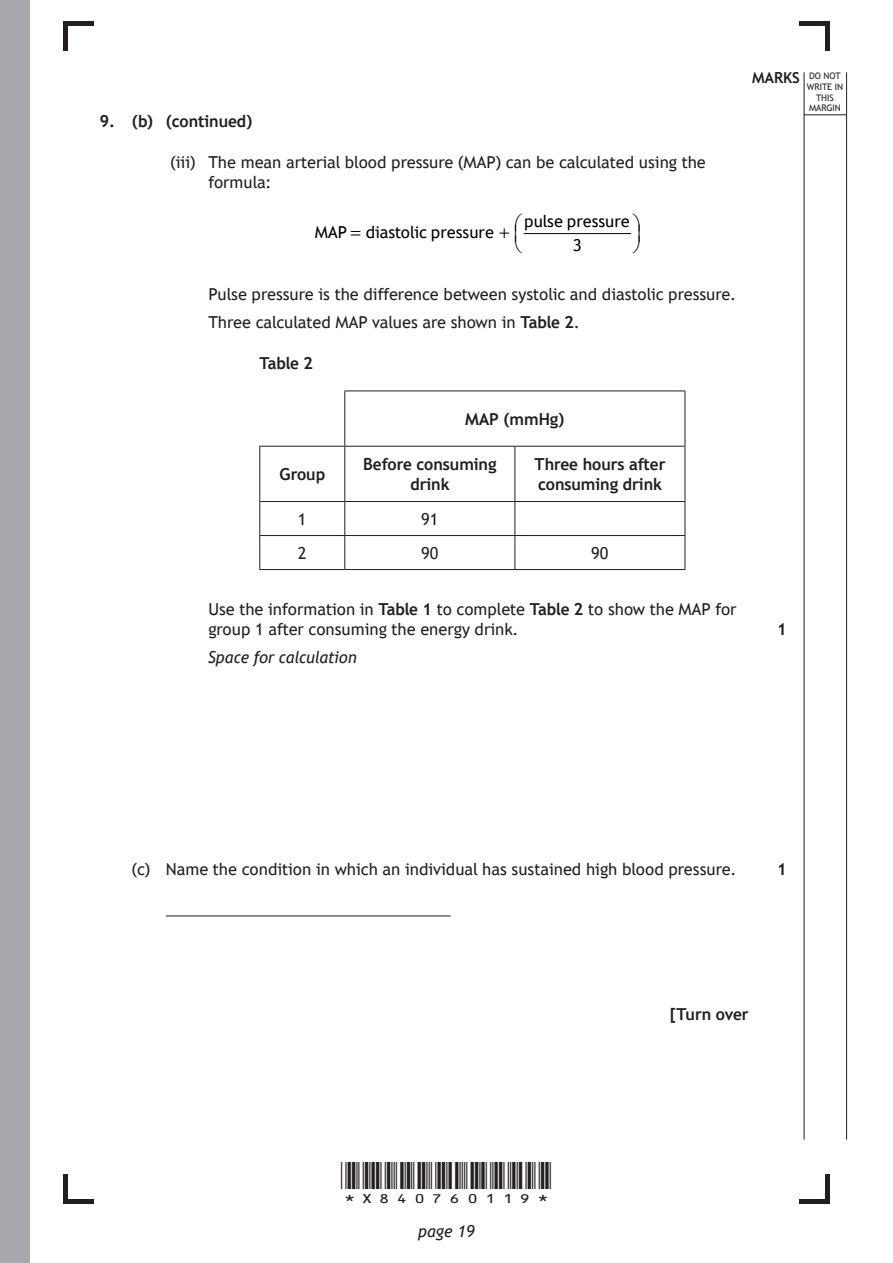
(iii) The mean arterial blood pressure (MAP) can be calculated using the
formula:
pulsepressure
MAP= diastolicpressure +
3
Pulse pressure is the difference between systolic and diastolic pressure.
Three calculated MAP values are shown in Table 2.
Table 2
MAP (mmHg)
Before consuming Three hours after
Group
drink consuming drink
1 91
2 90 90
Use the information in Table 1 to complete Table 2 to show the MAP for
group 1 after consuming the energy drink. 1
Space for calculation
(c) Name the condition in which an individual has sustained high blood pressure. 1
[Turn over
*X840760119*
page 19PDF page 20
Question 10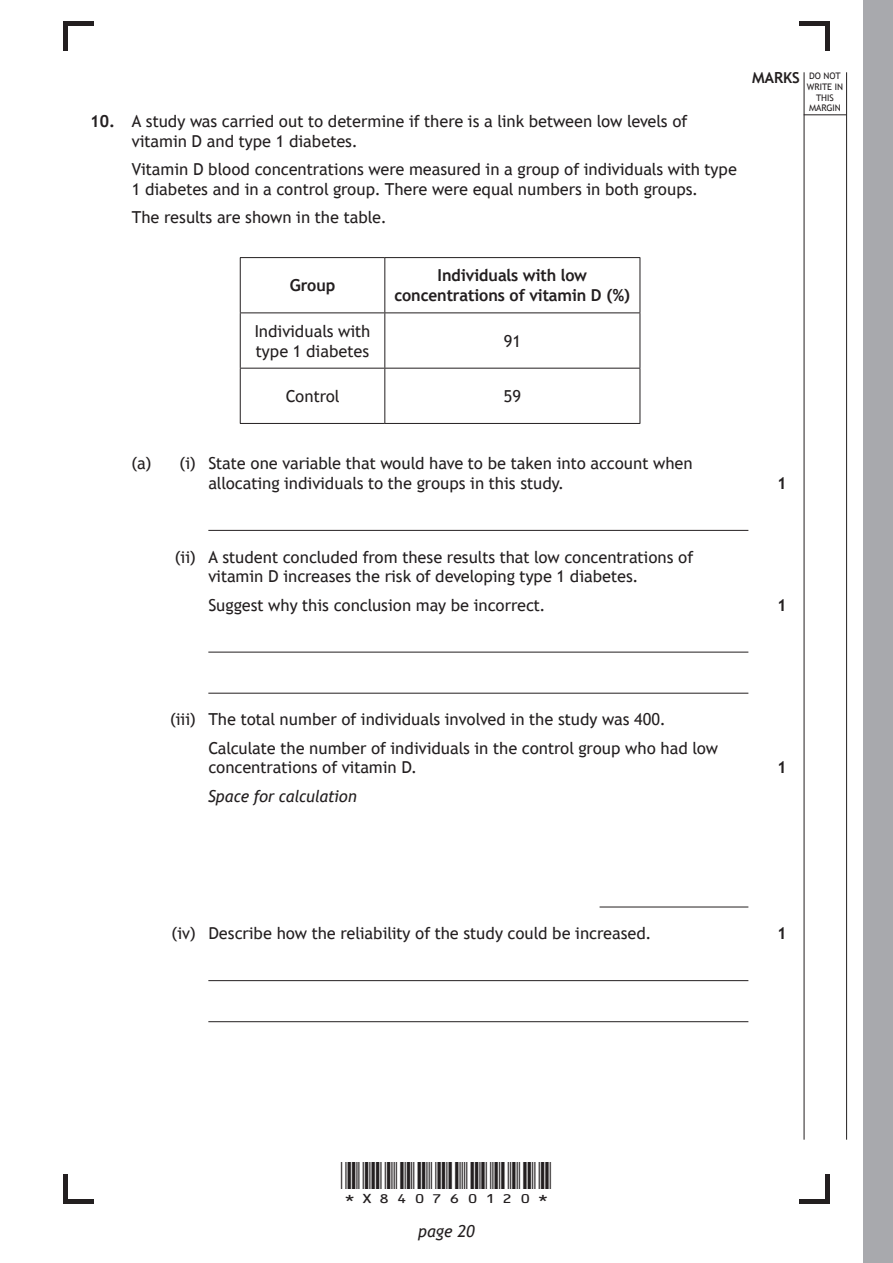
Selectable page text
MARKS DO NOT
                                                                  WRITE IN
                                                                   THIS
                                                                  MARGIN
10. A study was carried out to determine if there is a link between low levels of
    vitamin D and type 1 diabetes.
    Vitamin D blood concentrations were measured in a group of individuals with type
    1 diabetes and in a control group. There were equal numbers in both groups.
    The results are shown in the table.

                                Individuals with low
                   Group
                            concentrations of vitamin D (%)
               Individuals with
                                      91
                type 1 diabetes
                  Control             59

    (a)  (i) State one variable that would have to be taken into account when
           allocating individuals to the groups in this study. 1

        (ii) A student concluded from these results that low concentrations of
           vitamin D increases the risk of developing type 1 diabetes.

           Suggest why this conclusion may be incorrect.       1

        (iii) The total number of individuals involved in the study was 400.
           Calculate the number of individuals in the control group who had low
           concentrations of vitamin D.                        1
           Space for calculation

        (iv) Describe how the reliability of the study could be increased. 1

                       *X840760120*

                              page 20
PDF page 21
Selectable page text
MARKS DO NOT
                                                                  WRITE IN
                                                                   THIS
                                                                  MARGIN
10. (continued)
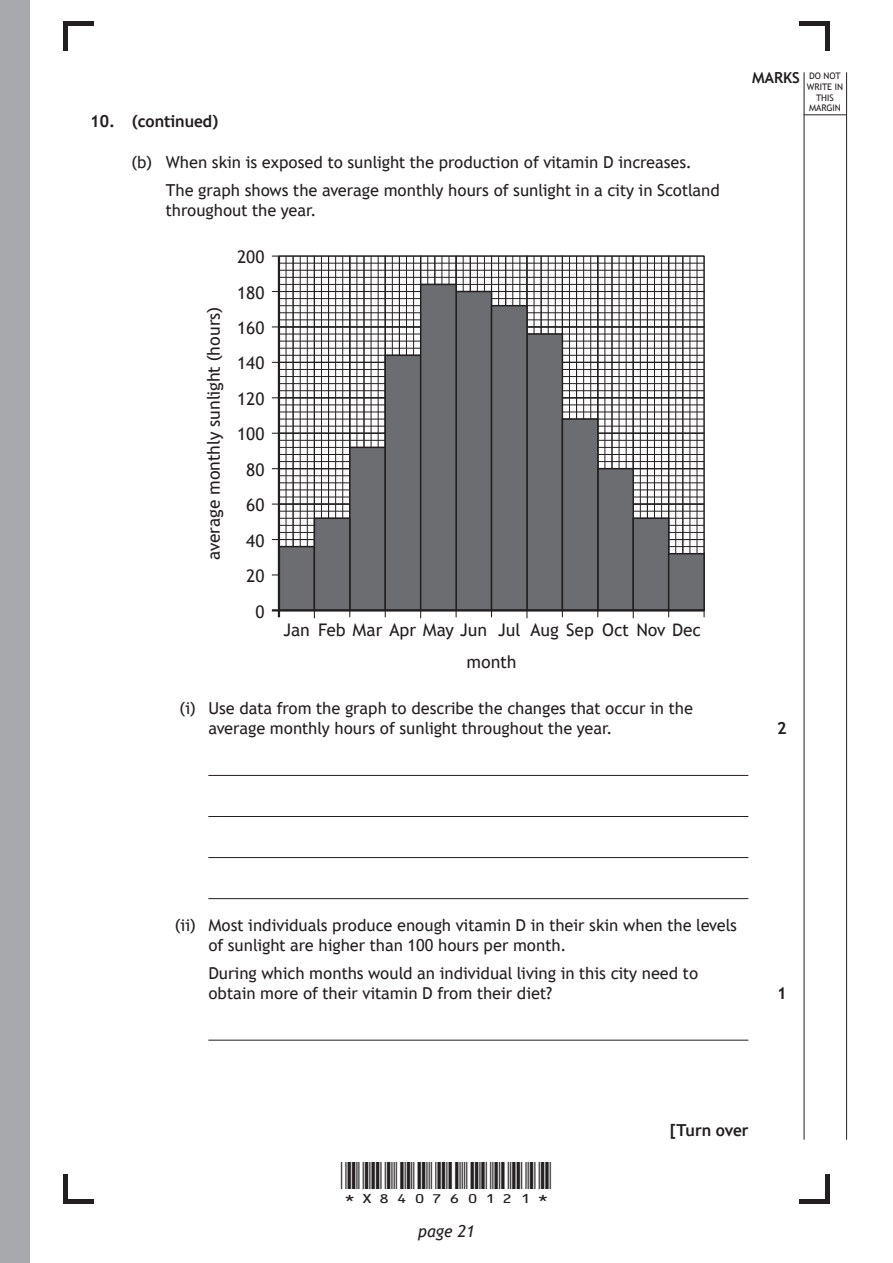
    (b) When skin is exposed to sunlight the production of vitamin D increases.
       The graph shows the average monthly hours of sunlight in a city in Scotland
       throughout the year.

              200

              180
              160

              140

              120

              100

               80

               60
               40

               20

               0

                       *X840760121*

                              page 21
           )sruoh(
           thgilnus
           ylhtnom
           egareva
                  Jan Feb Mar Apr May Jun Jul Aug Sep Oct Nov Dec
                                   month
         (i) Use data from the graph to describe the changes that occur in the
           average monthly hours of sunlight throughout the year. 2
        (ii) Most individuals produce enough vitamin D in their skin when the levels
           of sunlight are higher than 100 hours per month.
           During which months would an individual living in this city need to
           obtain more of their vitamin D from their diet?     1
                                                      [Turn over
PDF page 22
Question 11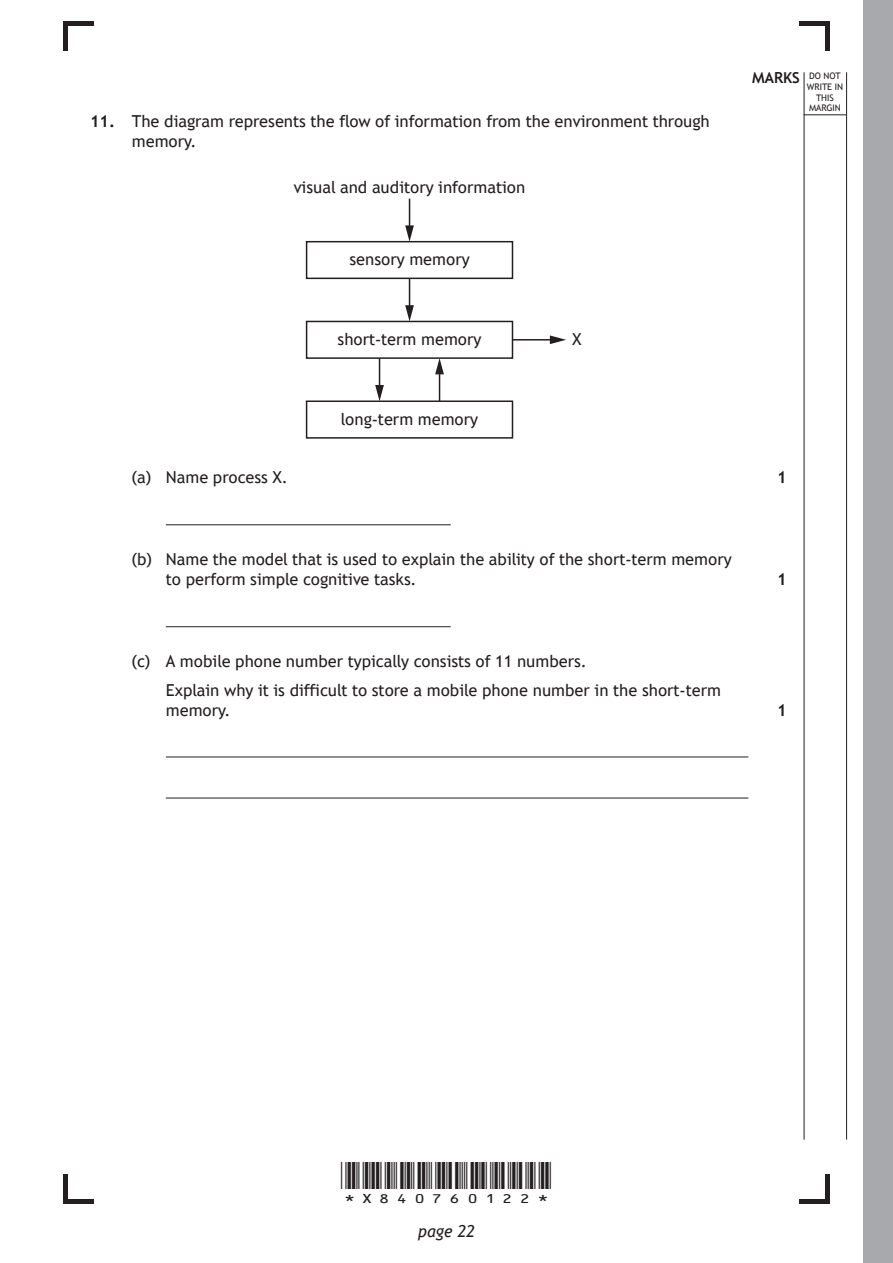
Selectable page text
MARKS DO NOT
                                                                  WRITE IN
                                                                   THIS
                                                                  MARGIN
11. The diagram represents the flow of information from the environment through
    memory.
                   visual and auditory information

                        sensory memory

                       short-term memory     X

                       long-term memory

    (a) Name process X.                                        1

    (b) Name the model that is used to explain the ability of the short-term memory
       to perform simple cognitive tasks.                      1

    (c) A mobile phone number typically consists of 11 numbers.
       Explain why it is difficult to store a mobile phone number in the short-term
       memory.                                                 1

                       *X840760122*

                              page 22
PDF page 23

Selectable page text
MARKS DO NOT
                                                                  WRITE IN
                                                                   THIS
                                                                  MARGIN
11. (continued)
    (d) In an investigation into the recall of information from long term memory, a
       large group of students was divided into two sub-groups.
       The students were then given a list of 20 words to memorise in one minute.
       Group 1 was given a list of the words arranged into four different categories.
       Group 2 was given a list that contained the same words but in a random order.

       Five minutes later the students had to write down all the words they could
       recall from the list.
         (i) Suggest a method that could be used to randomly allocate the students

           to each sub-group.                                  1

        (ii) Explain why students in group 1 recalled more words than students in
           group 2.                                            1

    (e) Recalling the events that occurred when information was encoded into long
       term memory can help the later retrieval of the information.
       Name the term that is used to describe these events.    1

                                                      [Turn over

                       *X840760123*

                              page 23
PDF page 24
Question 12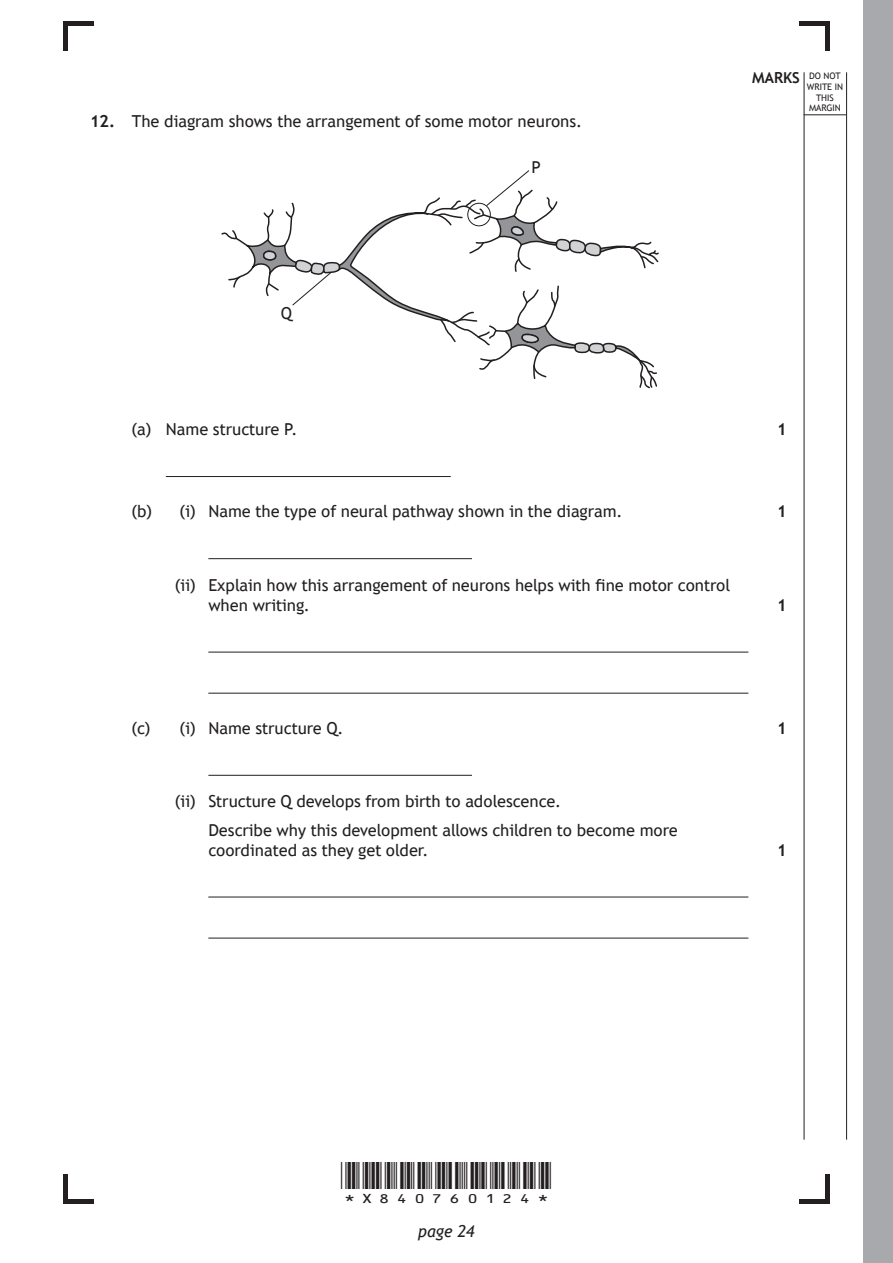
Selectable page text
MARKS DO NOT
                                                                  WRITE IN
                                                                   THIS
                                                                  MARGIN
12. The diagram shows the arrangement of some motor neurons.
                                         P

                  Q

    (a) Name structure P.                                      1

    (b)  (i) Name the type of neural pathway shown in the diagram. 1

        (ii) Explain how this arrangement of neurons helps with fine motor control
           when writing.                                       1

    (c)  (i) Name structure Q.                                 1

        (ii) Structure Q develops from birth to adolescence.
           Describe why this development allows children to become more
           coordinated as they get older.                      1

                       *X840760124*

                              page 24
PDF page 25
Selectable page text
MARKS DO NOT
                                                                  WRITE IN
                                                                   THIS
                                                                  MARGIN
12. (continued)
    (d)  (i) Myasthenia gravis is a disease where the neurotransmitter receptors on
           skeletal muscles are destroyed.
           Suggest how this results in problems with movement. 1

        (ii) Myasthenia gravis is an autoimmune disease.

           Describe the immune response that results in an autoimmune disease. 2

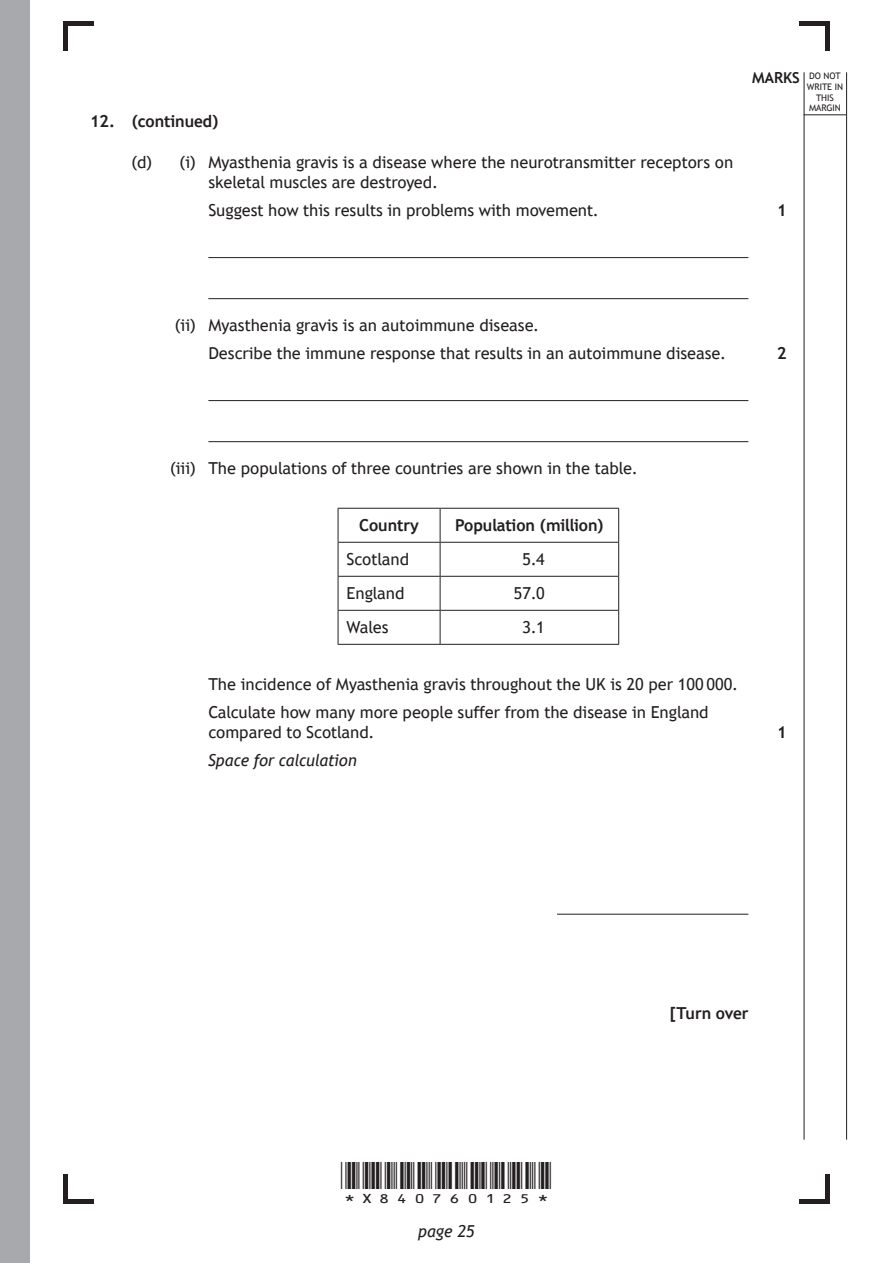
        (iii) The populations of three countries are shown in the table.

                         Country  Population (million)
                        Scotland        5.4

                        England        57.0

                        Wales           3.1

           The incidence of Myasthenia gravis throughout the UK is 20 per 100 000.
           Calculate how many more people suffer from the disease in England
           compared to Scotland.                               1

           Space for calculation

                                                      [Turn over

                       *X840760125*

                              page 25
PDF page 26
Question 13
Selectable page text
MARKS DO NOT
                                                                  WRITE IN
                                                                   THIS
                                                                  MARGIN
13. B lymphocytes form part of the specific immune system.
    (a) Describe the mechanism of action of B lymphocytes against pathogens. 3

    (b) The specific immune system can respond to substances that are harmless to
       the body.

       State the term used for this response.                  1

                       *X840760126*

                              page 26
PDF page 27
Question 14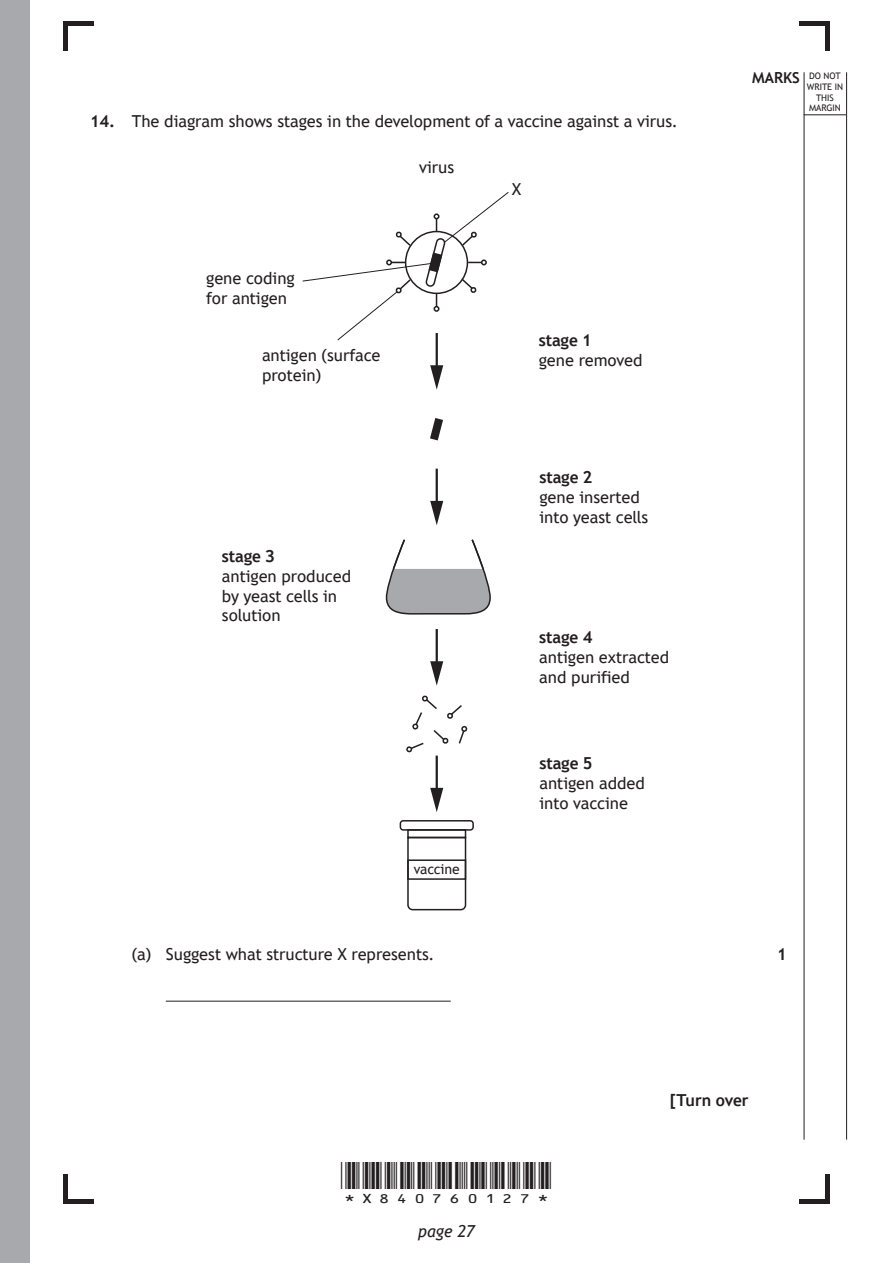
Selectable page text
MARKS DO NOT
                                                                  WRITE IN
                                                                   THIS
                                                                  MARGIN
14. The diagram shows stages in the development of a vaccine against a virus.
                               virus
                                       X

           gene coding
           for antigen

                                          stage 1
                antigen (surface          gene removed
                protein)

                                          stage 2
                                          gene inserted
                                          into yeast cells

            stage 3
            antigen produced
            by yeast cells in
            solution
                                          stage 4
                                          antigen extracted
                                          and purified

                                          stage 5
                                          antigen added
                                          into vaccine

                              vaccine

    (a) Suggest what structure X represents.                   1

                                                      [Turn over

                       *X840760127*

                              page 27
PDF page 28
Selectable page text
MARKS DO NOT
                                                                  WRITE IN
                                                                   THIS
                                                                  MARGIN
14. (continued)
    (b) The development of this vaccine involves using part of the virus as an antigen.
       State another source of antigens that can be used to produce vaccines. 1

    (c)  (i) Explain why new vaccines must be subjected to clinical trials before
           being licensed for use.                             1

        (ii) Describe how a double-blind procedure prevents a biased interpretation
           of the results from a clinical trial.               1

    (d) A new influenza vaccine is developed every year.
       Explain why this is required to protect the body from the influenza virus. 2

                       *X840760128*

                              page 28
PDF page 29
Question 15
Selectable page text
MARKS DO NOT
                                                                  WRITE IN
                                                                   THIS
                                                                  MARGIN
15. Attempt either A or B.
    Write your answer in the space below and on page 30.
    A  Write notes on somatic and germline cells, including cell divison in both these
       cell types.                                             8

    OR

    B  Write notes on the production of the primary and mature mRNA transcripts. 8

    You may use labelled diagrams where appropriate.

                       *X840760129*

                              page 29                 [Turn over
PDF page 30

Selectable page text
MARKS DO NOT
                                                    WRITE IN
                                                     THIS
                                                    MARGIN
ADDITIONAL SPACE FOR ANSWER to question 15

          [END OF QUESTION PAPER]

         *X840760130*

                page 30
PDF page 31
Selectable page text
MARKS DO NOT
                                                                  WRITE IN
                                                                   THIS
                                                                  MARGIN
            ADDITIONAL SPACE FOR ANSWERS AND ROUGH WORK
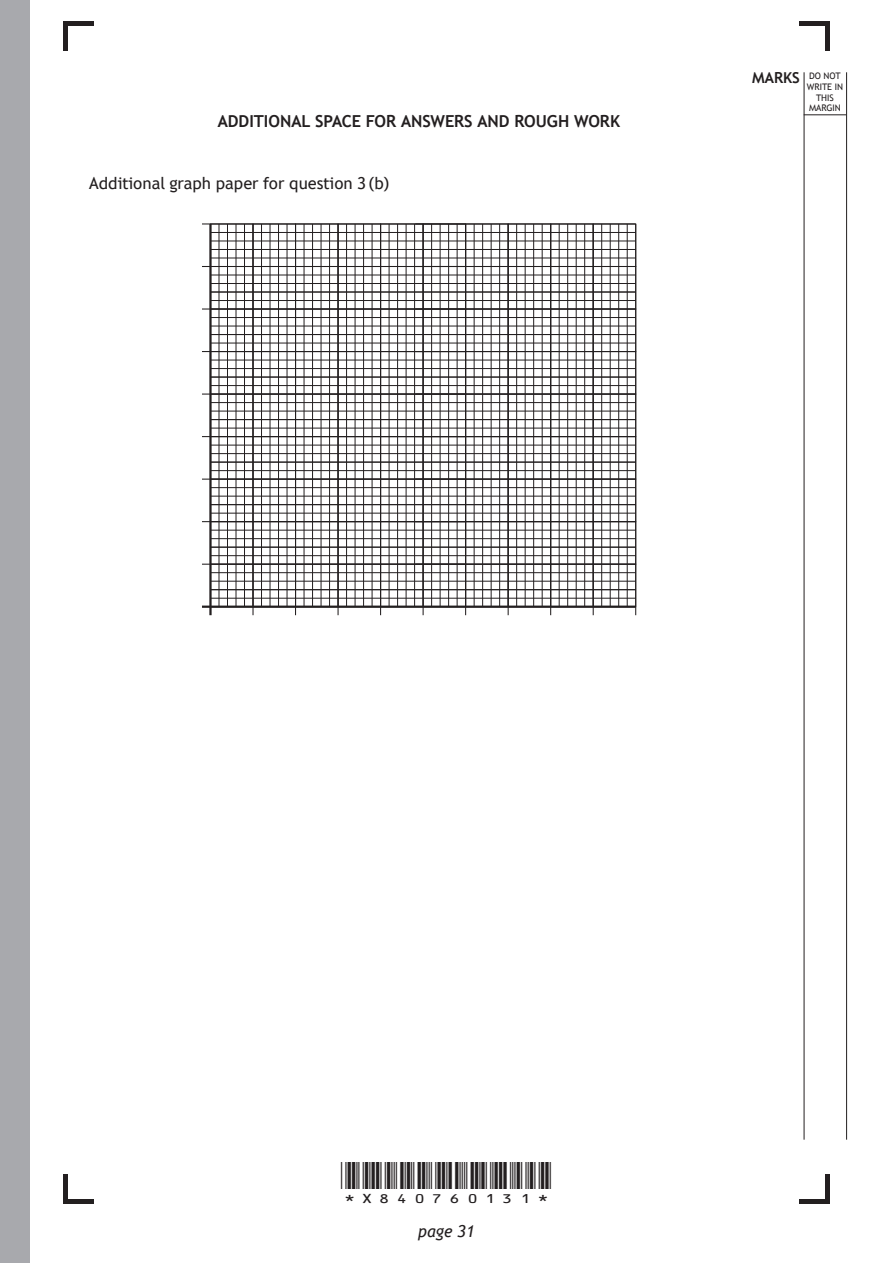
Additional graph paper for question 3 (b)

                       *X840760131*

                              page 31
PDF page 32

Selectable page text
MARKS DO NOT
                                                      WRITE IN
                                                       THIS
                                                      MARGIN
ADDITIONAL SPACE FOR ANSWERS AND ROUGH WORK

           *X840760132*

                  page 32
PDF page 33

Selectable page text
MARKS DO NOT
                                                      WRITE IN
                                                       THIS
                                                      MARGIN
ADDITIONAL SPACE FOR ANSWERS AND ROUGH WORK

           *X840760133*

                  page 33
PDF page 34

Selectable page text
[BLANK PAGE]

DO NOT WRITE ON THIS PAGE

*X840760134*

       page 34
PDF page 35

Selectable page text
[BLANK PAGE]

DO NOT WRITE ON THIS PAGE

*X840760135*

       page 35
PDF page 36

Selectable page text
[BLANK PAGE]

DO NOT WRITE ON THIS PAGE

*X840760136*

       page 36