2026 Higher Human Biology - Paper 1 questions
Source: Scottish Qualifications Authority (SQA) / Qualifications Scotland. This is a StemInteract HTML companion, not an official HTML edition. Extracted text is supplied alongside unaltered page images; use the images or original PDF for table layout, diagrams and symbols.
Jump to a question
PDF page 1
Selectable page text
H
National
Qualications
2026
X840/76/12 Human Biology
Paper 1 — Multiple choice
TUESDAY, 28 APRIL
9:00 AM – 9:40 AM
Total marks — 25
Attempt ALL questions.
You may use a calculator.
Instructions for the completion of Paper 1 are given on page 02 of your answer booklet
X840/76/02.
Record your answers on the answer grid on page 03 of your answer booklet.
Space for rough work is provided at the end of this booklet.
You must leave your answer booklet on your desk; if you do not, you could lose all the marks for
this paper.
*X8407612*
A/PB
© Qualifications Scotland 2026PDF page 2
Question 1Question 2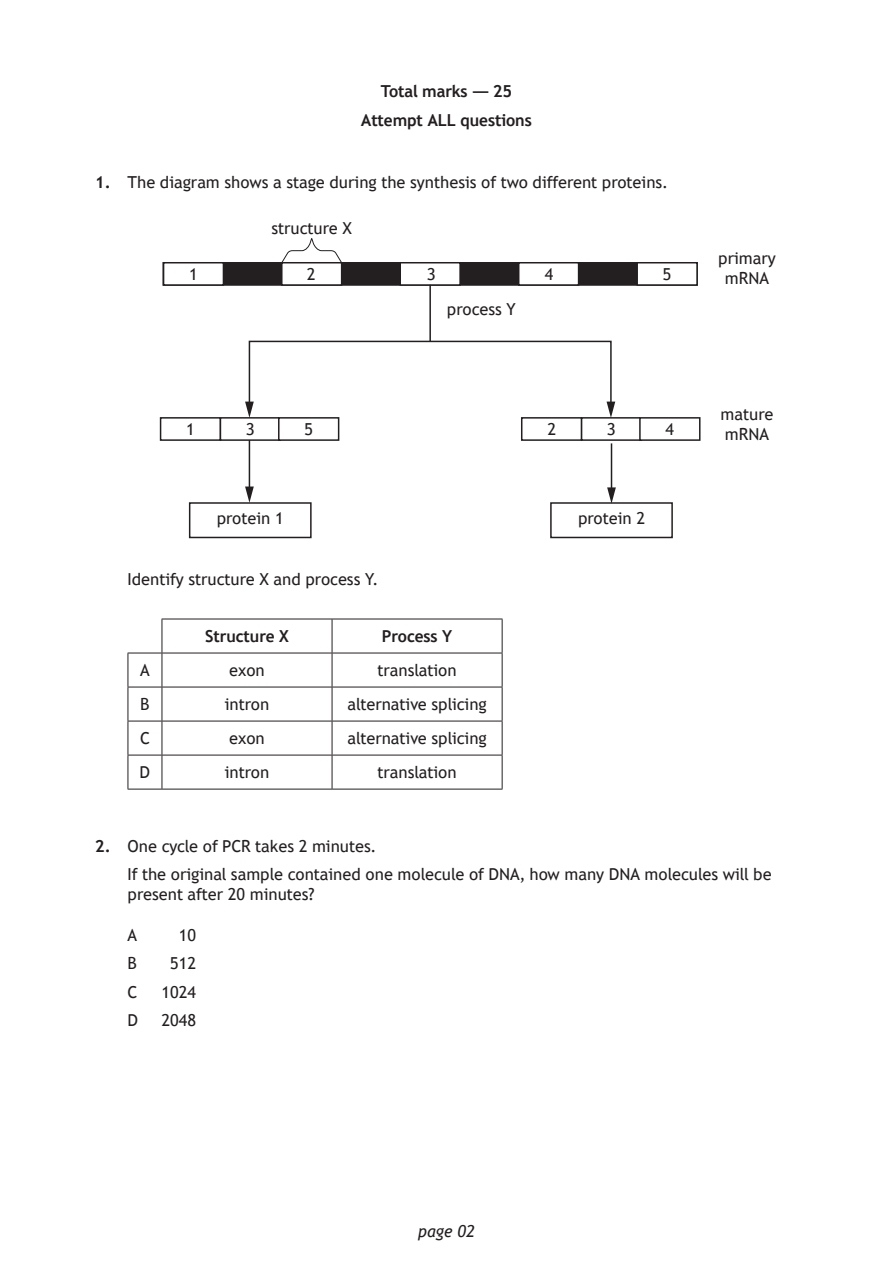
Selectable page text
Total marks — 25

                        Attempt ALL questions

1. The diagram shows a stage during the synthesis of two different proteins.

                structure X

                                                         primary
        1          2          3          4          5     mRNA

                                process Y

                                                         mature
        1     3    5                     2     3    4
                                                          mRNA

           protein 1                        protein 2

   Identify structure X and process Y.

          Structure X     Process Y

    A       exon          translation

    B       intron     alternative splicing

    C       exon       alternative splicing
    D       intron        translation

2. One cycle of PCR takes 2 minutes.
   If the original sample contained one molecule of DNA, how many DNA molecules will be

   present after 20 minutes?

   A   10
   B   512

   C  1024
   D  2048

                             page 02
PDF page 3
Question 3Question 4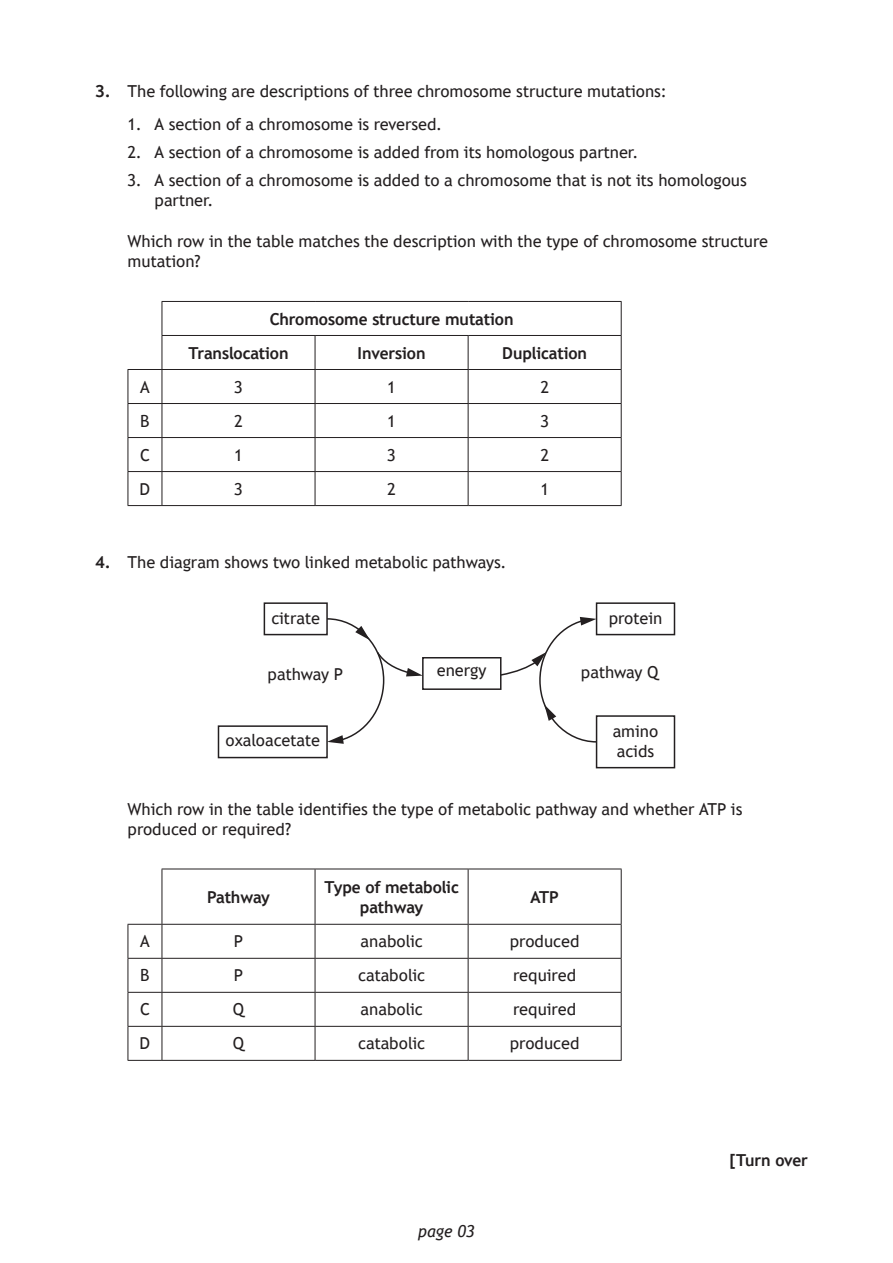
Selectable page text
3. The following are descriptions of three chromosome structure mutations:

   1. A section of a chromosome is reversed.
   2. A section of a chromosome is added from its homologous partner.

   3. A section of a chromosome is added to a chromosome that is not its homologous
     partner.

   Which row in the table matches the description with the type of chromosome structure
   mutation?

                Chromosome structure mutation

        Translocation   Inversion    Duplication
    A        3             1             2

    B        2             1             3

    C        1             3             2

    D        3             2             1

4. The diagram shows two linked metabolic pathways.

                citrate                        protein

                pathway P      energy       pathway Q

                                               amino
            oxaloacetate
                                                acids

   Which row in the table identifies the type of metabolic pathway and whether ATP is
   produced or required?

                     Type of metabolic
          Pathway                       ATP
                        pathway
    A        P          anabolic      produced

    B        P          catabolic     required
    C       Q           anabolic      required

    D       Q           catabolic     produced

                                                          [Turn over

                             page 03
PDF page 4
Question 5Question 6Question 7
Selectable page text
5. An investigation was carried out into the effect of substrate concentration on enzyme
   activity.

   Catalase is an enzyme that breaks down hydrogen peroxide to water and oxygen.
   Test tubes were set up containing 5 cm3 of hydrogen peroxide at different concentrations.

   Catalase was added to each test tube and the volume of oxygen produced was measured.
   Which row in the table identifies variables in this investigation?

        Independent variable Dependent variable Controlled variable

       concentration of hydrogen
    A                         enzyme activity    volume of oxygen
             peroxide
       concentration of hydrogen                volume of hydrogen
    B                         enzyme activity
             peroxide                               peroxide
                          concentration of hydrogen volume of hydrogen
    C     enzyme activity
                                peroxide            peroxide
                          concentration of hydrogen
    D     enzyme activity                        volume of oxygen
                                peroxide

6. An investigation into the effect of substrate concentration on enzyme activity showed that
   enzyme activity levelled off at high substrate concentrations.

   The explanation for this observation is that

   A  all the active sites are occupied
   B  no active sites are occupied

   C  the affinity of the active site has increased
   D  the affinity of the active site has decreased.

7. Three drops of iodine solution were added to a test tube containing 5 cm3 of starch
   suspension, turning the starch suspension blue/black. When 1 cm3 of enzyme amylase was
   added, the blue/black colour disappeared. It was concluded that the starch was broken
   down by the amylase.

   To show that the starch was broken down by the amylase, a control test tube would contain

   A  5 cm3 of distilled water, 3 drops of amylase and 1 cm3 of iodine solution
   B  5 cm3 of distilled water, 3 drops of iodine solution and 1 cm3 of amylase

   C  5 cm3 of starch suspension, 3 drops of distilled water and 1 cm3 of amylase
   D  5 cm3 of starch suspension, 3 drops of iodine solution and 1 cm3 of distilled water.

                             page 04
PDF page 5
Question 8Question 9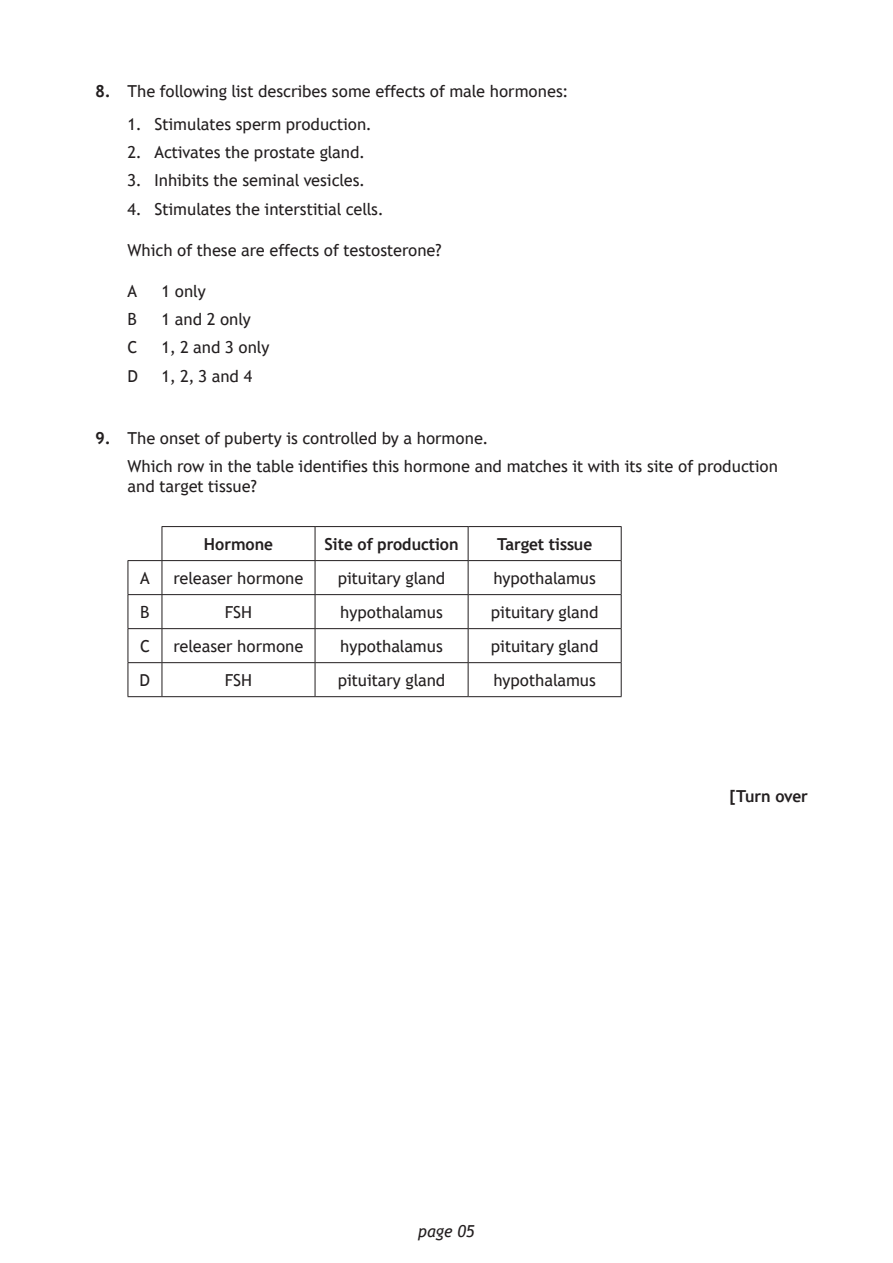
Selectable page text
8. The following list describes some effects of male hormones:

   1. Stimulates sperm production.
   2. Activates the prostate gland.

   3. Inhibits the seminal vesicles.
   4. Stimulates the interstitial cells.

   Which of these are effects of testosterone?

   A  1 only
   B  1 and 2 only
   C  1, 2 and 3 only

   D  1, 2, 3 and 4

9. The onset of puberty is controlled by a hormone.

   Which row in the table identifies this hormone and matches it with its site of production
   and target tissue?

          Hormone    Site of production Target tissue
    A  releaser hormone pituitary gland hypothalamus

    B       FSH       hypothalamus  pituitary gland

    C  releaser hormone hypothalamus pituitary gland

    D       FSH       pituitary gland hypothalamus

                                                          [Turn over

                             page 05
PDF page 6
Question 10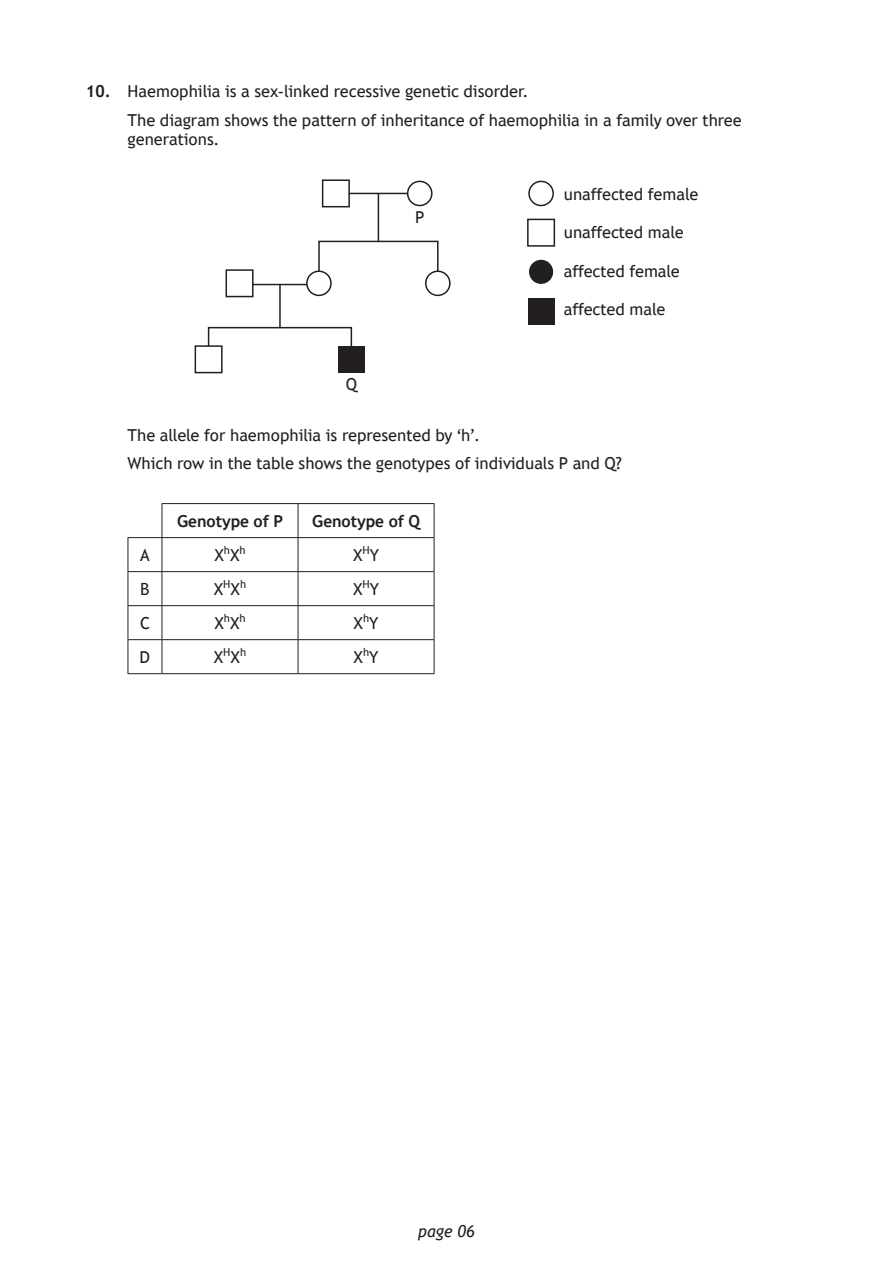
Selectable page text
10. Haemophilia is a sex‑linked recessive genetic disorder.

    The diagram shows the pattern of inheritance of haemophilia in a family over three
    generations.

                                            unaffected female
                              P
                                            unaffected male

                                            affected female

                                            affected male

                        Q

    The allele for haemophilia is represented by ‘h’.
    Which row in the table shows the genotypes of individuals P and Q?

        Genotype of P Genotype of Q

     A      XhXh        XHY

     B      XHXh        XHY

     C      XhXh         XhY
     D      XHXh         XhY

                              page 06
PDF page 7
Question 11Question 12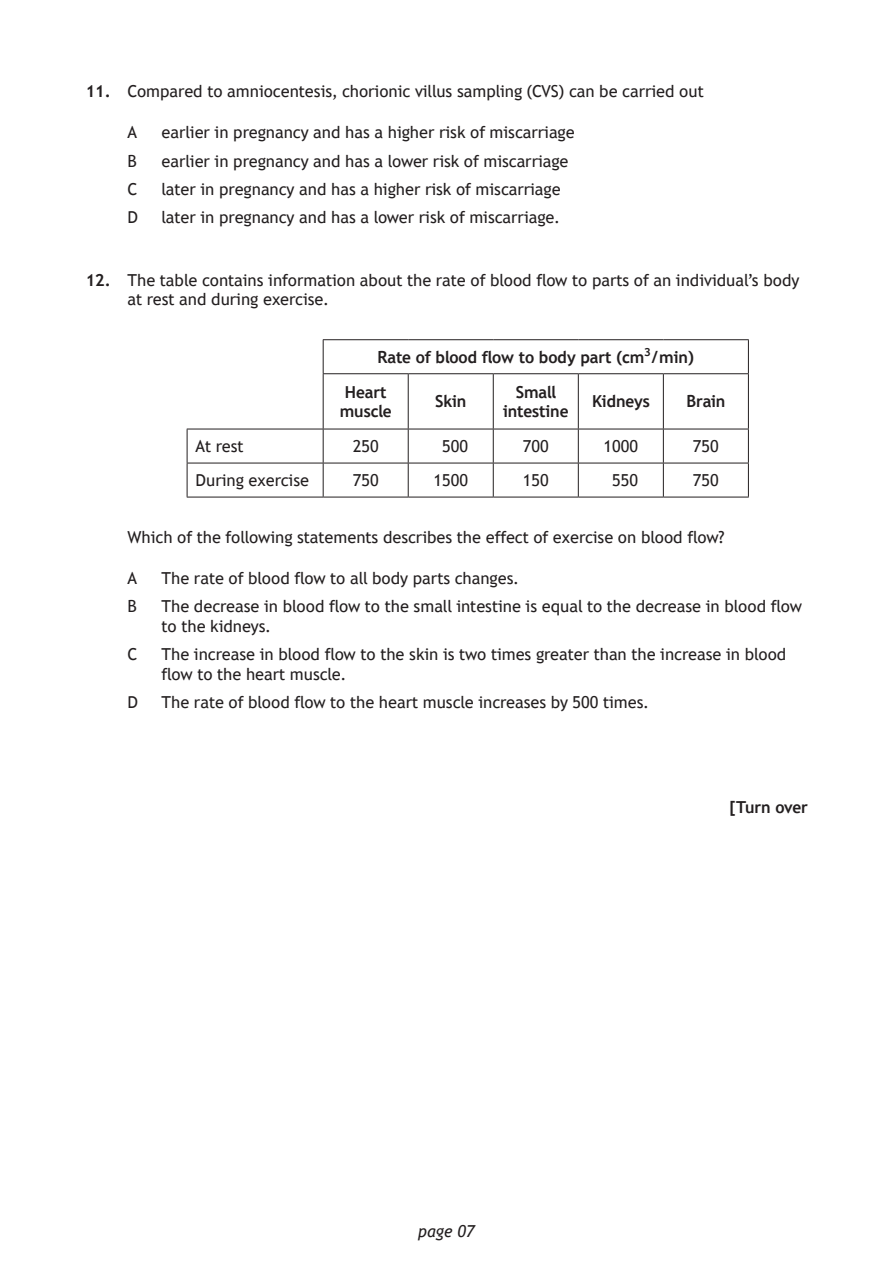
Selectable page text
11. Compared to amniocentesis, chorionic villus sampling (CVS) can be carried out

    A  earlier in pregnancy and has a higher risk of miscarriage

    B  earlier in pregnancy and has a lower risk of miscarriage
    C  later in pregnancy and has a higher risk of miscarriage

    D  later in pregnancy and has a lower risk of miscarriage.

12. The table contains information about the rate of blood flow to parts of an individual’s body
    at rest and during exercise.

                           Rate of blood flow to body part (cm3/min)

                        Heart          Small
                                Skin          Kidneys  Brain
                       muscle         intestine
          At rest       250      500    700    1000     750
          During exercise 750   1500    150     550     750

    Which of the following statements describes the effect of exercise on blood flow?

    A  The rate of blood flow to all body parts changes.

    B  The decrease in blood flow to the small intestine is equal to the decrease in blood flow
       to the kidneys.
    C  The increase in blood flow to the skin is two times greater than the increase in blood
       flow to the heart muscle.

    D  The rate of blood flow to the heart muscle increases by 500 times.

                                                           [Turn over

                              page 07
PDF page 8
Question 13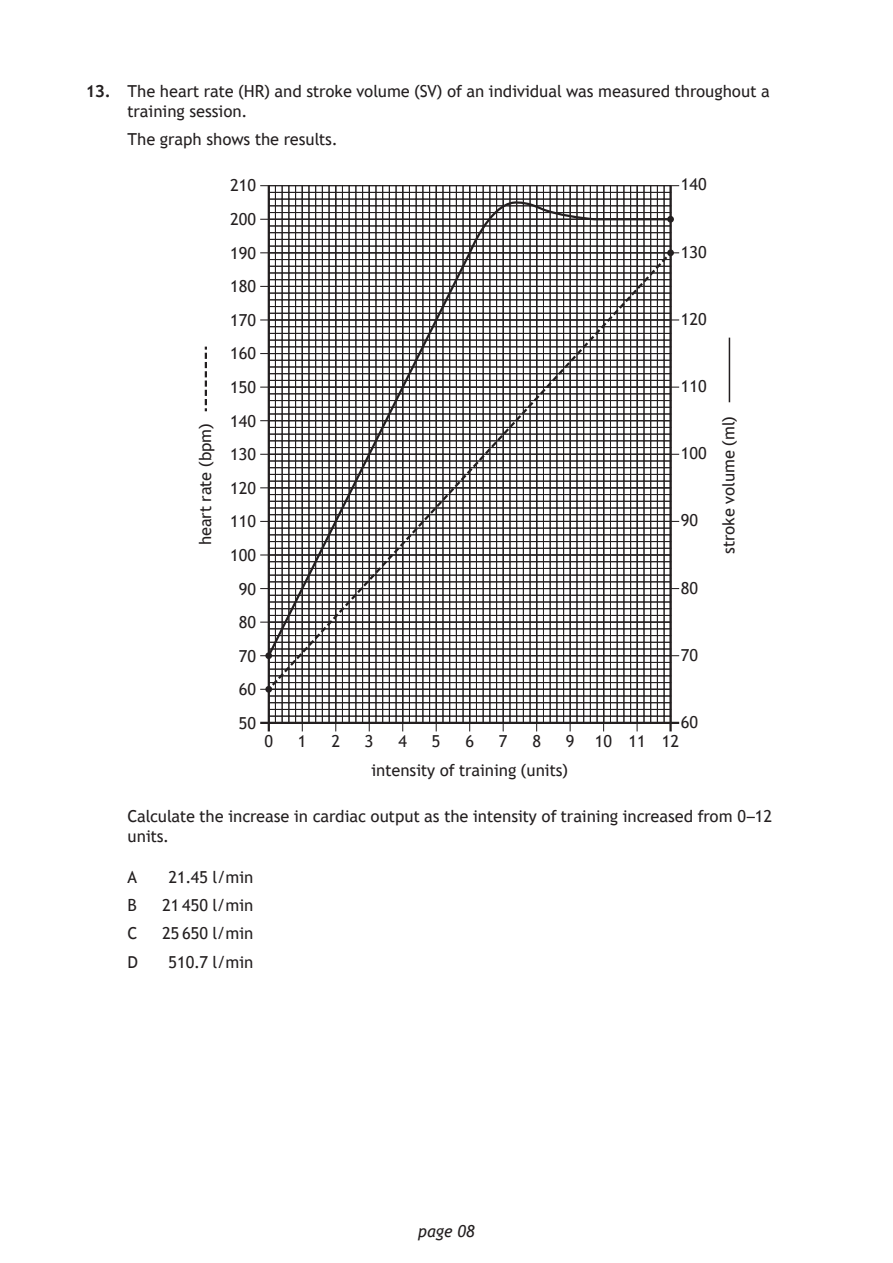
Selectable page text
13. The heart rate (HR) and stroke volume (SV) of an individual was measured throughout a
    training session.

    The graph shows the results.

             210                                       140

             200

             190                                       130
             180

             170                                       120

             160

             150                                       110
             140

             130                                       100

             120
             110                                       90

             100

              90                                       80

              80
              70                                       70

              60

              50                                       60

                              page 08
          )mpb(
          etar
          traeh
                                                          )lm(
                                                          emulov
                                                          ekorts
                0  1  2   3  4  5  6  7  8  9  10 11 12
                          intensity of training (units)
    Calculate the increase in cardiac output as the intensity of training increased from 0 –12
    units.
    A  21.45 l/min
    B  21 450 l/min
    C  25 650 l/min
    D  510.7 l/min
PDF page 9
Question 14Question 15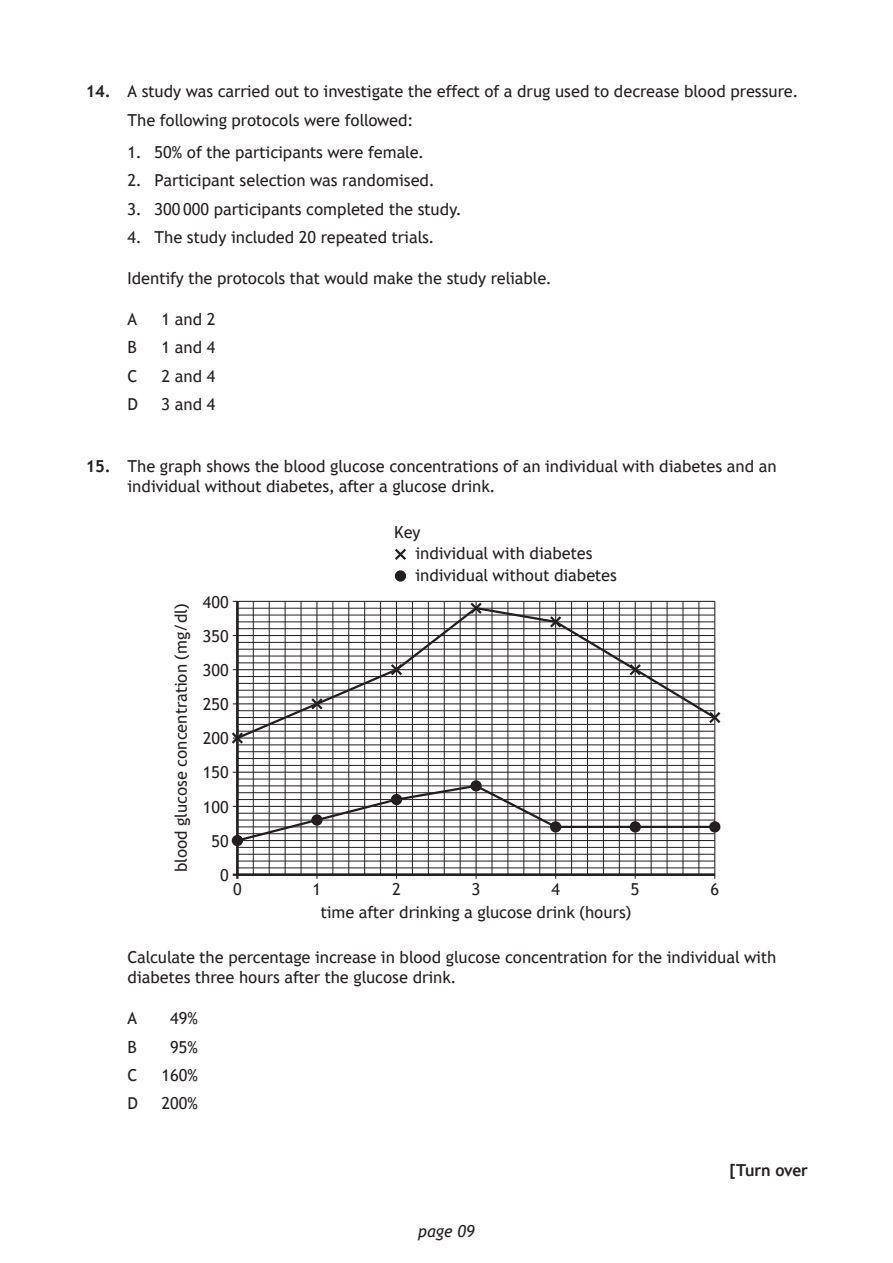
Selectable page text
14. A study was carried out to investigate the effect of a drug used to decrease blood pressure.

    The following protocols were followed:
    1. 50% of the participants were female.

    2. Participant selection was randomised.
    3. 300 000 participants completed the study.

    4. The study included 20 repeated trials.

    Identify the protocols that would make the study reliable.

    A  1 and 2
    B  1 and 4

    C  2 and 4
    D  3 and 4

15. The graph shows the blood glucose concentrations of an individual with diabetes and an
    individual without diabetes, after a glucose drink.

           400
           350

           300

           250

           200
           150

           100

           50

            0
             0       1      2      3       4      5      6
                     time after drinking a glucose drink (hours)

                              page 09
        )ld/gm(
        noitartnecnoc
        esoculg
        doolb
                            Key
                              individual with diabetes
                              individual without diabetes
    Calculate the percentage increase in blood glucose concentration for the individual with
    diabetes three hours after the glucose drink.
    A   49%
    B   95%
    C  160%
    D  200%
                                                           [Turn over
PDF page 10
Question 16Question 17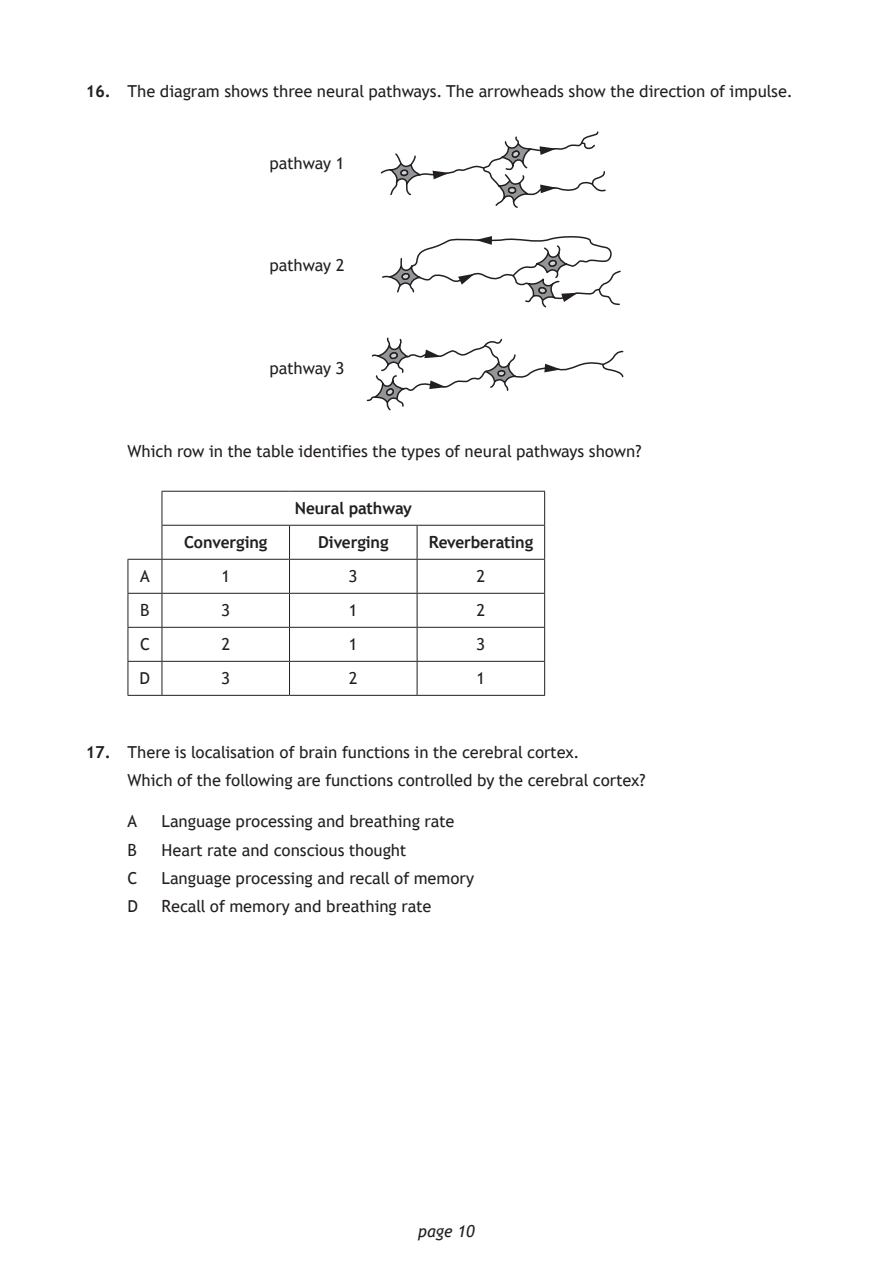
Selectable page text
16. The diagram shows three neural pathways. The arrowheads show the direction of impulse.

                 pathway 1

                 pathway 2

                 pathway 3

    Which row in the table identifies the types of neural pathways shown?

                   Neural pathway
         Converging  Diverging Reverberating

     A      1           3           2

     B      3           1           2

     C      2           1           3
     D      3           2           1

17. There is localisation of brain functions in the cerebral cortex.

    Which of the following are functions controlled by the cerebral cortex?

    A  Language processing and breathing rate
    B  Heart rate and conscious thought

    C  Language processing and recall of memory
    D  Recall of memory and breathing rate

                              page 10
PDF page 11
Question 18Question 19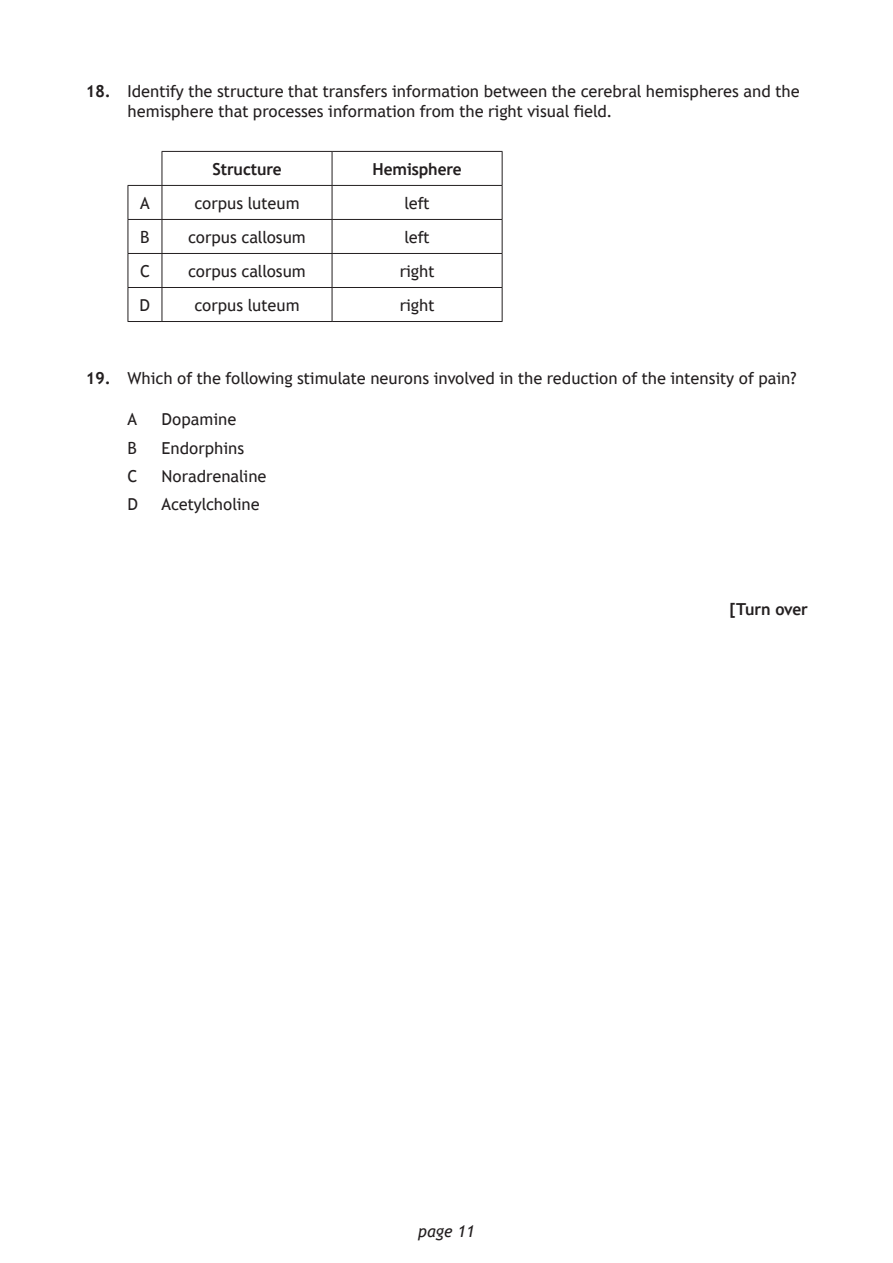
Selectable page text
18. Identify the structure that transfers information between the cerebral hemispheres and the
    hemisphere that processes information from the right visual field.

            Structure     Hemisphere

     A    corpus luteum      left

     B   corpus callosum     left

     C   corpus callosum     right
     D    corpus luteum      right

19. Which of the following stimulate neurons involved in the reduction of the intensity of pain?

    A  Dopamine

    B  Endorphins
    C  Noradrenaline

    D  Acetylcholine

                                                           [Turn over

                              page 11
PDF page 12
Question 20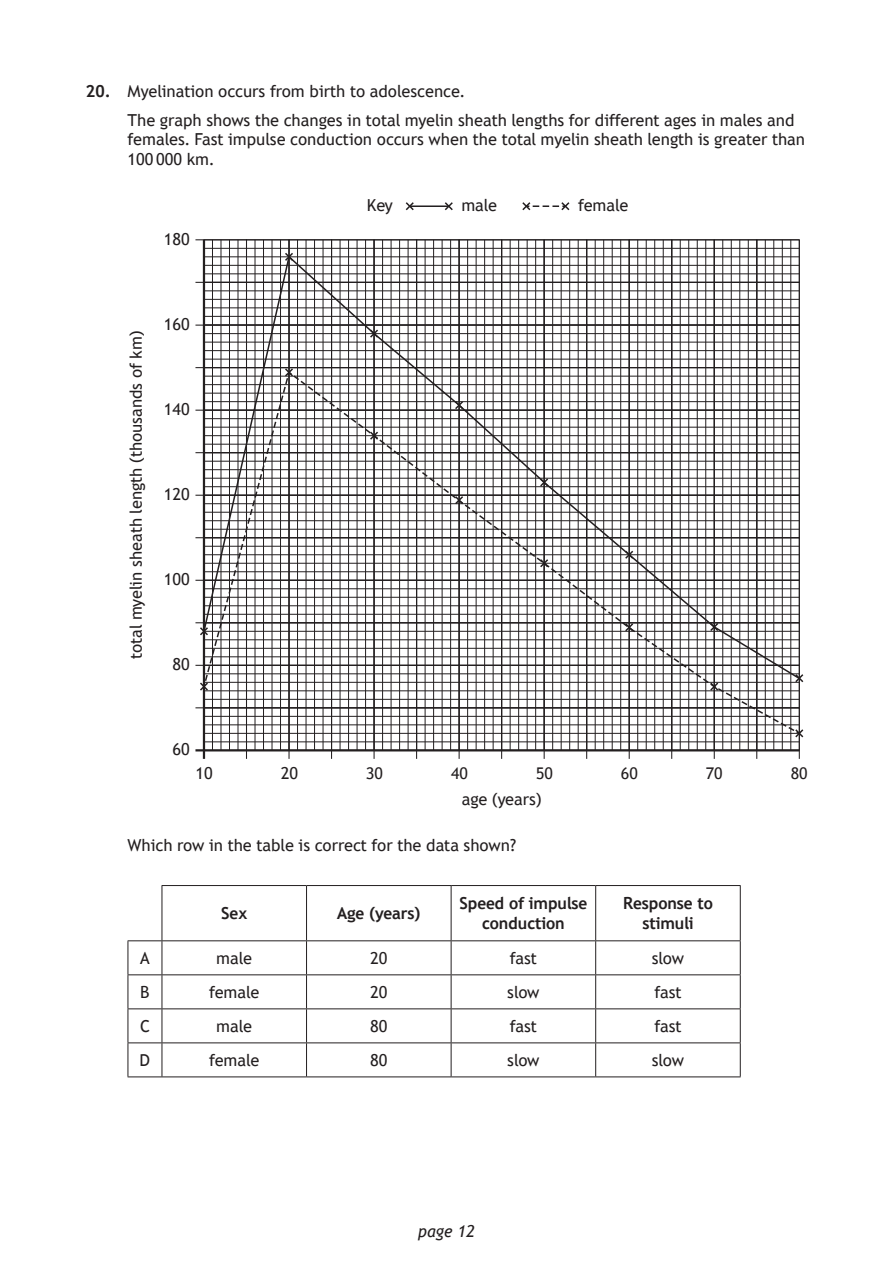
Selectable page text
20. Myelination occurs from birth to adolescence.

    The graph shows the changes in total myelin sheath lengths for different ages in males and
    females. Fast impulse conduction occurs when the total myelin sheath length is greater than
    100 000 km.

       180

       160

       140

       120

       100

        80

        60
          10      20      30     40      50      60      70      80

                                  age (years)

                              page 12
    )mk
    fo
    sdnasuoht(
    htgnel
    htaehs
    nileym
    latot
                          Key     male       female
    Which row in the table is correct for the data shown?
                                  Speed of impulse Response to
            Sex        Age (years)
                                    conduction     stimuli
     A      male          20           fast         slow
     B     female         20           slow         fast
     C      male          80           fast         fast
     D     female         80           slow         slow
PDF page 13
Question 21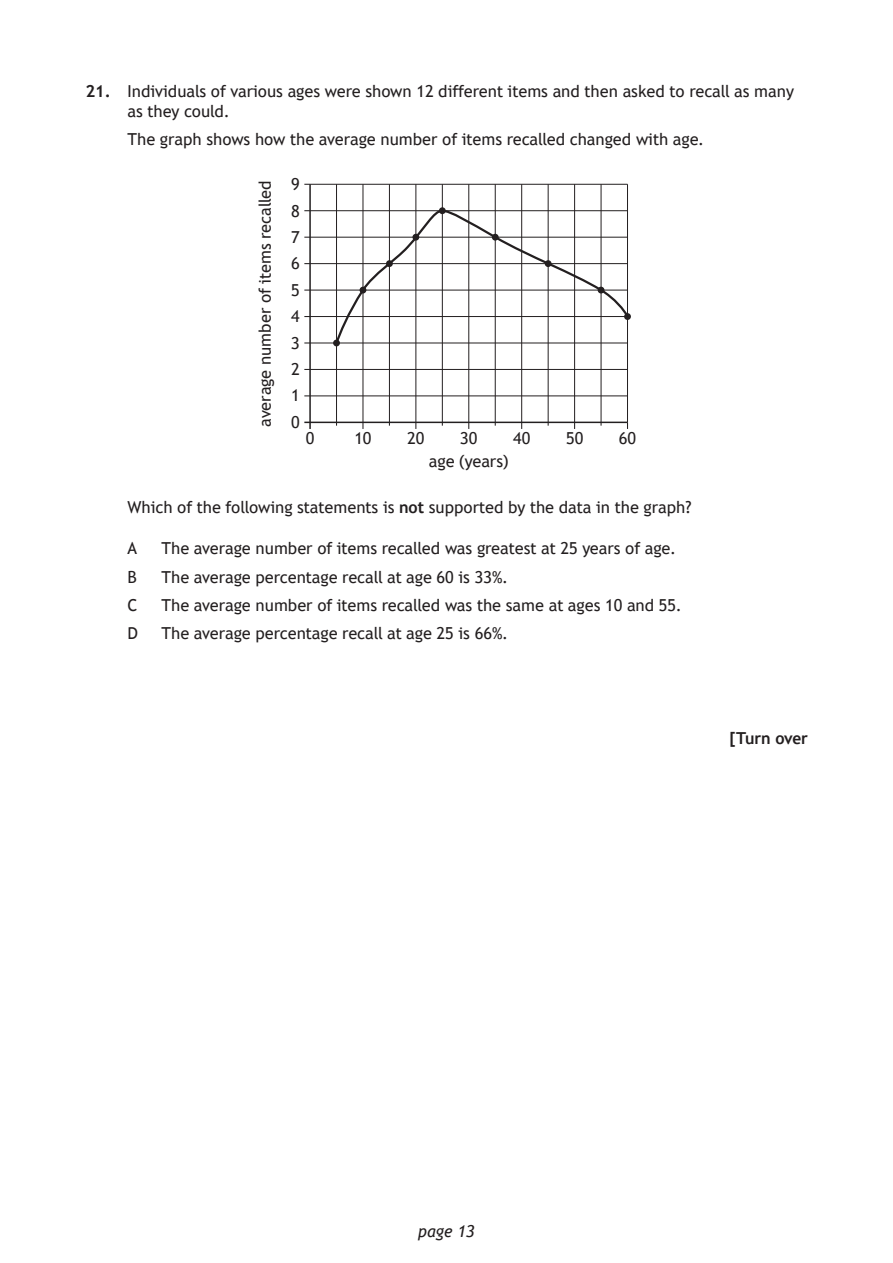
Selectable page text
21. Individuals of various ages were shown 12 different items and then asked to recall as many
    as they could.

    The graph shows how the average number of items recalled changed with age.

                               age (years)

                              page 13
                dellacer
                smeti
                fo
                rebmun
                egareva
                   9
                   8
                   7
                   6
                   5
                   4
                   3
                   2
                   1
                   0
                    0    10  20   30   40   50   60
    Which of the following statements is not supported by the data in the graph?
    A  The average number of items recalled was greatest at 25 years of age.
    B  The average percentage recall at age 60 is 33%.
    C  The average number of items recalled was the same at ages 10 and 55.
    D  The average percentage recall at age 25 is 66%.
                                                           [Turn over
PDF page 14
Question 22Question 23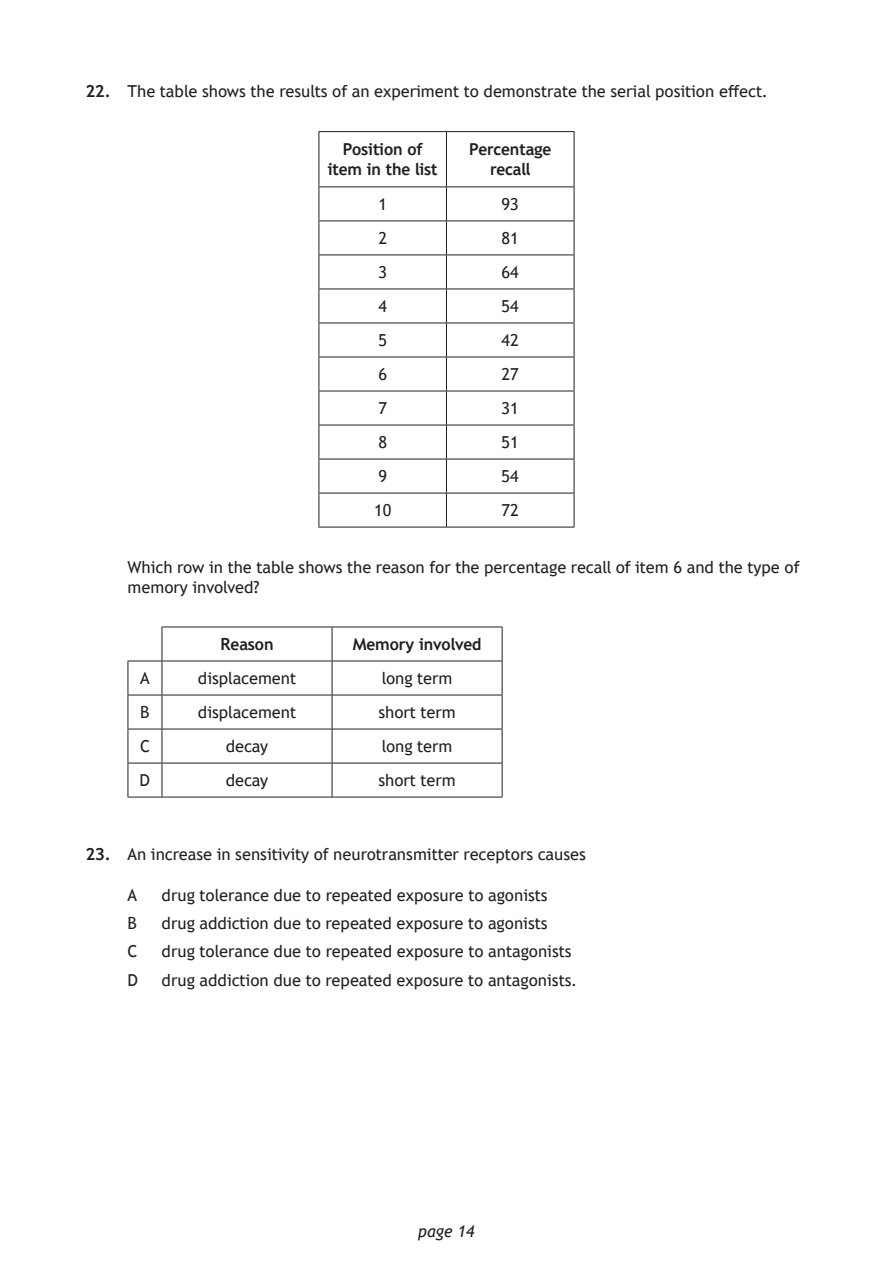
Selectable page text
22. The table shows the results of an experiment to demonstrate the serial position effect.

                        Position of Percentage
                      item in the list recall

                           1          93

                           2          81

                           3          64
                           4          54

                           5          42

                           6          27

                           7          31
                           8          51

                           9          54

                          10          72

    Which row in the table shows the reason for the percentage recall of item 6 and the type of
    memory involved?

            Reason      Memory involved
     A    displacement     long term

     B    displacement     short term

     C       decay         long term

     D       decay         short term

23. An increase in sensitivity of neurotransmitter receptors causes

    A  drug tolerance due to repeated exposure to agonists
    B  drug addiction due to repeated exposure to agonists
    C  drug tolerance due to repeated exposure to antagonists

    D  drug addiction due to repeated exposure to antagonists.

                              page 14
PDF page 15
Question 24Question 25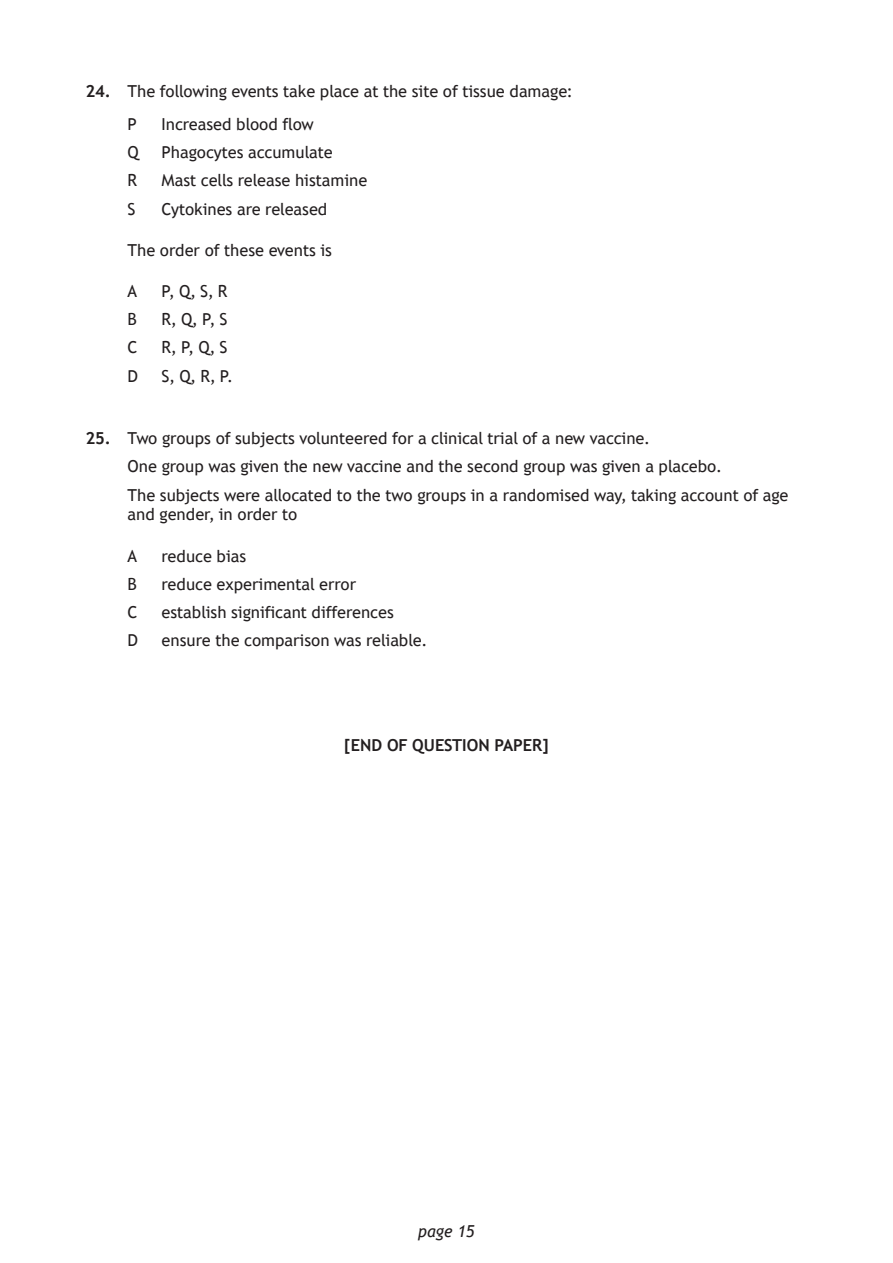
Selectable page text
24. The following events take place at the site of tissue damage:

    P  Increased blood flow
    Q  Phagocytes accumulate

    R  Mast cells release histamine
    S  Cytokines are released

    The order of these events is

    A  P, Q, S, R
    B  R, Q, P, S
    C  R, P, Q, S

    D  S, Q, R, P.

25. Two groups of subjects volunteered for a clinical trial of a new vaccine.

    One group was given the new vaccine and the second group was given a placebo.
    The subjects were allocated to the two groups in a randomised way, taking account of age
    and gender, in order to

    A  reduce bias

    B  reduce experimental error
    C  establish significant differences

    D  ensure the comparison was reliable.

                        [END OF QUESTION PAPER]

                              page 15
PDF page 16

Selectable page text
SPACE FOR ROUGH WORK

      page 16
PDF page 17

Selectable page text
SPACE FOR ROUGH WORK

      page 17
PDF page 18

Selectable page text
[BLANK PAGE]

DO NOT WRITE ON THIS PAGE

       page 18
PDF page 19

Selectable page text
[BLANK PAGE]

DO NOT WRITE ON THIS PAGE

       page 19
PDF page 20

Selectable page text
[BLANK PAGE]

DO NOT WRITE ON THIS PAGE

       page 20