2025 Higher Human Biology - Paper 1 questions
Source: Scottish Qualifications Authority (SQA) / Qualifications Scotland. This is a StemInteract HTML companion, not an official HTML edition. Extracted text is supplied alongside unaltered page images; use the images or original PDF for table layout, diagrams and symbols.
Jump to a question
PDF page 1
Selectable page text
H
National
Qualications
2025
X840/76/12 Human Biology
Paper 1 — Multiple choice
TUESDAY, 27 MAY
9:00 AM – 9:40 AM
Total marks — 25
Attempt ALL questions.
You may use a calculator.
Instructions for the completion of Paper 1 are given on page 02 of your answer booklet
X840/76/02.
Record your answers on the answer grid on page 03 of your answer booklet.
Space for rough work is provided at the end of this booklet.
Before leaving the examination room you must give your answer booklet to the Invigilator; if you
do not, you may lose all the marks for this paper.
©
*X8407612*
A/PBPDF page 2
Question 1Question 2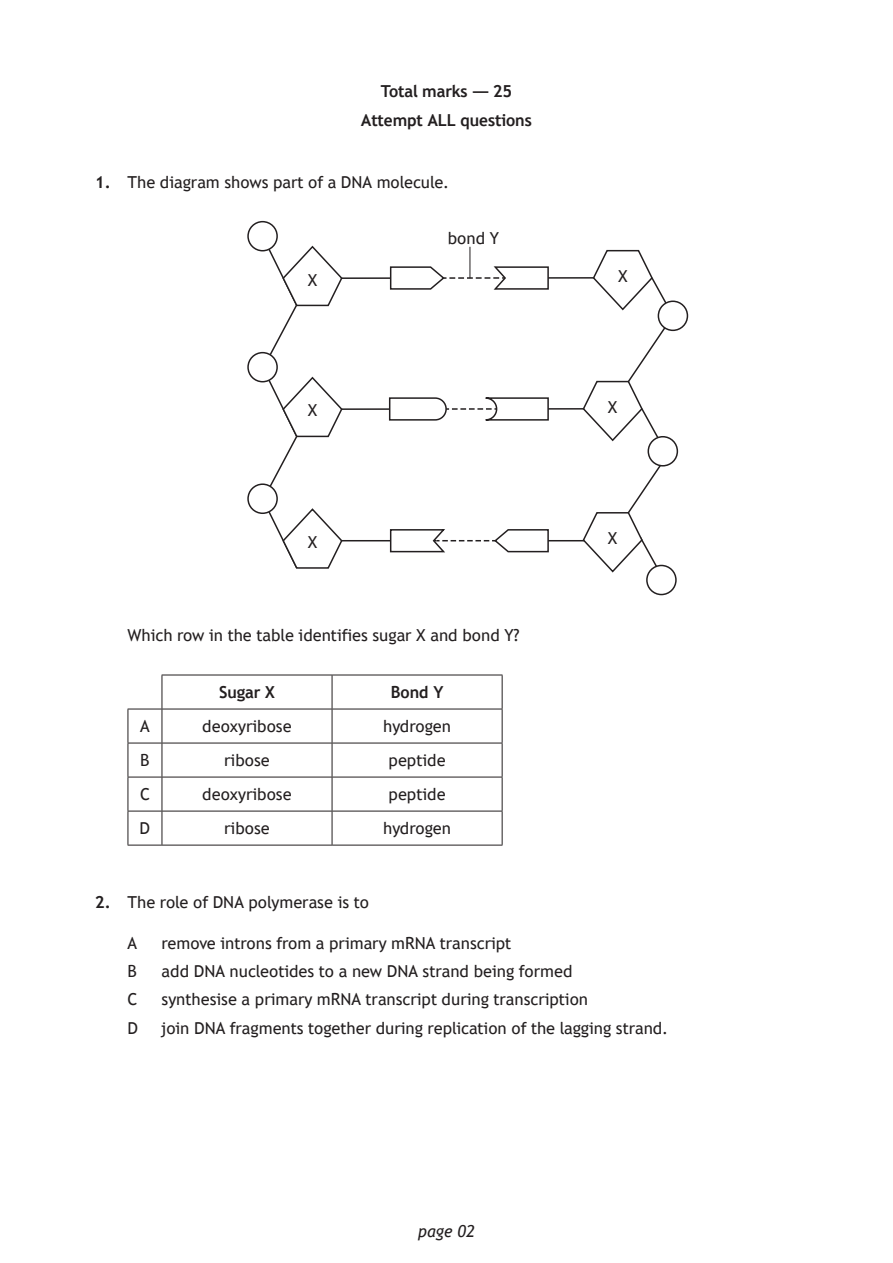
Selectable page text
Total marks — 25

                        Attempt ALL questions

1. The diagram shows part of a DNA molecule.

                                bond Y

                   X                            X

                   X                           X

                   X                           X

   Which row in the table identifies sugar X and bond Y?

           Sugar X         Bond Y

    A     deoxyribose     hydrogen

    B       ribose         peptide
    C     deoxyribose      peptide

    D       ribose        hydrogen

2. The role of DNA polymerase is to

   A  remove introns from a primary mRNA transcript
   B  add DNA nucleotides to a new DNA strand being formed

   C  synthesise a primary mRNA transcript during transcription
   D  join DNA fragments together during replication of the lagging strand.

                             page 02
PDF page 3
Question 3Question 4Question 5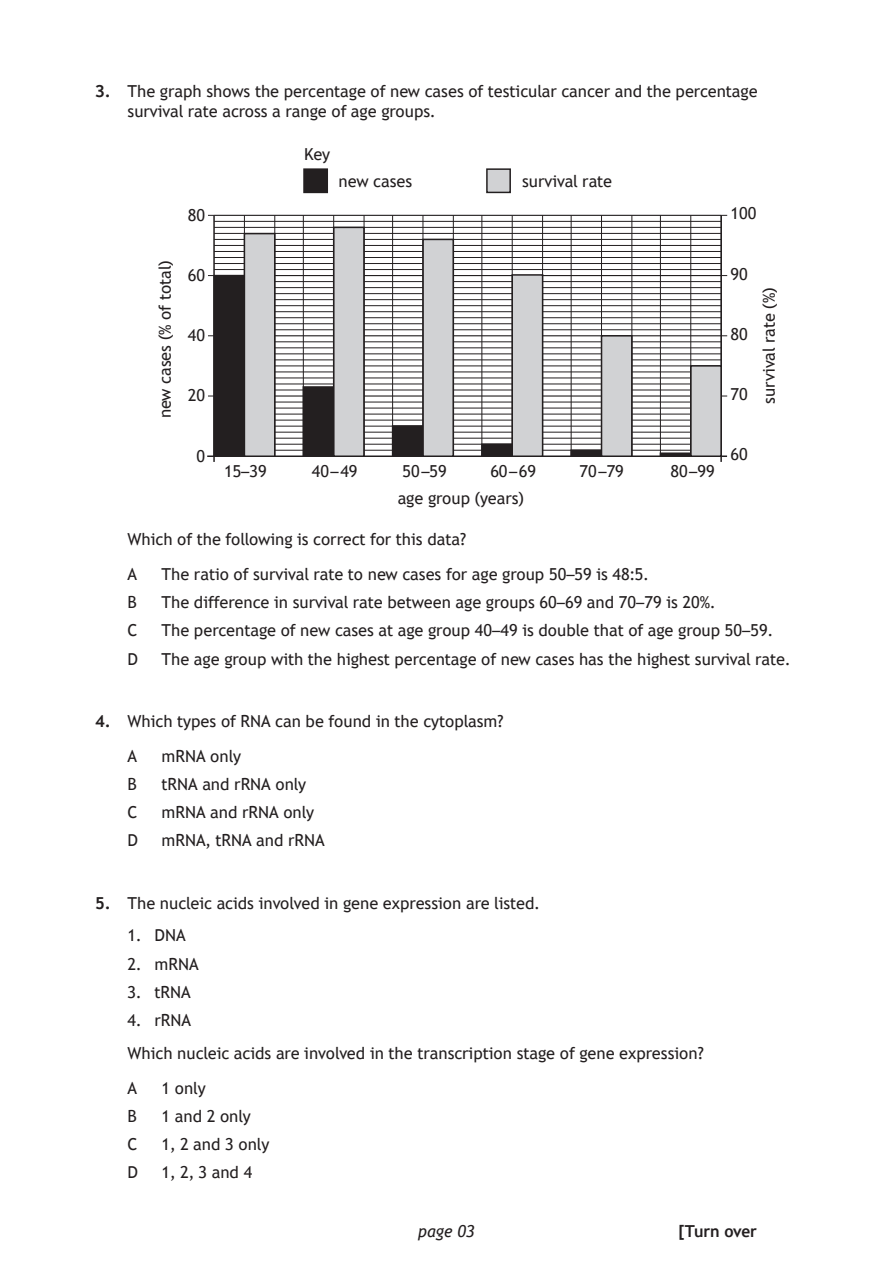
Selectable page text
3. The graph shows the percentage of new cases of testicular cancer and the percentage
   survival rate across a range of age groups.

        80                                                100

        60                                                90

        40                                                80

        20                                                70

         0                                                60
            15–39   40 – 49 50 –59
                            age group (years)

                             page 03
      )latot
      fo
      %(
      sesac
      wen
                                                             )%(
                                                             etar
                                                             lavivrus
                   Key
                      new cases        survival rate
                                    60 – 69 70 –79   80 –99
   Which of the following is correct for this data?
   A  The ratio of survival rate to new cases for age group 50–59 is 48:5.
   B  The difference in survival rate between age groups 60–69 and 70–79 is 20%.
   C  The percentage of new cases at age group 40–49 is double that of age group 50–59.
   D  The age group with the highest percentage of new cases has the highest survival rate.
4. Which types of RNA can be found in the cytoplasm?
   A  mRNA only
   B  tRNA and rRNA only
   C  mRNA and rRNA only
   D  mRNA, tRNA and rRNA
5. The nucleic acids involved in gene expression are listed.
   1. DNA
   2. mRNA
   3. tRNA
   4. rRNA
   Which nucleic acids are involved in the transcription stage of gene expression?
   A  1 only
   B  1 and 2 only
   C  1, 2 and 3 only
   D  1, 2, 3 and 4
                                                     [Turn over
PDF page 4
Question 6Question 7Question 8Question 9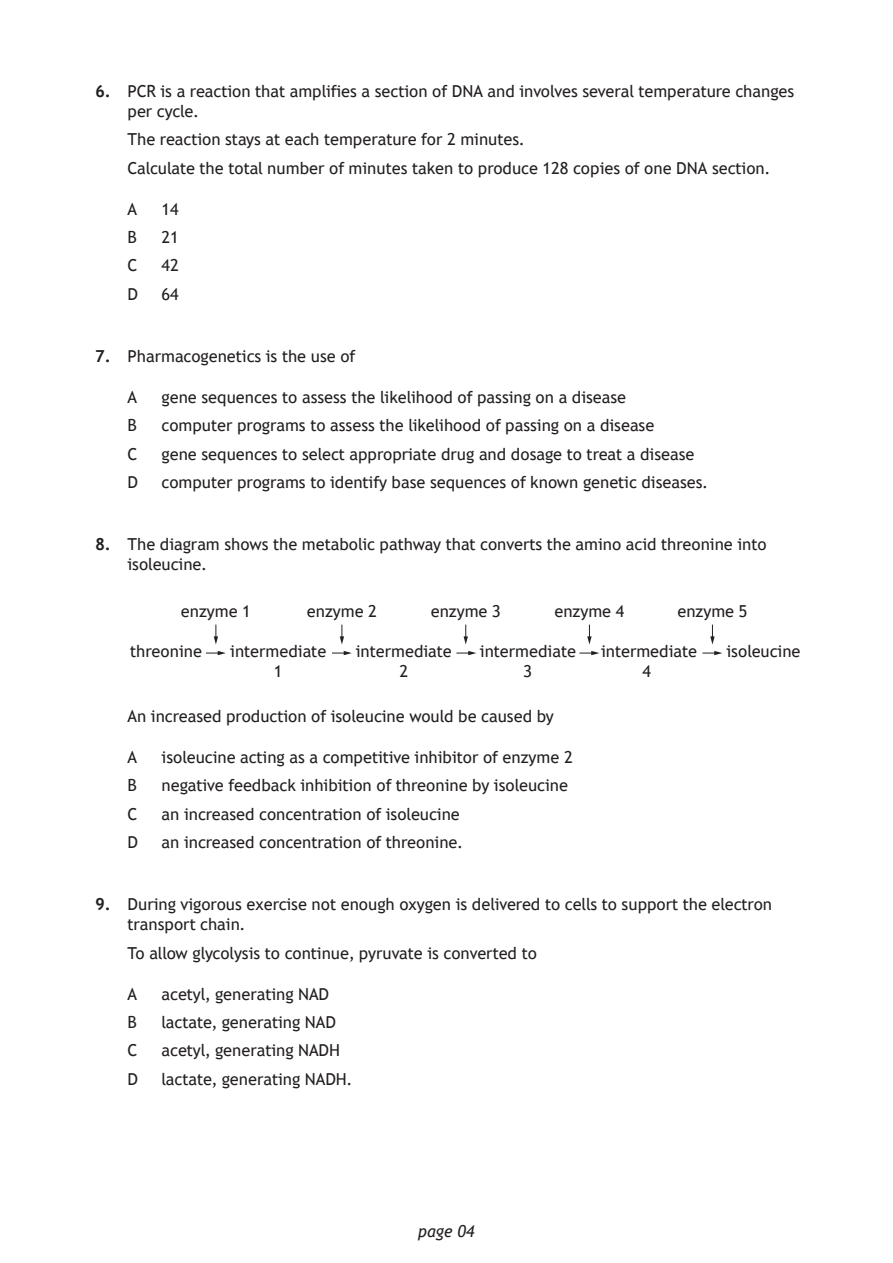
Selectable page text
6. PCR is a reaction that amplifies a section of DNA and involves several temperature changes
   per cycle.

   The reaction stays at each temperature for 2 minutes.
   Calculate the total number of minutes taken to produce 128 copies of one DNA section.

   A  14

   B  21
   C  42

   D  64

7. Pharmacogenetics is the use of

   A  gene sequences to assess the likelihood of passing on a disease
   B  computer programs to assess the likelihood of passing on a disease

   C  gene sequences to select appropriate drug and dosage to treat a disease
   D  computer programs to identify base sequences of known genetic diseases.

8. The diagram shows the metabolic pathway that converts the amino acid threonine into
   isoleucine.

        enzyme 1   enzyme 2    enzyme 3   enzyme 4   enzyme 5

   threonine intermediate intermediate intermediate intermediate isoleucine
                1           2          3          4

   An increased production of isoleucine would be caused by

   A  isoleucine acting as a competitive inhibitor of enzyme 2

   B  negative feedback inhibition of threonine by isoleucine
   C  an increased concentration of isoleucine

   D  an increased concentration of threonine.

9. During vigorous exercise not enough oxygen is delivered to cells to support the electron
   transport chain.

   To allow glycolysis to continue, pyruvate is converted to

   A  acetyl, generating NAD
   B  lactate, generating NAD

   C  acetyl, generating NADH
   D  lactate, generating NADH.

                             page 04
PDF page 5
Question 10Question 11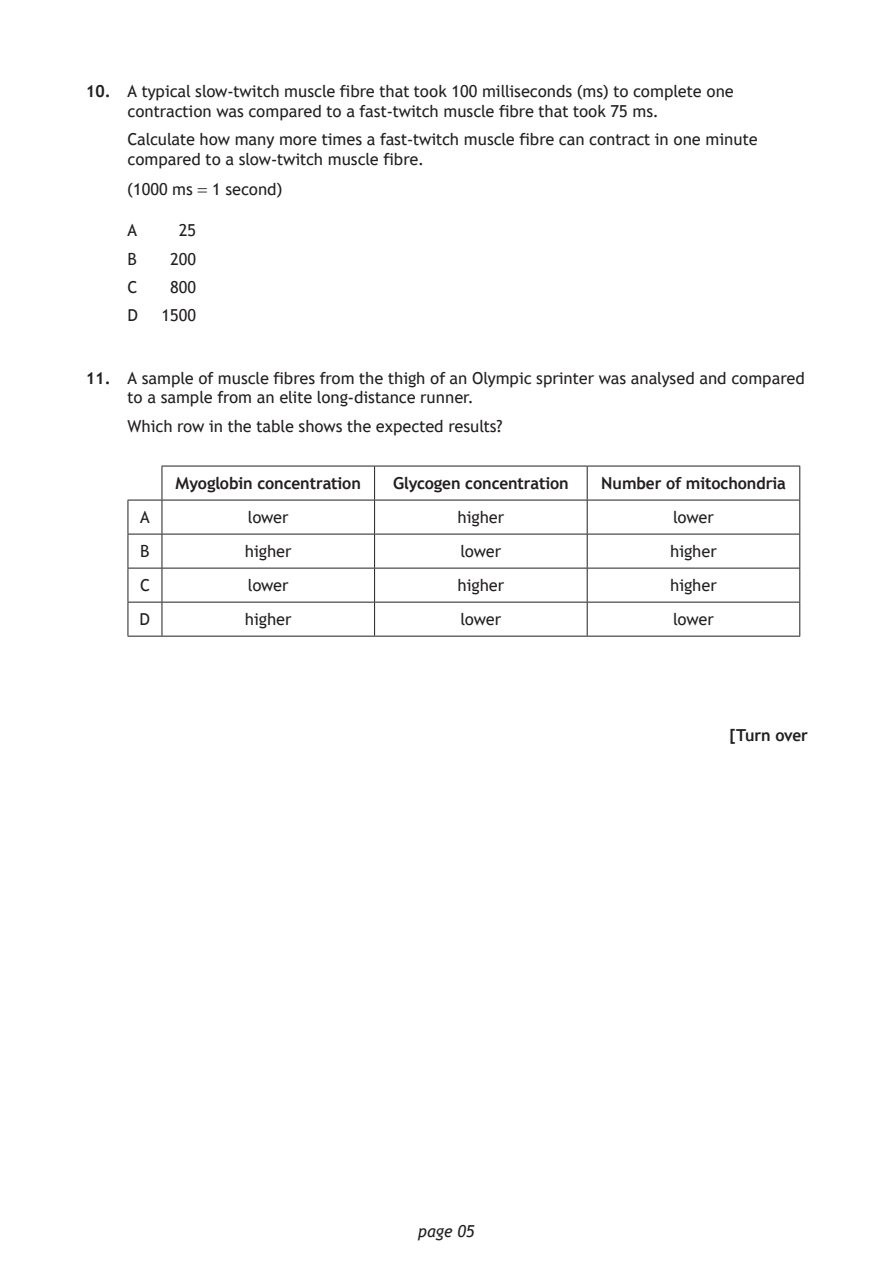
Selectable page text
10. A typical slow‑twitch muscle fibre that took 100 milliseconds (ms) to complete one
    contraction was compared to a fast‑twitch muscle fibre that took 75 ms.

    Calculate how many more times a fast‑twitch muscle fibre can contract in one minute
    compared to a slow‑twitch muscle fibre.
    (1000 ms = 1 second)

    A   25

    B   200
    C   800

    D  1500

11. A sample of muscle fibres from the thigh of an Olympic sprinter was analysed and compared
    to a sample from an elite long‑distance runner.
    Which row in the table shows the expected results?

        Myoglobin concentration Glycogen concentration Number of mitochondria

     A         lower              higher              lower

     B         higher             lower               higher

     C         lower              higher              higher
     D         higher             lower               lower

                                                           [Turn over

                              page 05
PDF page 6
Question 12Question 13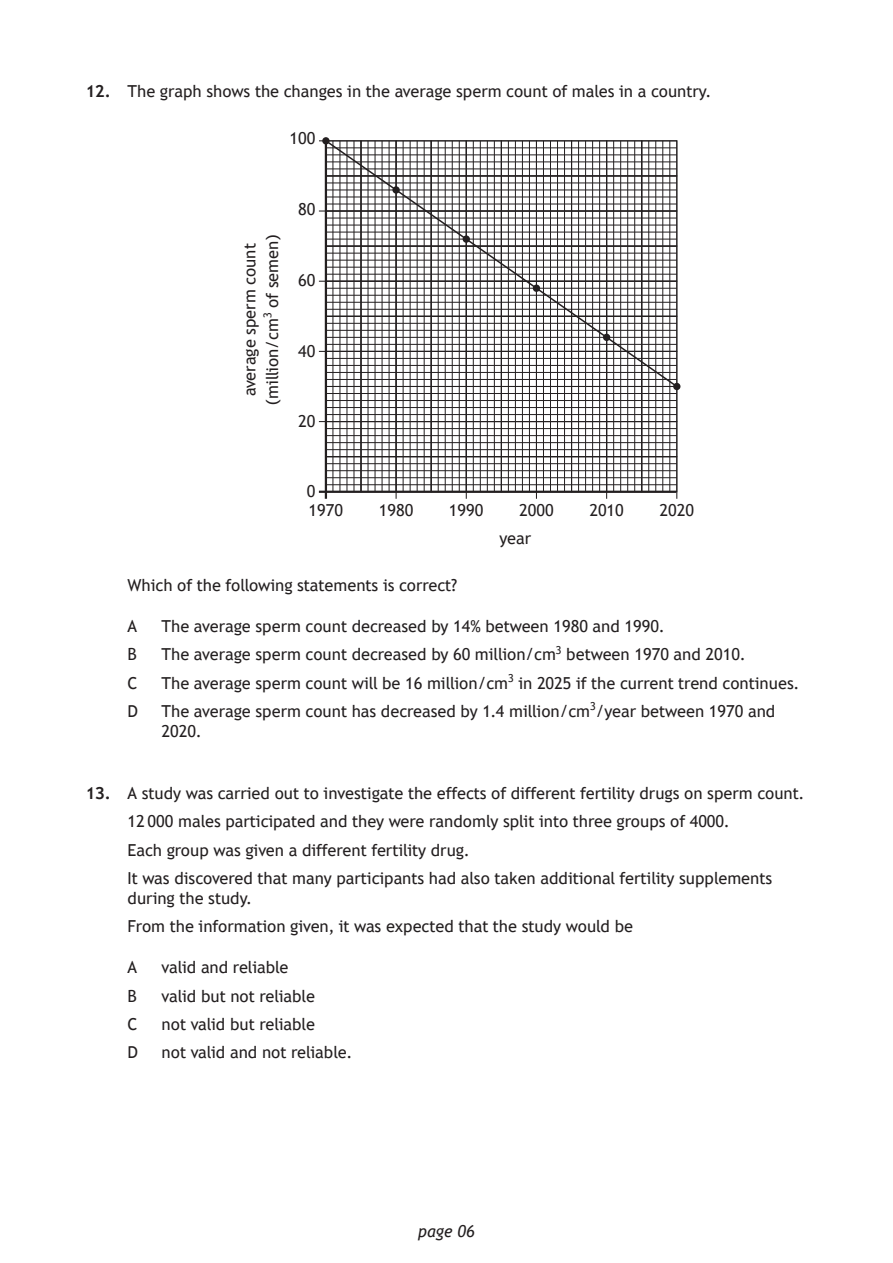
Selectable page text
12. The graph shows the changes in the average sperm count of males in a country.

                    1970   1980  1990
                                      year

                              page 06
              tnuoc
              mreps
              egareva
                )nemes
                fo
                3mc/noillim(
                   100
                   80
                   60
                   40
                   20
                    0
                                        2000  2010   2020
    Which of the following statements is correct?
    A  The average sperm count decreased by 14% between 1980 and 1990.
    B  The average sperm count decreased by 60 million/cm3 between 1970 and 2010.
    C  The average sperm count will be 16 million/cm3 in 2025 if the current trend continues.
    D  The average sperm count has decreased by 1.4 million/cm3/year between 1970 and
       2020.
13. A study was carried out to investigate the effects of different fertility drugs on sperm count.
    12 000 males participated and they were randomly split into three groups of 4000.
    Each group was given a different fertility drug.
    It was discovered that many participants had also taken additional fertility supplements
    during the study.
    From the information given, it was expected that the study would be
    A  valid and reliable
    B  valid but not reliable
    C  not valid but reliable
    D  not valid and not reliable.
PDF page 7
Question 14Question 15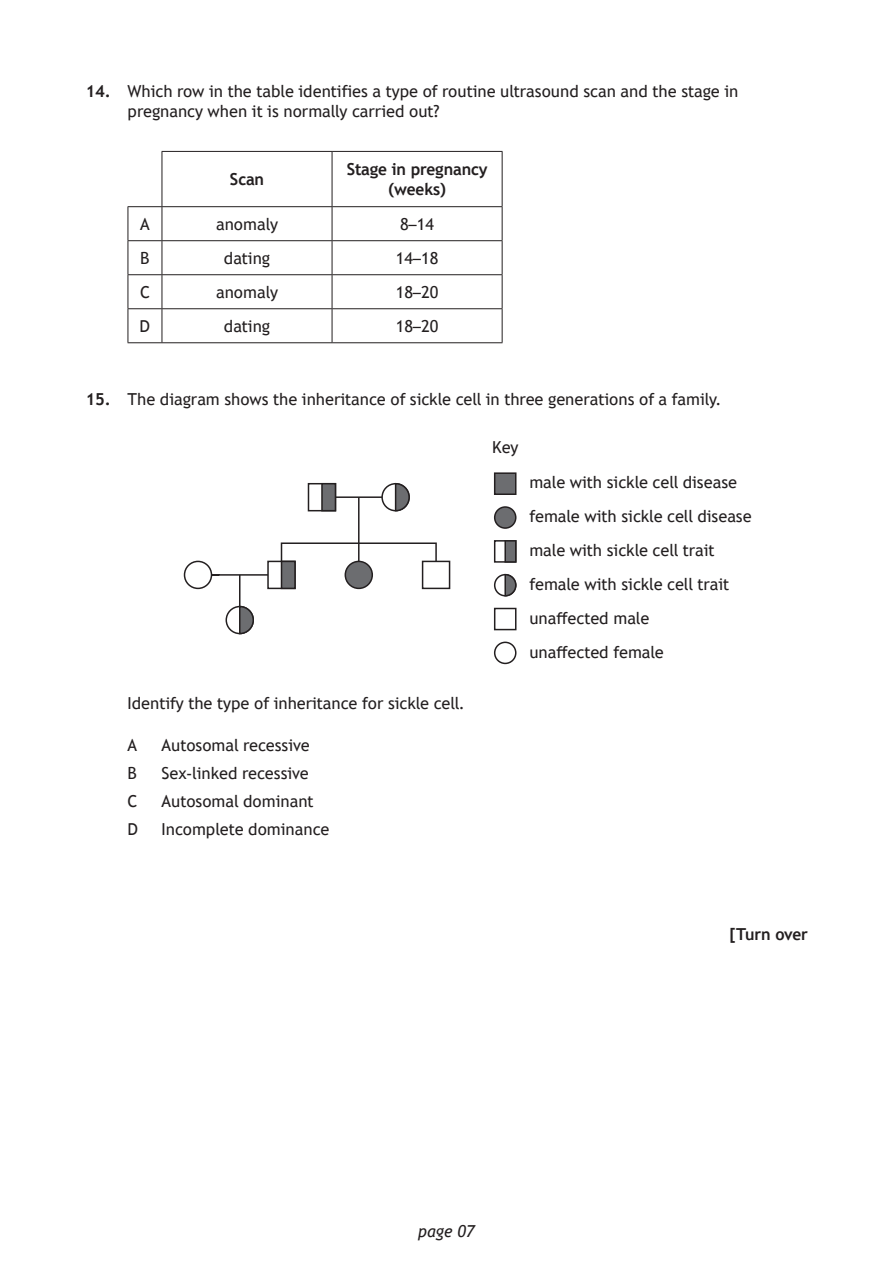
Selectable page text
14. Which row in the table identifies a type of routine ultrasound scan and the stage in
    pregnancy when it is normally carried out?

                        Stage in pregnancy
             Scan
                            (weeks)
     A      anomaly          8–14

     B       dating         14–18

     C      anomaly         18–20
     D       dating         18–20

15. The diagram shows the inheritance of sickle cell in three generations of a family.

                                     Key
                                         male with sickle cell disease

                                         female with sickle cell disease

                                         male with sickle cell trait

                                         female with sickle cell trait
                                         unaffected male

                                         unaffected female

    Identify the type of inheritance for sickle cell.

    A  Autosomal recessive
    B  Sex‑linked recessive

    C  Autosomal dominant
    D  Incomplete dominance

                                                           [Turn over

                              page 07
PDF page 8
Question 16Question 17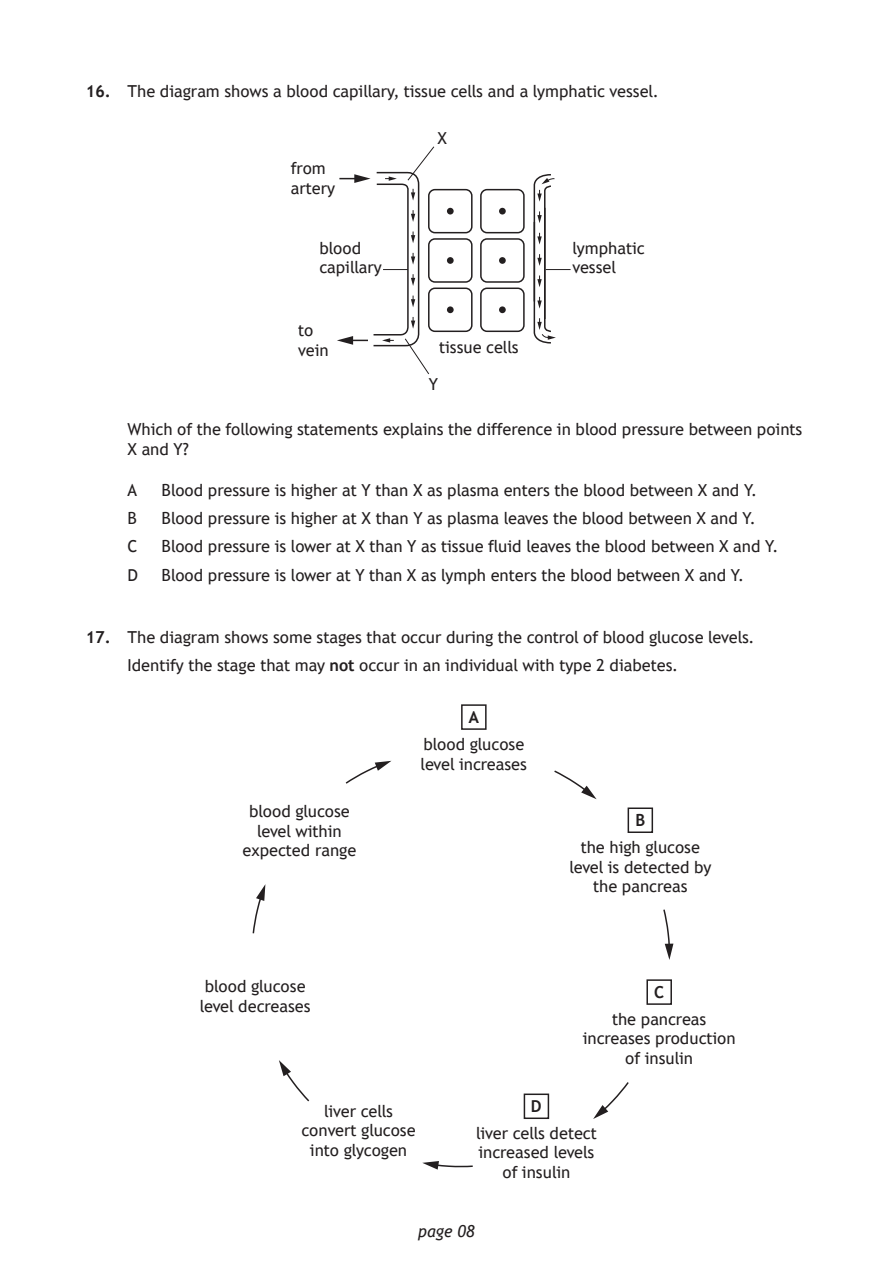
Selectable page text
16. The diagram shows a blood capillary, tissue cells and a lymphatic vessel.

                                X
                   from
                   artery

                     blood                   lymphatic
                     capillary               vessel

                   to
                   vein         tissue cells
                               Y

    Which of the following statements explains the difference in blood pressure between points
    X and Y?

    A  Blood pressure is higher at Y than X as plasma enters the blood between X and Y.
    B  Blood pressure is higher at X than Y as plasma leaves the blood between X and Y.

    C  Blood pressure is lower at X than Y as tissue fluid leaves the blood between X and Y.
    D  Blood pressure is lower at Y than X as lymph enters the blood between X and Y.

17. The diagram shows some stages that occur during the control of blood glucose levels.

    Identify the stage that may not occur in an individual with type 2 diabetes.

                                   A

                               blood glucose
                               level increases

               blood glucose
                                                  B
                level within
              expected range                 the high glucose
                                            level is detected by
                                               the pancreas

           blood glucose
                                                    C
          level decreases
                                                the pancreas
                                              increases production
                                                 of insulin
                                         D
                      liver cells
                    convert glucose liver cells detect
                    into glycogen   increased levels
                                      of insulin

                              page 08
PDF page 9
Question 18Question 19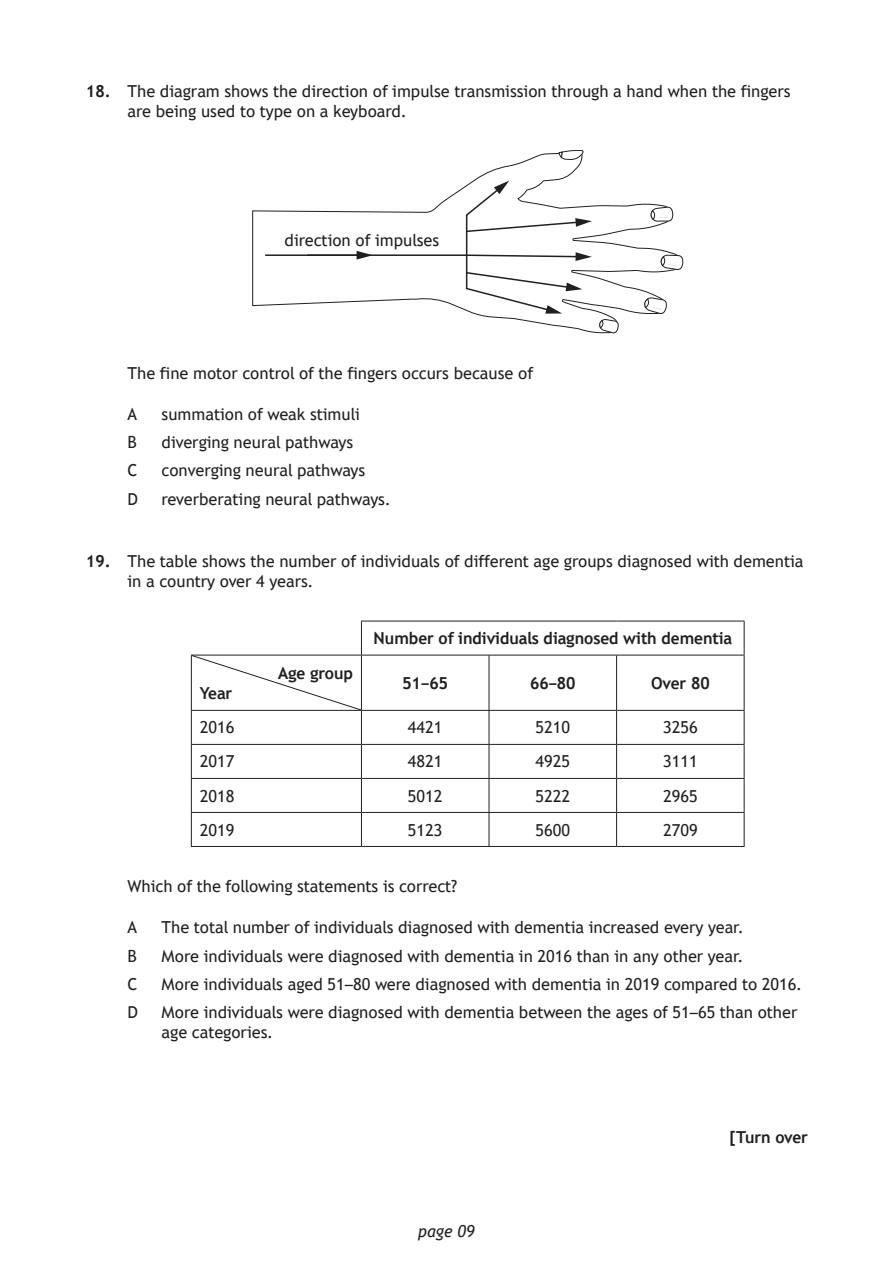
Selectable page text
18. The diagram shows the direction of impulse transmission through a hand when the fingers
    are being used to type on a keyboard.

                  direction of impulses

    The fine motor control of the fingers occurs because of

    A  summation of weak stimuli
    B  diverging neural pathways

    C  converging neural pathways
    D  reverberating neural pathways.

19. The table shows the number of individuals of different age groups diagnosed with dementia
    in a country over 4 years.

                          Number of individuals diagnosed with dementia

                  Age group
                             51–65       66–80      Over 80
          Year
          2016                4421       5210        3256

          2017                4821       4925        3111
          2018                5012       5222        2965

          2019                5123       5600        2709

    Which of the following statements is correct?

    A  The total number of individuals diagnosed with dementia increased every year.

    B  More individuals were diagnosed with dementia in 2016 than in any other year.
    C  More individuals aged 51–80 were diagnosed with dementia in 2019 compared to 2016.

    D  More individuals were diagnosed with dementia between the ages of 51–65 than other
       age categories.

                                                           [Turn over

                              page 09
PDF page 10
Question 20Question 21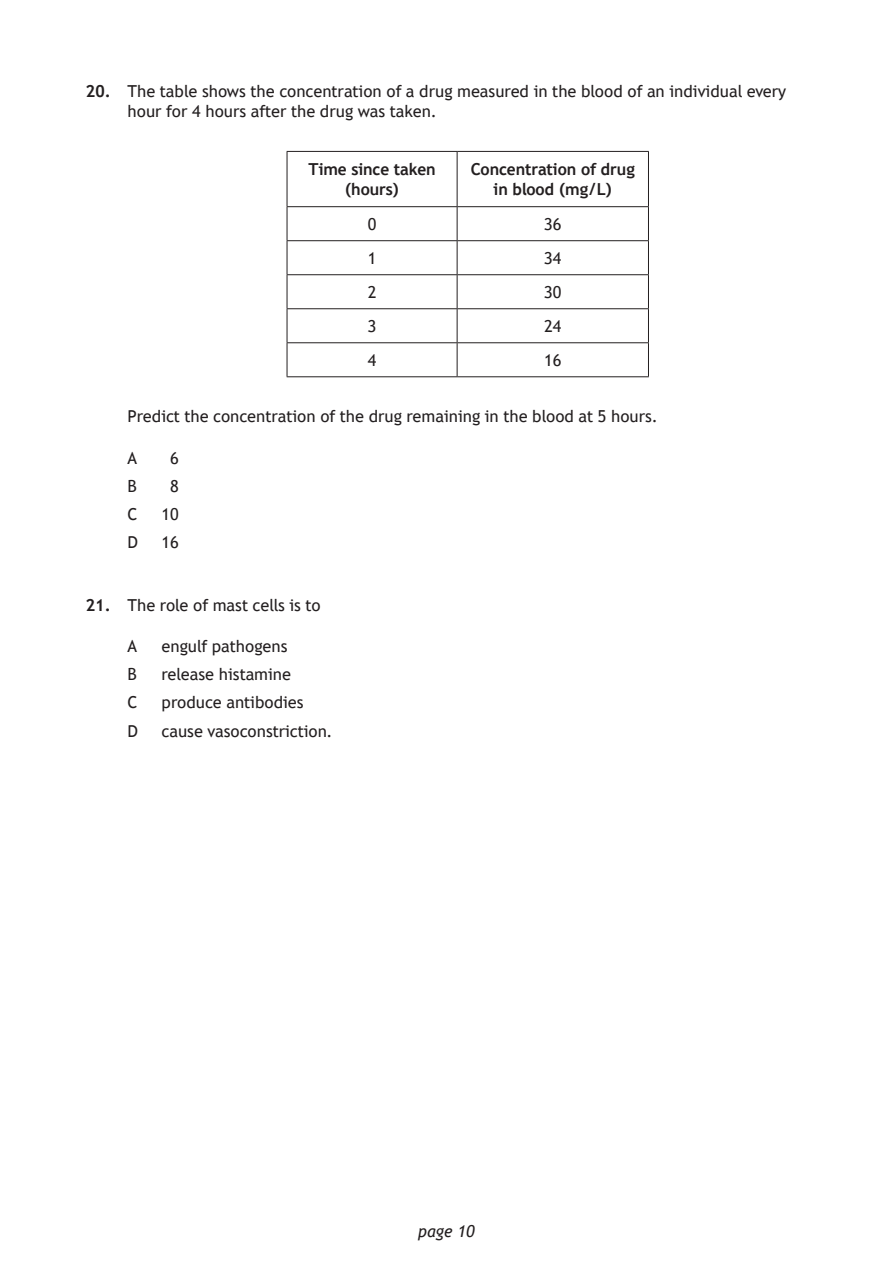
Selectable page text
20. The table shows the concentration of a drug measured in the blood of an individual every
    hour for 4 hours after the drug was taken.

                    Time since taken Concentration of drug
                        (hours)      in blood (mg/L)

                          0               36

                          1               34

                          2               30
                          3               24

                          4               16

    Predict the concentration of the drug remaining in the blood at 5 hours.

    A   6

    B   8
    C  10
    D  16

21. The role of mast cells is to

    A  engulf pathogens
    B  release histamine

    C  produce antibodies
    D  cause vasoconstriction.

                              page 10
PDF page 11
Question 22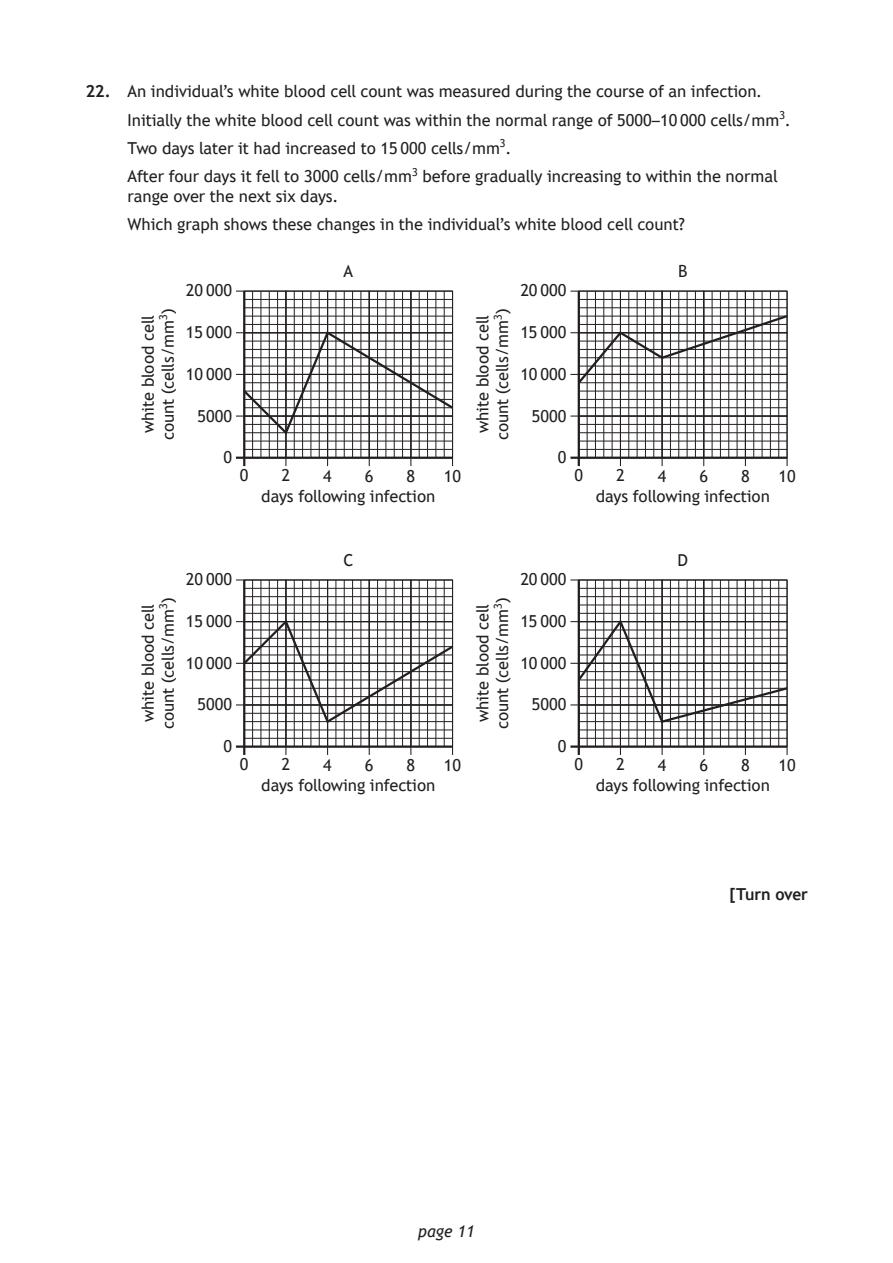
Selectable page text
22. An individual’s white blood cell count was measured during the course of an infection.

    Initially the white blood cell count was within the normal range of 5000–10 000 cells/mm3.
    Two days later it had increased to 15 000 cells/mm3.

    After four days it fell to 3000 cells/mm3 before gradually increasing to within the normal
    range over the next six days.
    Which graph shows these changes in the individual’s white blood cell count?

                        A
         20 000

         15 000

         10 000

          5000

             0
              0   2   4   6  8   10

                              page 11
     llec
     doolb
     etihw
       )3mm/sllec(
       tnuoc
                                                      B
                                        20 000
                                        15 000
                                        10 000
                                         5000
                                           0
                                             0   2  4   6   8   10
                days following infection
                                    llec
                                    doolb
                                    etihw
                                     )3mm/sllec(
                                      tnuoc
                                               days following infection
                        C
         20 000
         15 000
         10 000
          5000
             0
              0   2   4   6  8   10
     llec
     doolb
     etihw
       )3mm/sllec(
       tnuoc
                                                      D
                                        20 000
                                        15 000
                                        10 000
                                         5000
                                           0
                                             0   2  4   6   8   10
                days following infection
                                    llec
                                    doolb
                                    etihw
                                     )3mm/sllec(
                                      tnuoc
                                               days following infection
                                                           [Turn over
PDF page 12
Question 23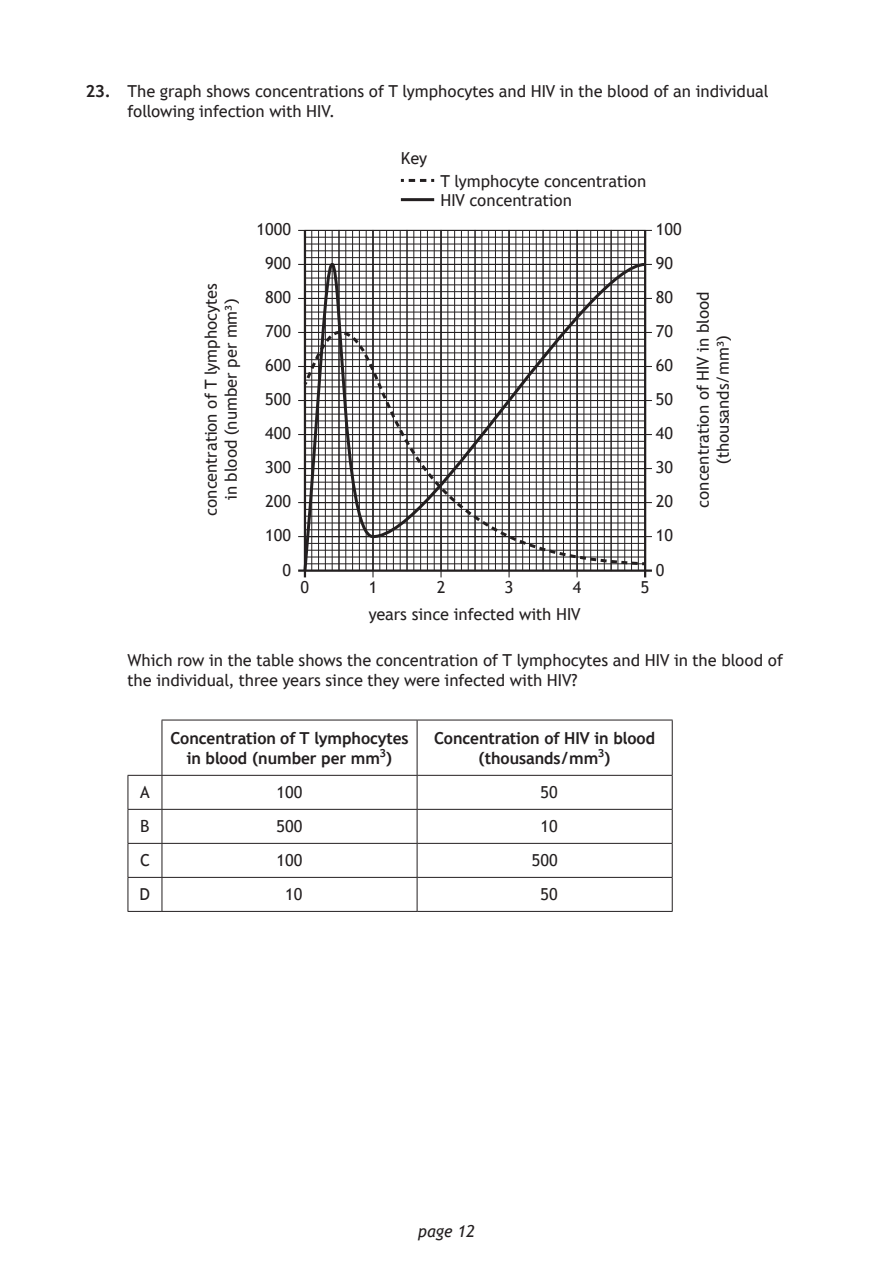
Selectable page text
23. The graph shows concentrations of T lymphocytes and HIV in the blood of an individual
    following infection with HIV.

                             Key
                                T lymphocyte concentration
                                HIV concentration

                    0     1     2
                          years since infected with HIV

                              page 12
           setycohpmyl
           T
           fo
           noitartnecnoc
             )³mm
             rep
             rebmun(
             doolb
             ni
                1000
                900
                800
                700
                600
                500
                400
                300
                200
                100
                  0
                                      3      4     5
                                                        doolb
                                                        ni
                                                        VIH
                                                        fo
                                                        noitartnecnoc
                                                          )³mm/sdnasuoht(
                                                    100
                                                    90
                                                    80
                                                    70
                                                    60
                                                    50
                                                    40
                                                    30
                                                    20
                                                    10
                                                    0
    Which row in the table shows the concentration of T lymphocytes and HIV in the blood of
    the individual, three years since they were infected with HIV?
        Concentration of T lymphocytes Concentration of HIV in blood
         in blood (number per mm3)  (thousands/mm3)
     A           100                      50
     B           500                      10
     C           100                     500
     D            10                      50
PDF page 13
Question 24Question 25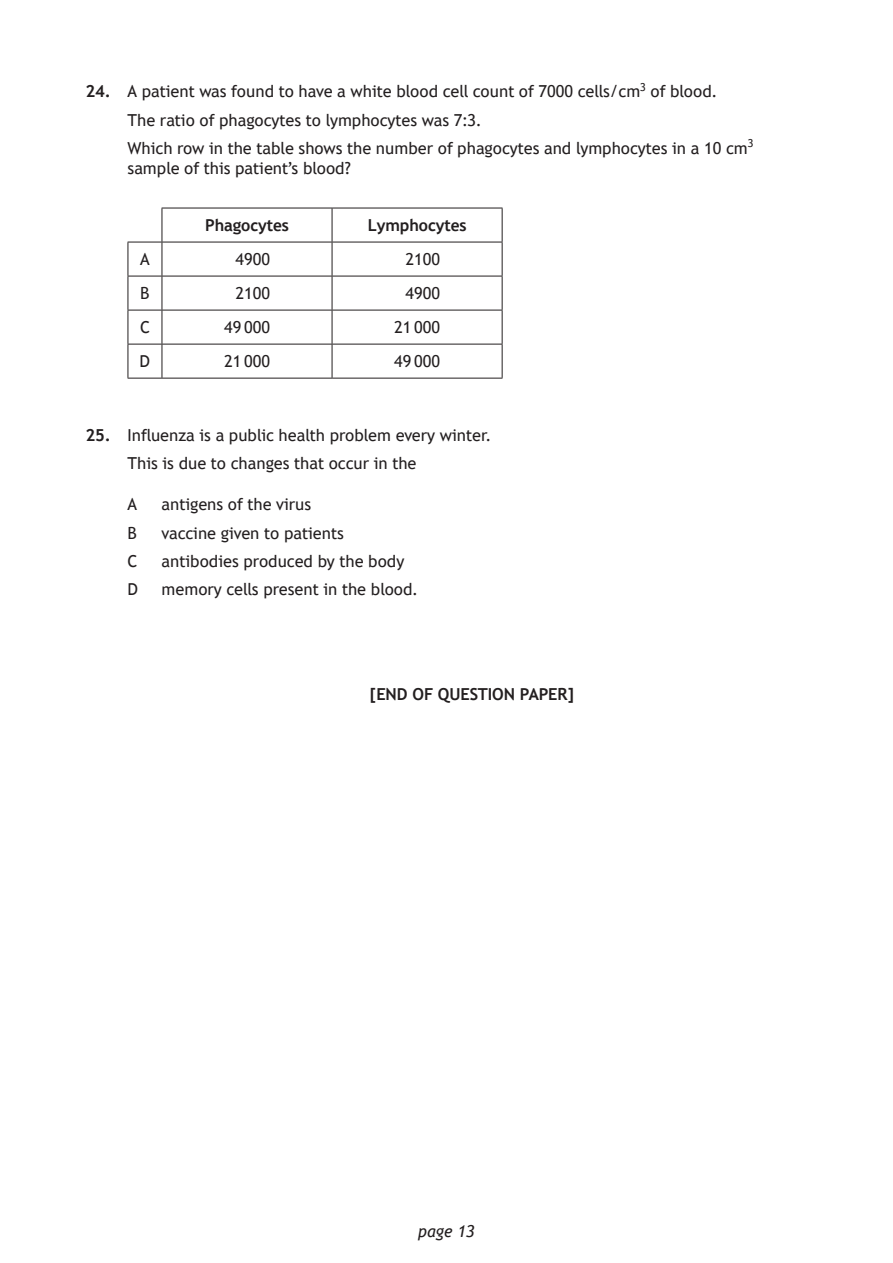
Selectable page text
24. A patient was found to have a white blood cell count of 7000 cells/cm3 of blood.

    The ratio of phagocytes to lymphocytes was 7:3.
    Which row in the table shows the number of phagocytes and lymphocytes in a 10 cm3
    sample of this patient’s blood?

           Phagocytes     Lymphocytes

     A        4900           2100

     B        2100           4900
     C       49 000         21 000

     D       21 000         49 000

25. Influenza is a public health problem every winter.
    This is due to changes that occur in the

    A  antigens of the virus
    B  vaccine given to patients
    C  antibodies produced by the body

    D  memory cells present in the blood.

                          [END OF QUESTION PAPER]

                              page 13
PDF page 14

Selectable page text
SPACE FOR ROUGH WORK

      page 14
PDF page 15

Selectable page text
SPACE FOR ROUGH WORK

      page 15
PDF page 16

Selectable page text
[BLANK PAGE]

DO NOT WRITE ON THIS PAGE

       page 16