2026 Higher Biology - Paper 2 questions
Source: Scottish Qualifications Authority (SQA) / Qualifications Scotland. This is a StemInteract HTML companion, not an official HTML edition. Selectable text is supplied alongside original page images. Use the images or original PDF for equations, powers, fractions, vector notation, tables and diagrams; text extraction cannot fully preserve mathematical layout.
Jump to a question
PDF page 1

Selectable page text
FOR OFFICIAL USE
H
National
Qualications
Mark
2026
X807/76/01 Biology
Paper 2
TUESDAY, 28 APRIL
10:10 AM – 12:30 PM
*X8077601*
Fill in these boxes and read what is printed below.
Full name of centre Town
Forename(s) Surname Number of seat
Date of birth
Day Month Year Scottish candidate number
Total marks — 95
Attempt ALL questions.
You may use a calculator.
Questions 9 and 14 contain a choice.
Write your answers clearly in the spaces provided in this booklet. Additional space for answers
and rough work is provided at the end of this booklet. If you use this space you must clearly
identify the question number you are attempting. Any rough work must be written in this
booklet. Score through your rough work when you have written your final copy.
Use blue or black ink.
Do not remove any exam materials. You must leave this booklet on your desk; if you do not, you
could lose all the marks for this paper.
*X807760101*
A/HTP
© Qualifications Scotland 2026PDF page 2
Paper 2, Question 1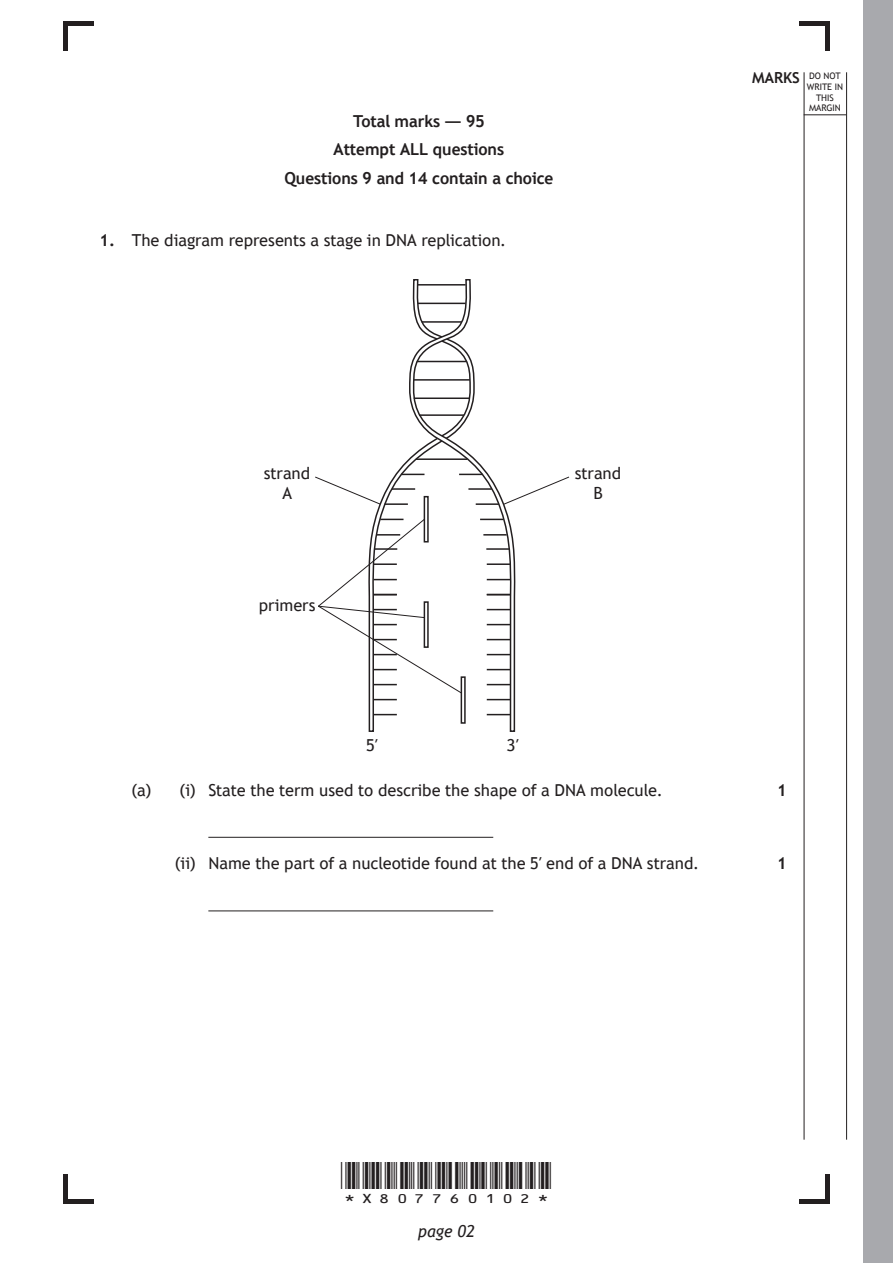
Selectable page text
MARKS _{W}^{D}_{R}^{O}_{I} _{T}^{N}OT
                                                                   E IN
                                                                  THIS
                                                                 MARGIN
                       Total marks — 95
                      Attempt ALL questions
                 Questions 9 and 14 contain a choice

1. The diagram represents a stage in DNA replication.

               strand                       strand
                 A                            B

               primers

                         5′           3′

   (a)  (i) State the term used to describe the shape of a DNA molecule. 1

       (ii) Name the part of a nucleotide found at the 5′ end of a DNA strand. 1

                      *X807760102*

                             page 02
PDF page 3

Selectable page text
MARKS _{W}^{D}_{R}^{O}_{I} _{T}^{N}OT
                                                                   E IN
                                                                  THIS
                                                                 MARGIN
1. (continued)
   (b) Primers are necessary for DNA replication.
        (i) State why replication of strand B requires only one primer. 1

       (ii) Primers are short strands of RNA nucleotides.

          The base sequence of DNA on strand B that the primer binds to is shown.

                              C G A A T C G T

          Give the base sequence of this primer.              1

   (c) Name one enzyme involved in DNA replication and state its function. 2

      Enzyme

      Function

   (d) In prokaryotic cells, DNA replicates at a rate of 1000 nucleotides per second. In
      comparison, eukaryotic DNA can replicate at a rate of 50 nucleotides per
      second.
      Calculate how many times greater the rate of replication is in prokaryotic cells
      compared to eukaryotic cells.                           1

      Space for calculation

                                       ��������������������������� times greater

                                                     [Turn over

                      *X807760103*

                             page 03
PDF page 4
Paper 2, Question 2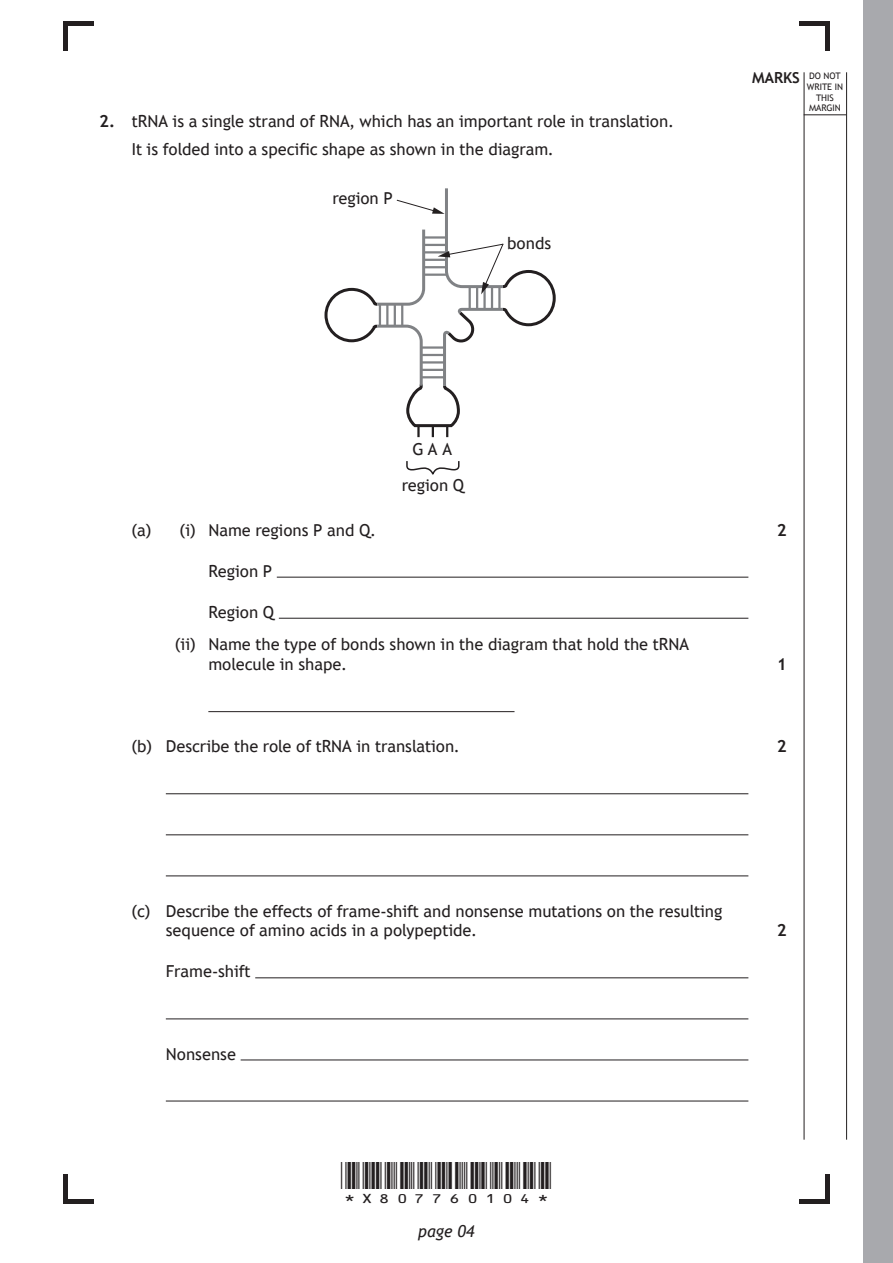
Selectable page text
MARKS _{W}^{D}_{R}^{O}_{I} _{T}^{N}OT
                                                                   E IN
                                                                  THIS
                                                                 MARGIN
2. tRNA is a single strand of RNA, which has an important role in translation.
   It is folded into a specific shape as shown in the diagram.
                      region P

                                      bonds

                             GA A

                            region Q

   (a)  (i) Name regions P and Q.                             2

          Region P

          Region Q

       (ii) Name the type of bonds shown in the diagram that hold the tRNA
          molecule in shape.                                  1

   (b) Describe the role of tRNA in translation.              2

   (c) Describe the effects of frame‑shift and nonsense mutations on the resulting
      sequence of amino acids in a polypeptide.               2

      Frame‑shift

      Nonsense

                      *X807760104*

                             page 04
PDF page 5
Paper 2, Question 3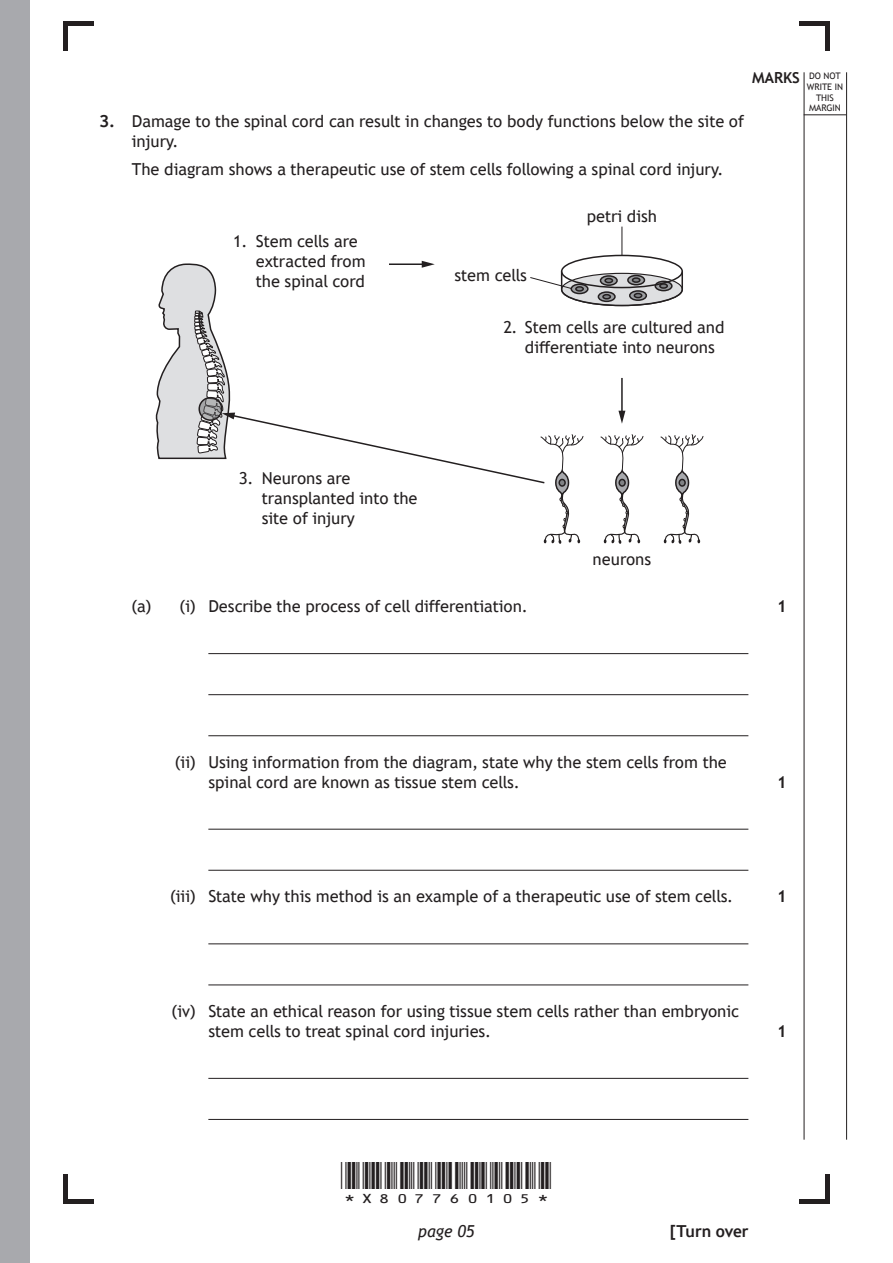
Selectable page text
MARKS _{W}^{D}_{R}^{O}_{I} _{T}^{N}OT
                                                                   E IN
                                                                  THIS
                                                                 MARGIN
3. Damage to the spinal cord can result in changes to body functions below the site of
   injury.
   The diagram shows a therapeutic use of stem cells following a spinal cord injury.
                                             petri dish
            1. Stem cells are
               extracted from
                                 stem cells
               the spinal cord
                                     2. Stem cells are cultured and
                                       differentiate into neurons

             3. Neurons are
               transplanted into the
               site of injury

                                             neurons

   (a)  (i) Describe the process of cell differentiation.     1

       (ii) Using information from the diagram, state why the stem cells from the
          spinal cord are known as tissue stem cells.         1

       (iii) State why this method is an example of a therapeutic use of stem cells. 1

       (iv) State an ethical reason for using tissue stem cells rather than embryonic
          stem cells to treat spinal cord injuries.           1

                      *X807760105*

                             page 05                 [Turn over
PDF page 6
Selectable page text
MARKS _{W}^{D}_{R}^{O}_{I} _{T}^{N}OT
                                                                   E IN
                                                                  THIS
                                                                 MARGIN
3. (continued)
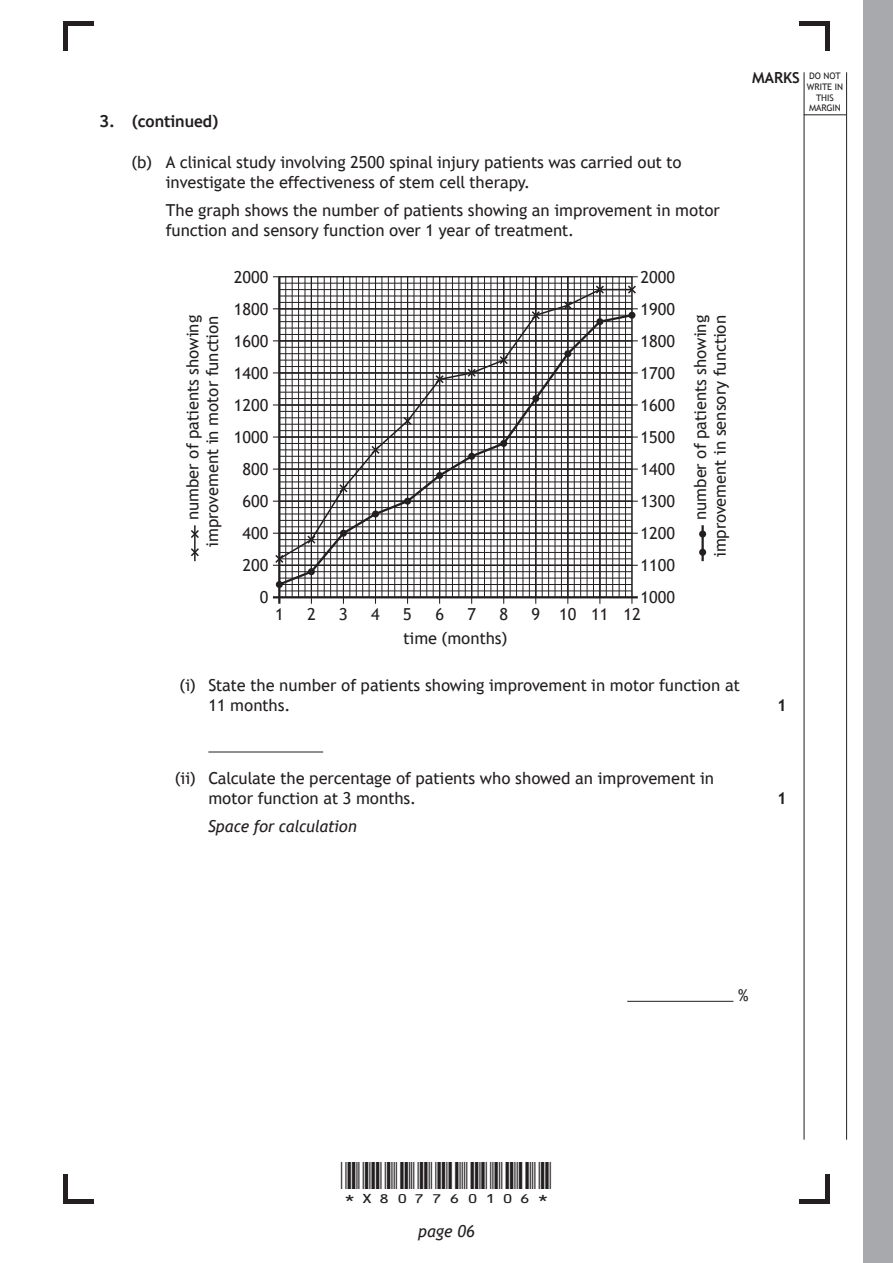
   (b) A clinical study involving 2500 spinal injury patients was carried out to
      investigate the effectiveness of stem cell therapy.
      The graph shows the number of patients showing an improvement in motor
      function and sensory function over 1 year of treatment.

                1  2  3  4  5  6  7  8  9 10 11 12
                            time (months)

                      *X807760106*

                             page 06
        gniwohs
        stneitap
        fo
        rebmun
          noitcnuf
          rotom
          ni
          tnemevorpmi
                                                       gniwohs
                                                       stneitap
                                                       fo
                                                       rebmun
                                                         noitcnuf
                                                         yrosnes
                                                         ni
                                                         tnemevorpmi
            2000                                  2000
            1800                                  1900
            1600                                  1800
            1400                                  1700
            1200                                  1600
            1000                                  1500
             800                                  1400
             600                                  1300
             400                                  1200
             200                                  1100
               0                                  1000
        (i) State the number of patients showing improvement in motor function at
          11 months.                                          1
       (ii) Calculate the percentage of patients who showed an improvement in
          motor function at 3 months.                         1
          Space for calculation
                                                 ����������������������� %
PDF page 7

Selectable page text
MARKS _{W}^{D}_{R}^{O}_{I} _{T}^{N}OT
                                                                   E IN
                                                                  THIS
                                                                 MARGIN
3. (b) (continued)
       (iii) State the number of patients showing an improvement in sensory
          function when the number of patients showing an improvement in motor
          function is 1400.                                   1

       (iv) Some patients showed improvement in both motor and sensory function.
          Use evidence from the graph at 9 months to support this statement. 1

                                                     [Turn over

                      *X807760107*

                             page 07
PDF page 8
Paper 2, Question 4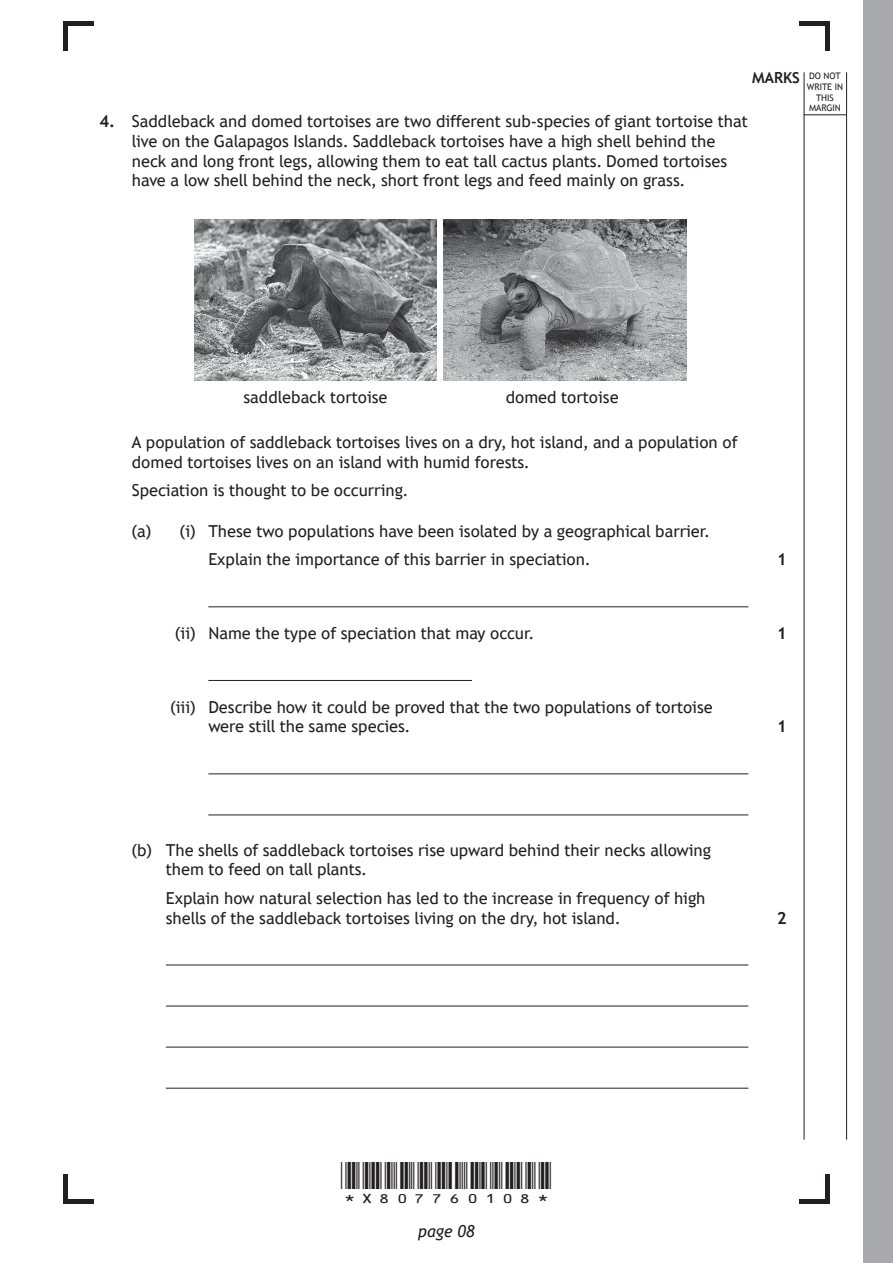
Selectable page text
MARKS _{W}^{D}_{R}^{O}_{I} _{T}^{N}OT
                                                                   E IN
                                                                  THIS
                                                                 MARGIN
4. Saddleback and domed tortoises are two different sub‑species of giant tortoise that
   live on the Galapagos Islands. Saddleback tortoises have a high shell behind the
   neck and long front legs, allowing them to eat tall cactus plants. Domed tortoises
   have a low shell behind the neck, short front legs and feed mainly on grass.

             saddleback tortoise     domed tortoise

   A population of saddleback tortoises lives on a dry, hot island, and a population of
   domed tortoises lives on an island with humid forests.

   Speciation is thought to be occurring.

   (a)  (i) These two populations have been isolated by a geographical barrier.
          Explain the importance of this barrier in speciation. 1

       (ii) Name the type of speciation that may occur.       1

       (iii) Describe how it could be proved that the two populations of tortoise
          were still the same species.                        1

   (b) The shells of saddleback tortoises rise upward behind their necks allowing
      them to feed on tall plants.

      Explain how natural selection has led to the increase in frequency of high
      shells of the saddleback tortoises living on the dry, hot island. 2

                      *X807760108*

                             page 08
PDF page 9

Selectable page text
MARKS _{W}^{D}_{R}^{O}_{I} _{T}^{N}OT
                                                                   E IN
                                                                  THIS
                                                                 MARGIN
4. (continued)
   (c) Giant tortoise numbers on the Galapagos Islands have been estimated and the
      data are shown in the table.

                      Year    Estimated population

                      1600        200 000
                      1970          2500

                      2020         17 000

      The rapid decline in numbers between 1600 and 1970 was due to human
      impact. The increase in numbers after 1970 is due to a captive breeding and
      release programme.

        (i) Calculate the percentage decrease in the population of giant tortoises
          between 1600 and 1970.                              1
          Space for calculation

                                                 ����������������������� %

       (ii) Assuming numbers increase at the same rate as they have between 1970
          and 2020, predict the estimated tortoise number in 2030. 1
          Space for calculation

                                               ������������������������������

                                                     [Turn over

                      *X807760109*

                             page 09
PDF page 10
Paper 2, Question 5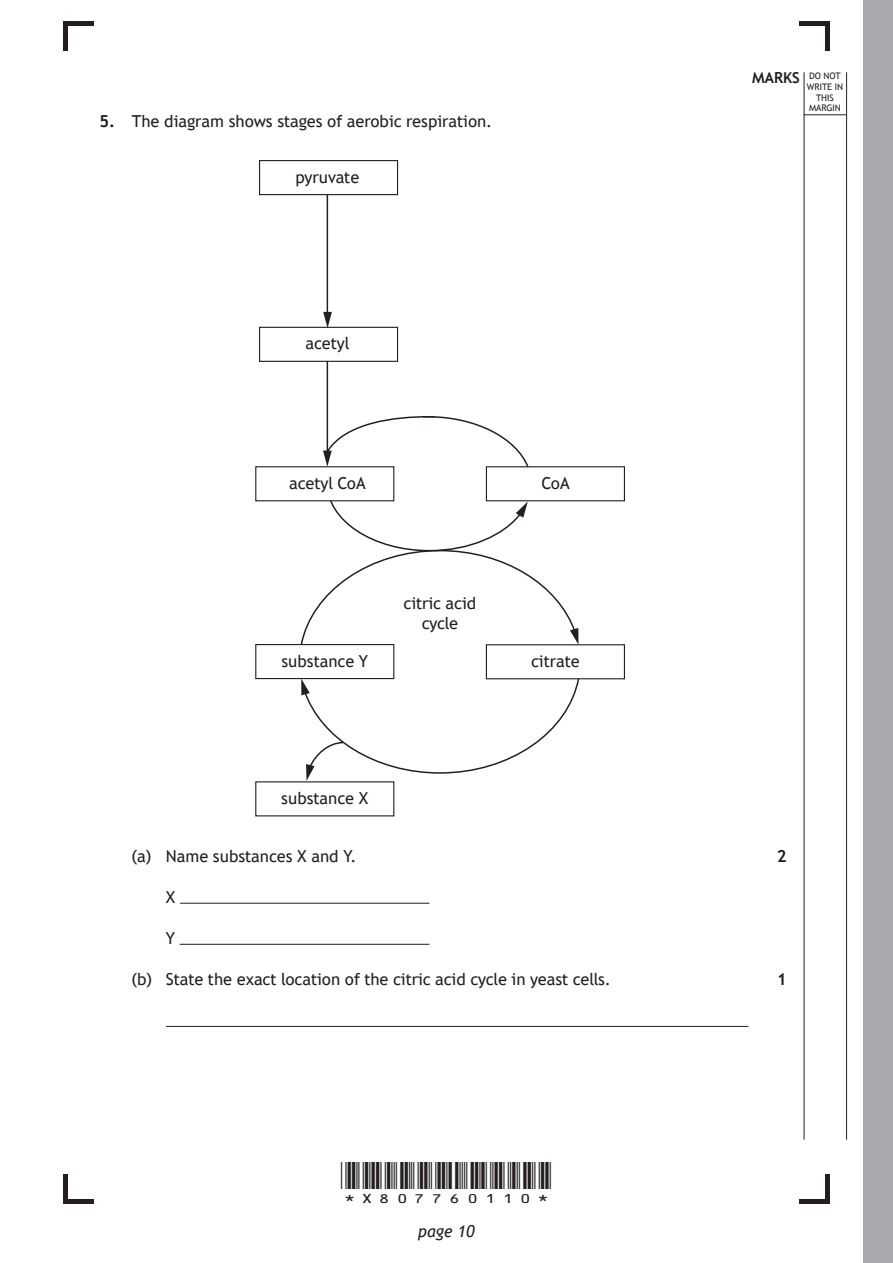
Selectable page text
MARKS _{W}^{D}_{R}^{O}_{I} _{T}^{N}OT
                                                                   E IN
                                                                  THIS
                                                                 MARGIN
5. The diagram shows stages of aerobic respiration.
                  pyruvate

                   acetyl

                  acetyl CoA             CoA

                            citric acid
                              cycle

                 substance Y            citrate

                 substance X

   (a) Name substances X and Y.                               2

      X

      Y

   (b) State the exact location of the citric acid cycle in yeast cells. 1

                      *X807760110*

                             page 10
PDF page 11

Selectable page text
MARKS _{W}^{D}_{R}^{O}_{I} _{T}^{N}OT
                                                                   E IN
                                                                  THIS
                                                                 MARGIN
5. (continued)
   (c) Describe the role of dehydrogenase and NAD in the citric acid cycle. 2
      Dehydrogenase

      NAD

   (d) Fermentation can take place in yeast cells.
        (i) State the conditions required for fermentation to take place. 1

       (ii) Name the products of fermentation in yeast cells. 1

                                                     [Turn over

                      *X807760111*

                             page 11
PDF page 12
Paper 2, Question 6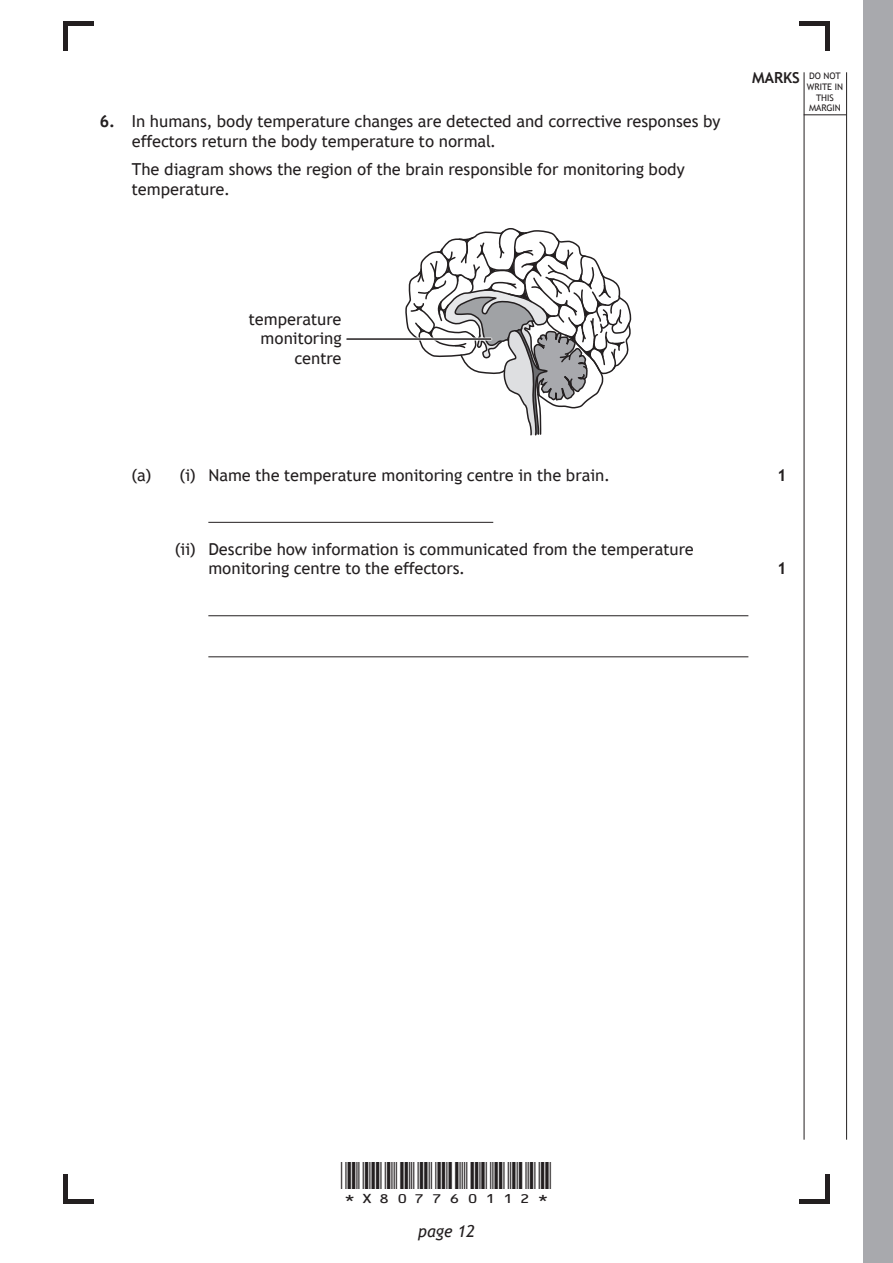
Selectable page text
MARKS _{W}^{D}_{R}^{O}_{I} _{T}^{N}OT
                                                                   E IN
                                                                  THIS
                                                                 MARGIN
6. In humans, body temperature changes are detected and corrective responses by
   effectors return the body temperature to normal.
   The diagram shows the region of the brain responsible for monitoring body
   temperature.

              temperature
               monitoring
                  centre

   (a)  (i) Name the temperature monitoring centre in the brain. 1

       (ii) Describe how information is communicated from the temperature
          monitoring centre to the effectors.                 1

                      *X807760112*

                             page 12
PDF page 13
Selectable page text
MARKS _{W}^{D}_{R}^{O}_{I} _{T}^{N}OT
                                                                   E IN
                                                                  THIS
                                                                 MARGIN
6. (continued)
   (b) Describe one corrective response that would take place in the human body
      when exposed to low temperatures and explain how this response helps to
      return body temperature to normal.                      2
      Corrective response

      Explanation

   (c) Explain the importance of thermoregulation in humans.  2

   (d) Name the mechanism used by humans to achieve homeostasis. 1

                                                     [Turn over

                      *X807760113*

                             page 13
PDF page 14
Paper 2, Question 7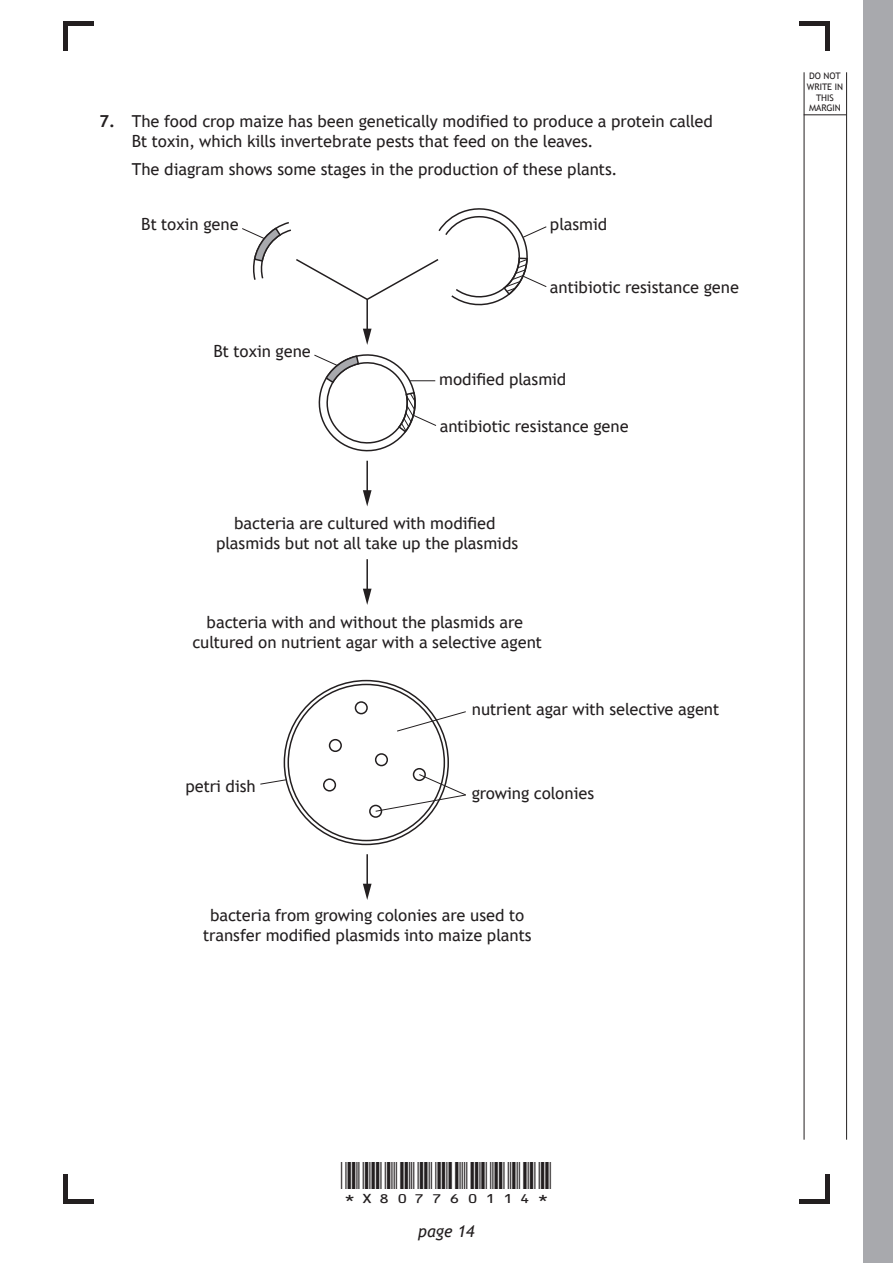
Selectable page text
DO NOT
                                                                 WRITE IN
                                                                  THIS
                                                                 MARGIN
7. The food crop maize has been genetically modified to produce a protein called
   Bt toxin, which kills invertebrate pests that feed on the leaves.
   The diagram shows some stages in the production of these plants.
    Bt toxin gene                         plasmid

                                          antibiotic resistance gene

           Bt toxin gene
                               modified plasmid

                               antibiotic resistance gene

             bacteria are cultured with modified
           plasmids but not all take up the plasmids

          bacteria with and without the plasmids are
         cultured on nutrient agar with a selective agent

                                  nutrient agar with selective agent

        petri dish
                                  growing colonies

          bacteria from growing colonies are used to
          transfer modified plasmids into maize plants

                      *X807760114*

                             page 14
PDF page 15
Selectable page text
MARKS _{W}^{D}_{R}^{O}_{I} _{T}^{N}OT
                                                                   E IN
                                                                  THIS
                                                                 MARGIN
7. (continued)
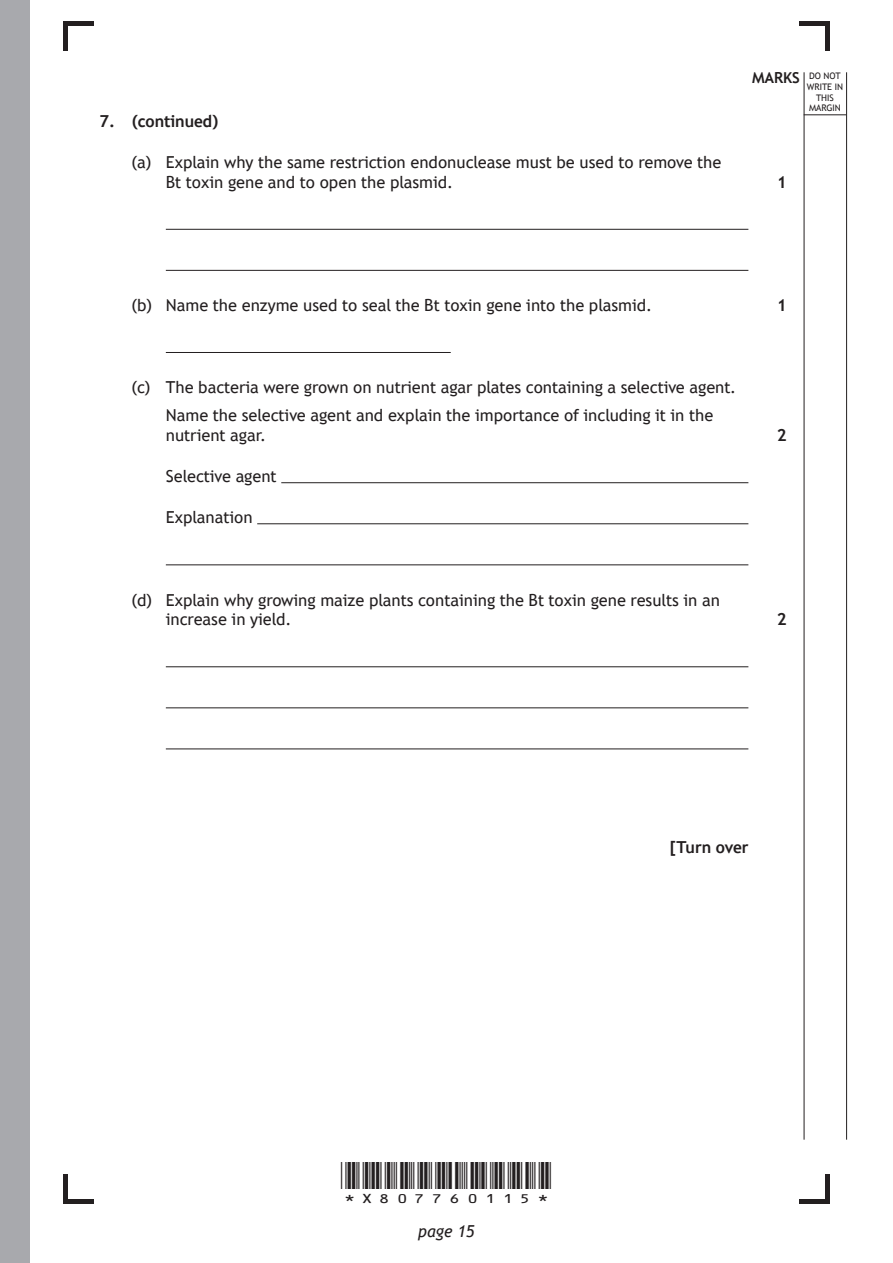
   (a) Explain why the same restriction endonuclease must be used to remove the
      Bt toxin gene and to open the plasmid.                  1

   (b) Name the enzyme used to seal the Bt toxin gene into the plasmid. 1

   (c) The bacteria were grown on nutrient agar plates containing a selective agent.
      Name the selective agent and explain the importance of including it in the
      nutrient agar.                                          2

      Selective agent

      Explanation

   (d) Explain why growing maize plants containing the Bt toxin gene results in an
      increase in yield.                                      2

                                                     [Turn over

                      *X807760115*

                             page 15
PDF page 16
Paper 2, Question 8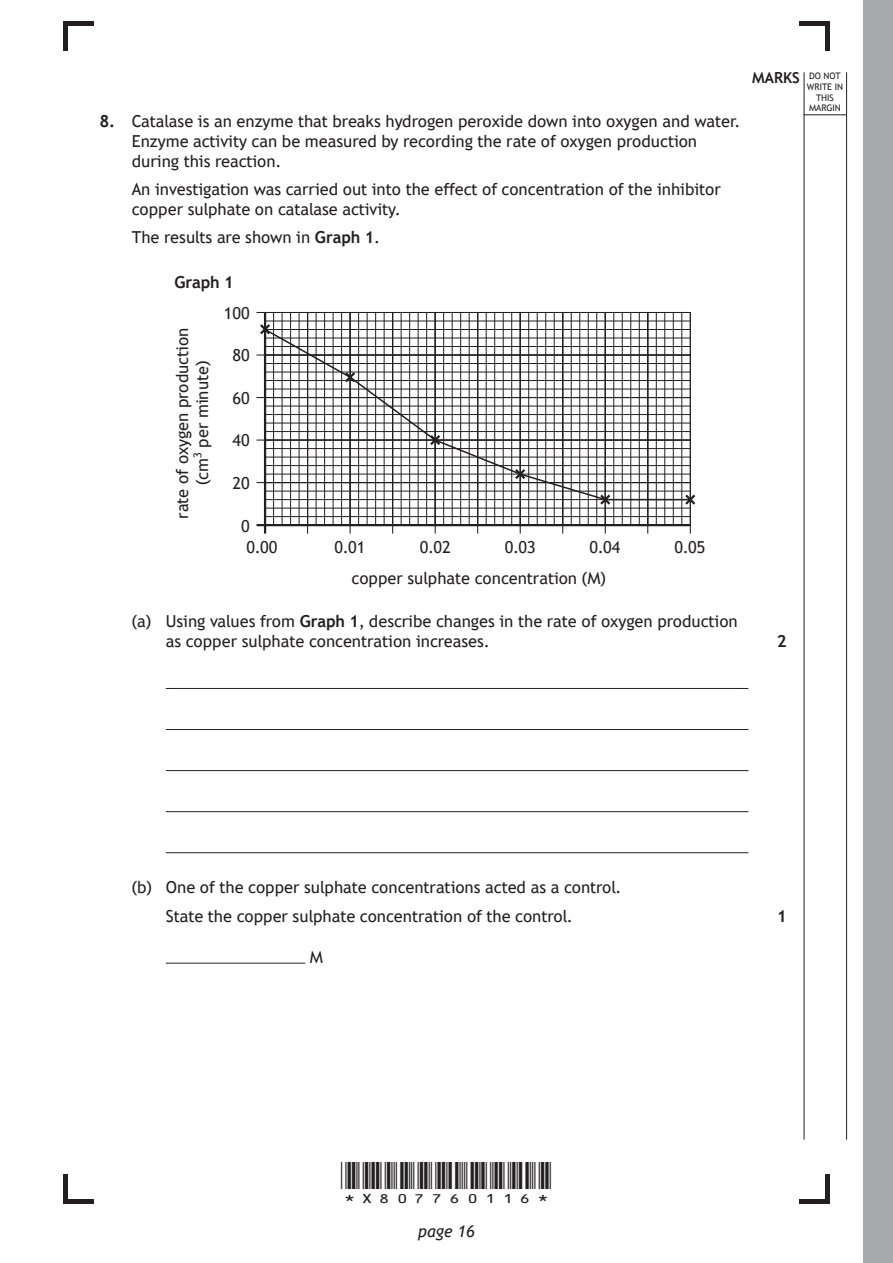
Selectable page text
MARKS _{W}^{D}_{R}^{O}_{I} _{T}^{N}OT
                                                                   E IN
                                                                  THIS
                                                                 MARGIN
8. Catalase is an enzyme that breaks hydrogen peroxide down into oxygen and water.
   Enzyme activity can be measured by recording the rate of oxygen production
   during this reaction.
   An investigation was carried out into the effect of concentration of the inhibitor
   copper sulphate on catalase activity.
   The results are shown in Graph 1.
       Graph 1

            100

            80

            60

            40

            20

             0

                       copper sulphate concentration (M)

                      *X807760116*

                             page 16
       noitcudorp
       negyxo
       fo
       etar
         )etunim
         rep
         3mc(
              0.00    0.01    0.02   0.03    0.04    0.05
   (a) Using values from Graph 1, describe changes in the rate of oxygen production
      as copper sulphate concentration increases.             2
   (b) One of the copper sulphate concentrations acted as a control.
      State the copper sulphate concentration of the control. 1
                   M
PDF page 17
Selectable page text
8. (continued)                                              MARKS _{W}^{D}_{R}^{O}_{I} _{T}^{N}OT
                                                                   E IN
                                                                  THIS
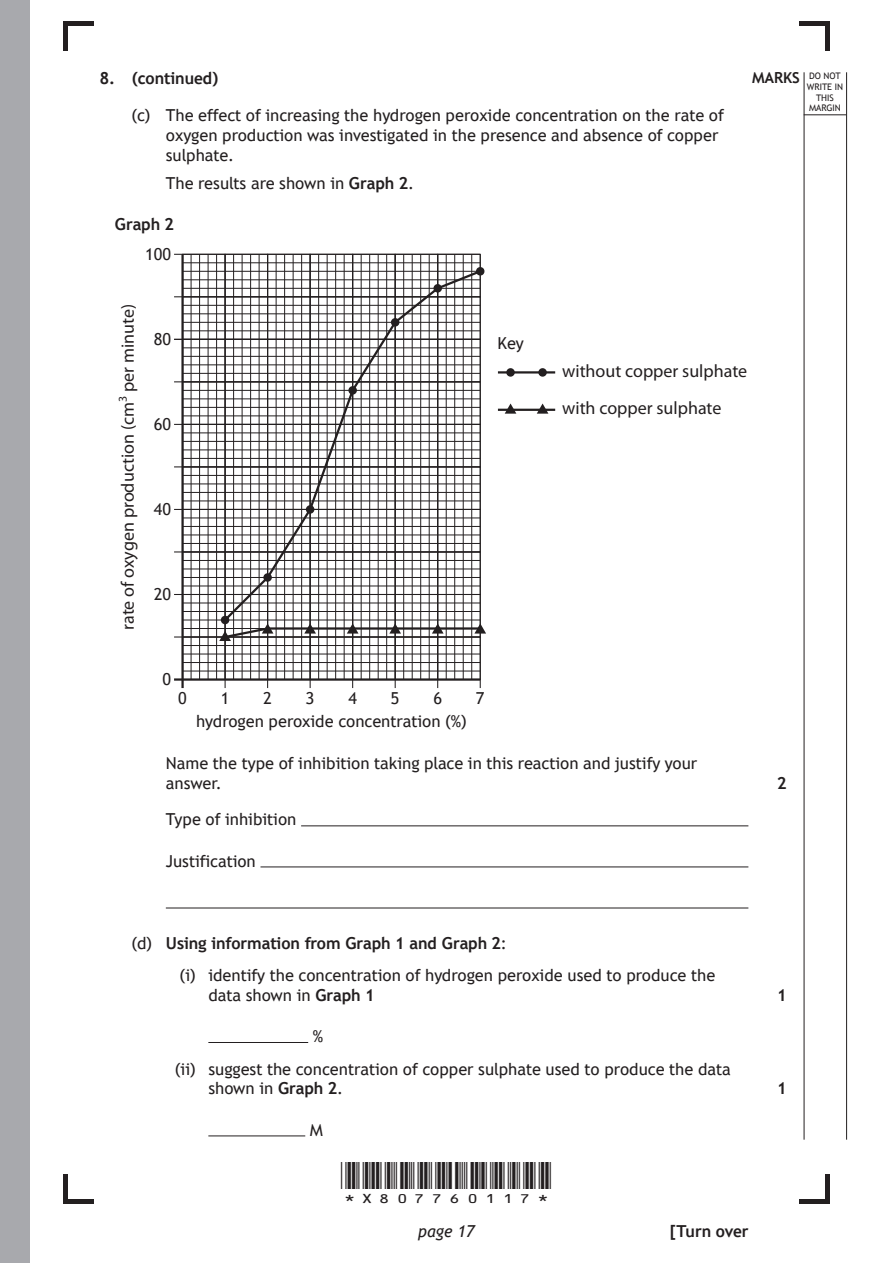
   (c) The effect of increasing the hydrogen peroxide concentration on the rate of MARGIN
      oxygen production was investigated in the presence and absence of copper
      sulphate.
      The results are shown in Graph 2.
  Graph 2

    100

     80

     60

     40

     20

      0

         hydrogen peroxide concentration (%)

                      *X807760117*

                             page 17
  )etunim
  rep
  3mc(
  noitcudorp
  negyxo
  fo
  etar
                                     Key
                                           without copper sulphate
                                           with copper sulphate
       0   1   2   3   4   5   6   7
      Name the type of inhibition taking place in this reaction and justify your
      answer.                                                 2
      Type of inhibition
      Justification
   (d) Using information from Graph 1 and Graph 2:
        (i) identify the concentration of hydrogen peroxide used to produce the
          data shown in Graph 1                               1
                    %
       (ii) suggest the concentration of copper sulphate used to produce the data
          shown in Graph 2.                                   1
                   M
                                                     [Turn over
PDF page 18
Paper 2, Question 9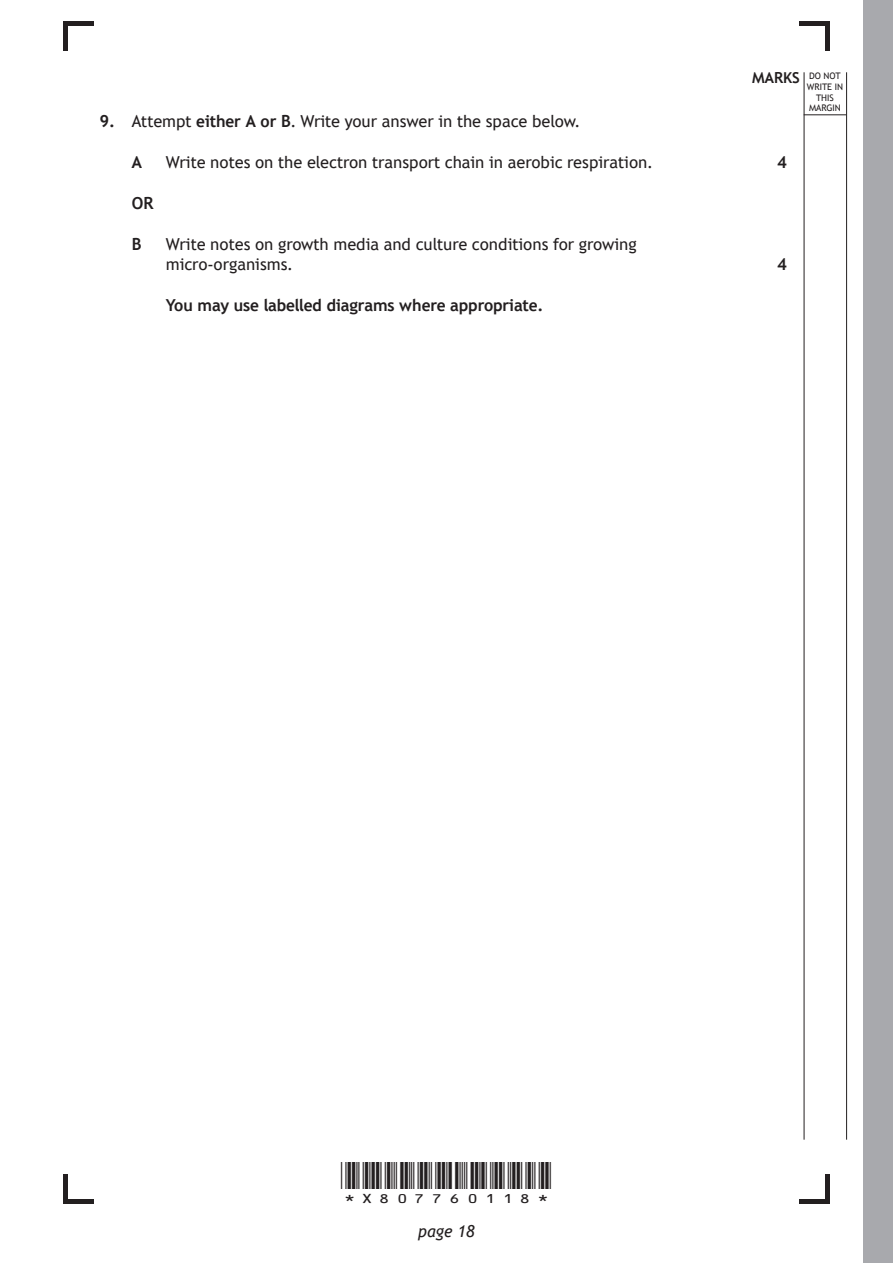
Selectable page text
MARKS _{W}^{D}_{R}^{O}_{I} _{T}^{N}OT
                                                                   E IN
                                                                  THIS
                                                                 MARGIN
9. Attempt either A or B. Write your answer in the space below.
   A  Write notes on the electron transport chain in aerobic respiration. 4
   OR

   B  Write notes on growth media and culture conditions for growing
      micro‑organisms.                                        4

      You may use labelled diagrams where appropriate.

                      *X807760118*

                             page 18
PDF page 19

Selectable page text
[Turn over for next question

DO NOT WRITE ON THIS PAGE

*X807760119*

       page 19
PDF page 20
Paper 2, Question 10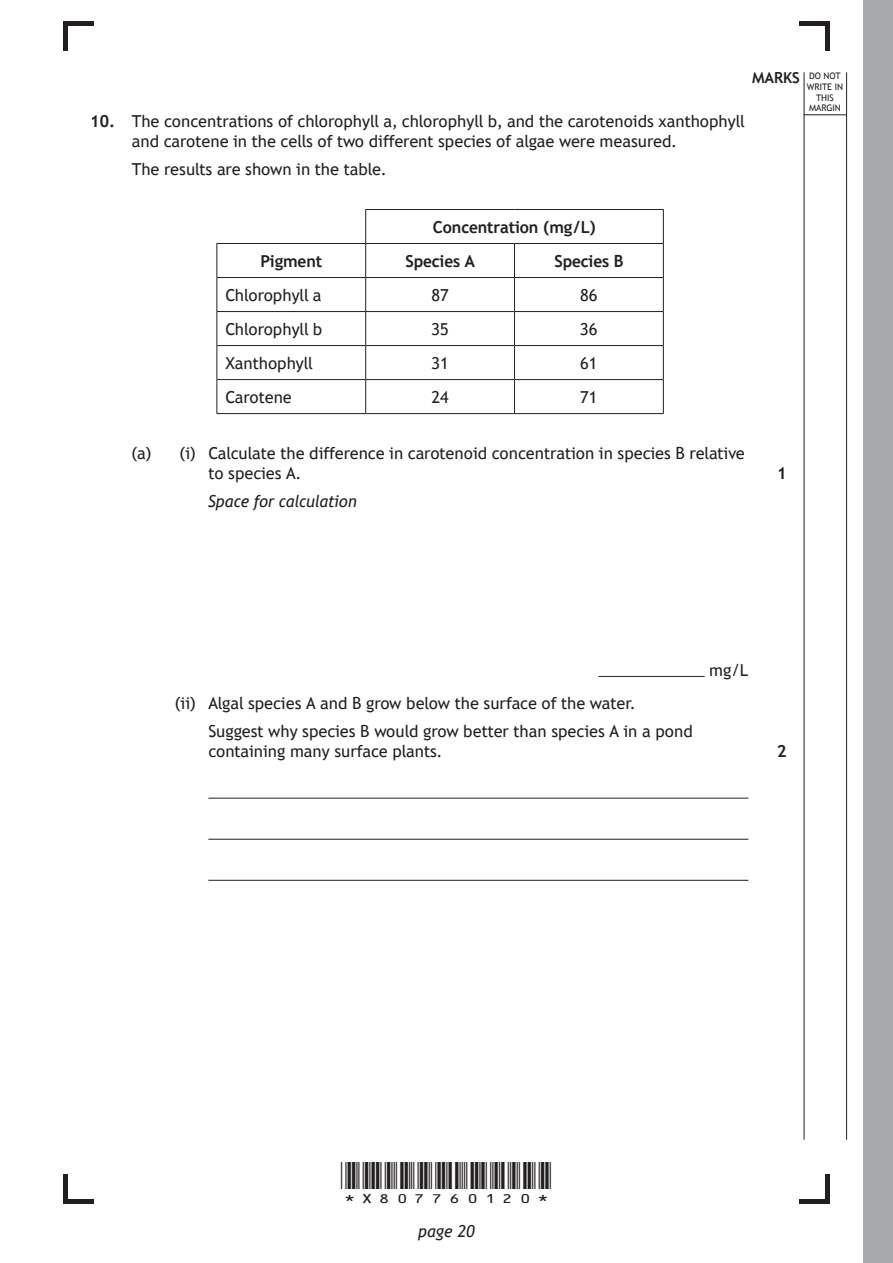
Selectable page text
MARKS _{W}^{D}_{R}^{O}_{I} _{T}^{N}OT
                                                                    E IN
                                                                   THIS
                                                                  MARGIN
10. The concentrations of chlorophyll a, chlorophyll b, and the carotenoids xanthophyll
    and carotene in the cells of two different species of algae were measured.
    The results are shown in the table.
                                Concentration (mg/L)

                Pigment      Species A     Species B

             Chlorophyll a      87           86

             Chlorophyll b      35           36
             Xanthophyll        31           61

             Carotene           24           71

    (a)  (i) Calculate the difference in carotenoid concentration in species B relative
           to species A.                                       1
           Space for calculation

                                               ����������������������� mg/L

        (ii) Algal species A and B grow below the surface of the water.
           Suggest why species B would grow better than species A in a pond
           containing many surface plants.                     2

                       *X807760120*

                              page 20
PDF page 21
Selectable page text
10. (continued)                                              MARKS _{W}^{D}_{R}^{O}_{I} _{T}^{N}OT
                                                                    E IN
                                                                   THIS
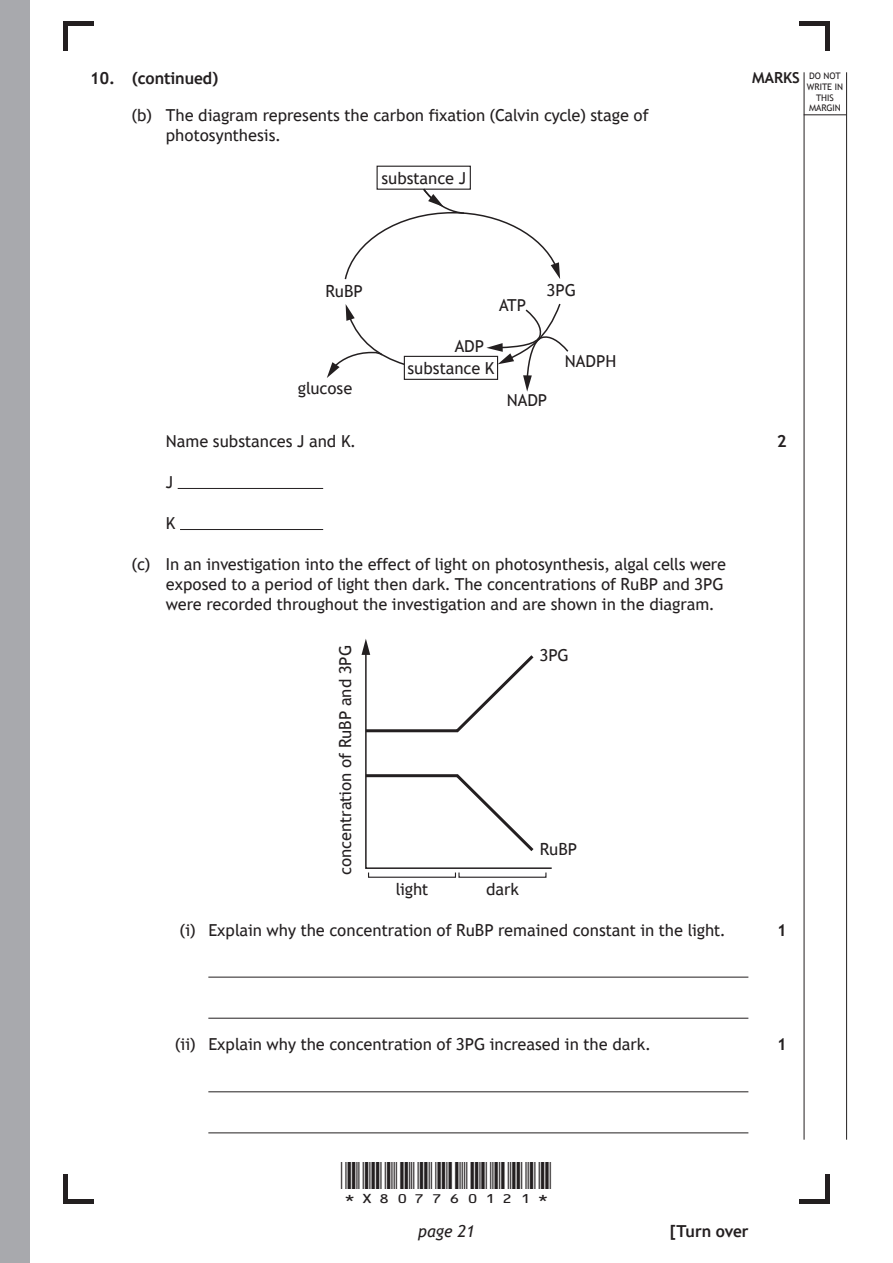
    (b) The diagram represents the carbon fixation (Calvin cycle) stage of MARGIN
       photosynthesis.
                           substance J

                      RuBP                3PG
                                      ATP
                                  ADP
                                            NADPH
                             substance K
                   glucose
                                       NADP
       Name substances J and K.

       J

       K

    (c) In an investigation into the effect of light on photosynthesis, algal cells were
       exposed to a period of light then dark. The concentrations of RuBP and 3PG
       were recorded throughout the investigation and are shown in the diagram.

                                          3PG

                                          RuBP

                            light

                       *X807760121*

                              page 21
                       GP3
                       dna
                       PBuR
                       fo
                       noitartnecnoc
                                                               2
                                     dark
         (i) Explain why the concentration of RuBP remained constant in the light. 1
        (ii) Explain why the concentration of 3PG increased in the dark. 1
                                                      [Turn over
PDF page 22
Paper 2, Question 11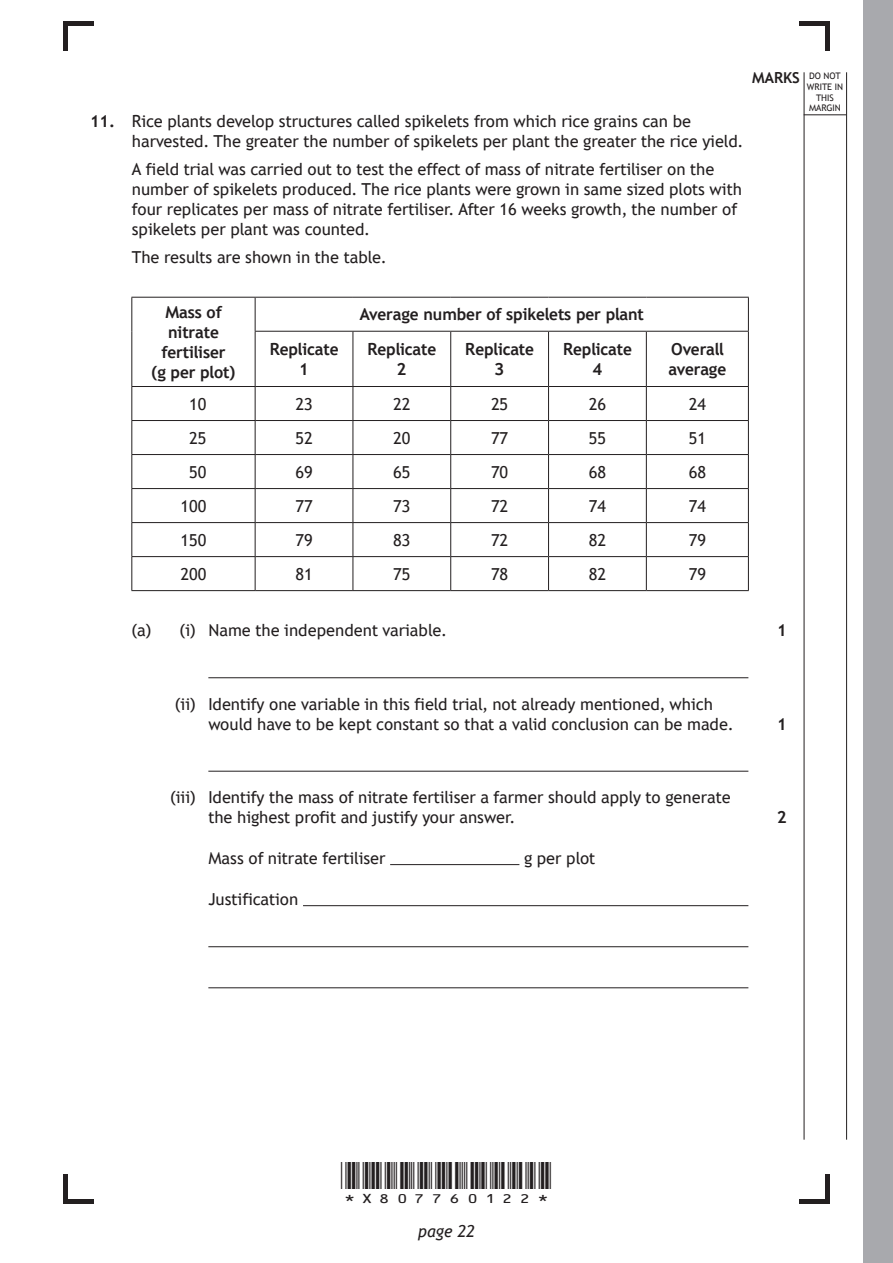
Selectable page text
MARKS _{W}^{D}_{R}^{O}_{I} _{T}^{N}OT
                                                                    E IN
                                                                   THIS
                                                                  MARGIN
11. Rice plants develop structures called spikelets from which rice grains can be
    harvested. The greater the number of spikelets per plant the greater the rice yield.
    A field trial was carried out to test the effect of mass of nitrate fertiliser on the
    number of spikelets produced. The rice plants were grown in same sized plots with
    four replicates per mass of nitrate fertiliser. After 16 weeks growth, the number of
    spikelets per plant was counted.
    The results are shown in the table.

       Mass of           Average number of spikelets per plant
       nitrate
       fertiliser Replicate Replicate Replicate Replicate Overall
      (g per plot)  1        2        3        4     average
         10        23       22       25       26       24

         25        52       20       77       55       51

         50        69       65       70       68       68

         100       77       73       72       74       74
         150       79       83       72       82       79

         200       81       75       78       82       79

    (a)  (i) Name the independent variable.                    1

        (ii) Identify one variable in this field trial, not already mentioned, which
           would have to be kept constant so that a valid conclusion can be made. 1

        (iii) Identify the mass of nitrate fertiliser a farmer should apply to generate
           the highest profit and justify your answer.         2

           Mass of nitrate fertiliser ���������������������������� g per plot

           Justification

                       *X807760122*

                              page 22
PDF page 23

Selectable page text
MARKS _{W}^{D}_{R}^{O}_{I} _{T}^{N}OT
                                                                    E IN
                                                                   THIS
                                                                  MARGIN
11. (continued)
    (b) On the grid, draw a line graph using the overall average results in the table.
       (Additional graph paper, if required, can be found on page 32.) 2

    (c) State the conclusion from the results of this field trial. 1

                                                      [Turn over

                       *X807760123*

                              page 23
PDF page 24
Paper 2, Question 12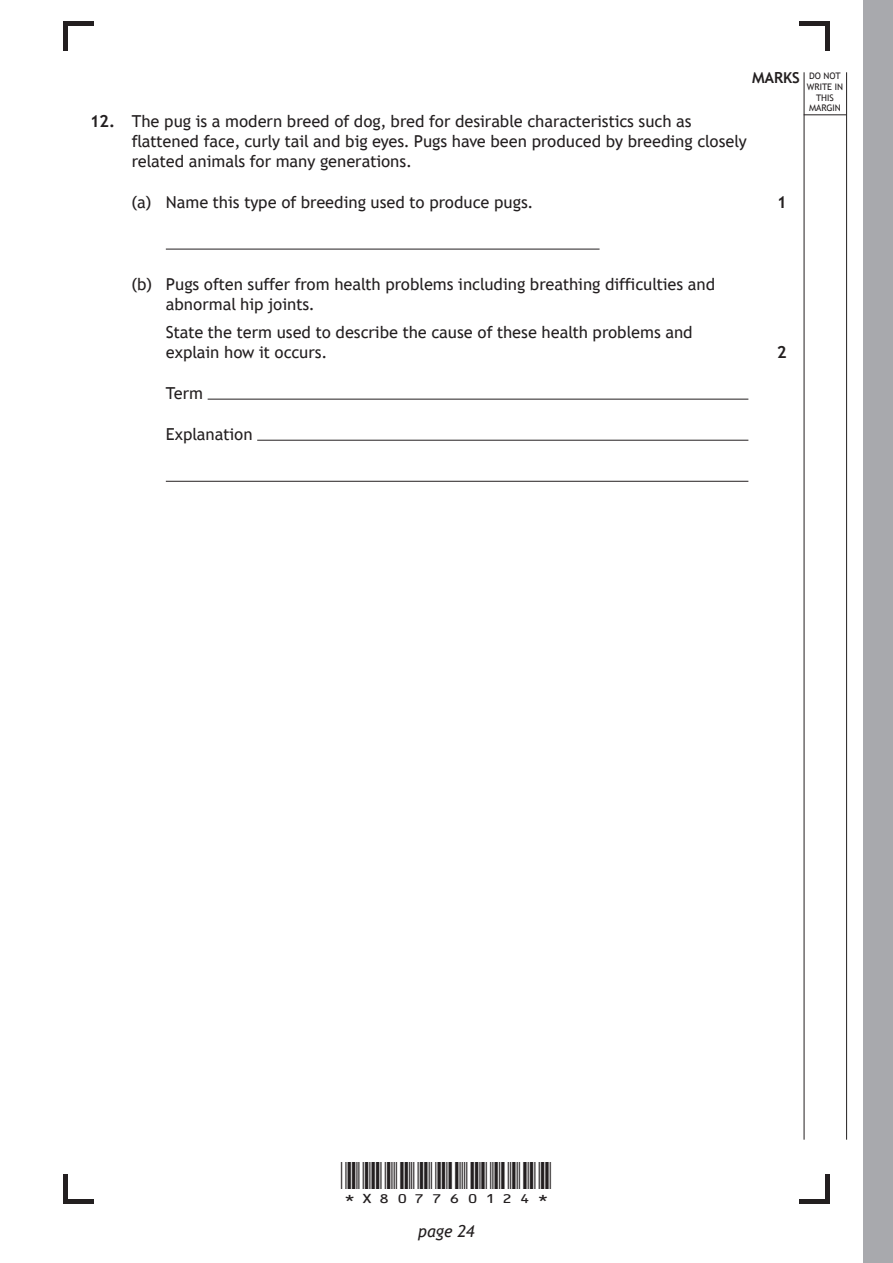
Selectable page text
MARKS _{W}^{D}_{R}^{O}_{I} _{T}^{N}OT
                                                                    E IN
                                                                   THIS
                                                                  MARGIN
12. The pug is a modern breed of dog, bred for desirable characteristics such as
    flattened face, curly tail and big eyes. Pugs have been produced by breeding closely
    related animals for many generations.
    (a) Name this type of breeding used to produce pugs.       1

    (b) Pugs often suffer from health problems including breathing difficulties and
       abnormal hip joints.

       State the term used to describe the cause of these health problems and
       explain how it occurs.                                  2

       Term

       Explanation

                       *X807760124*

                              page 24
PDF page 25
Selectable page text
MARKS _{W}^{D}_{R}^{O}_{I} _{T}^{N}OT
                                                                    E IN
                                                                   THIS
                                                                  MARGIN
12. (continued)
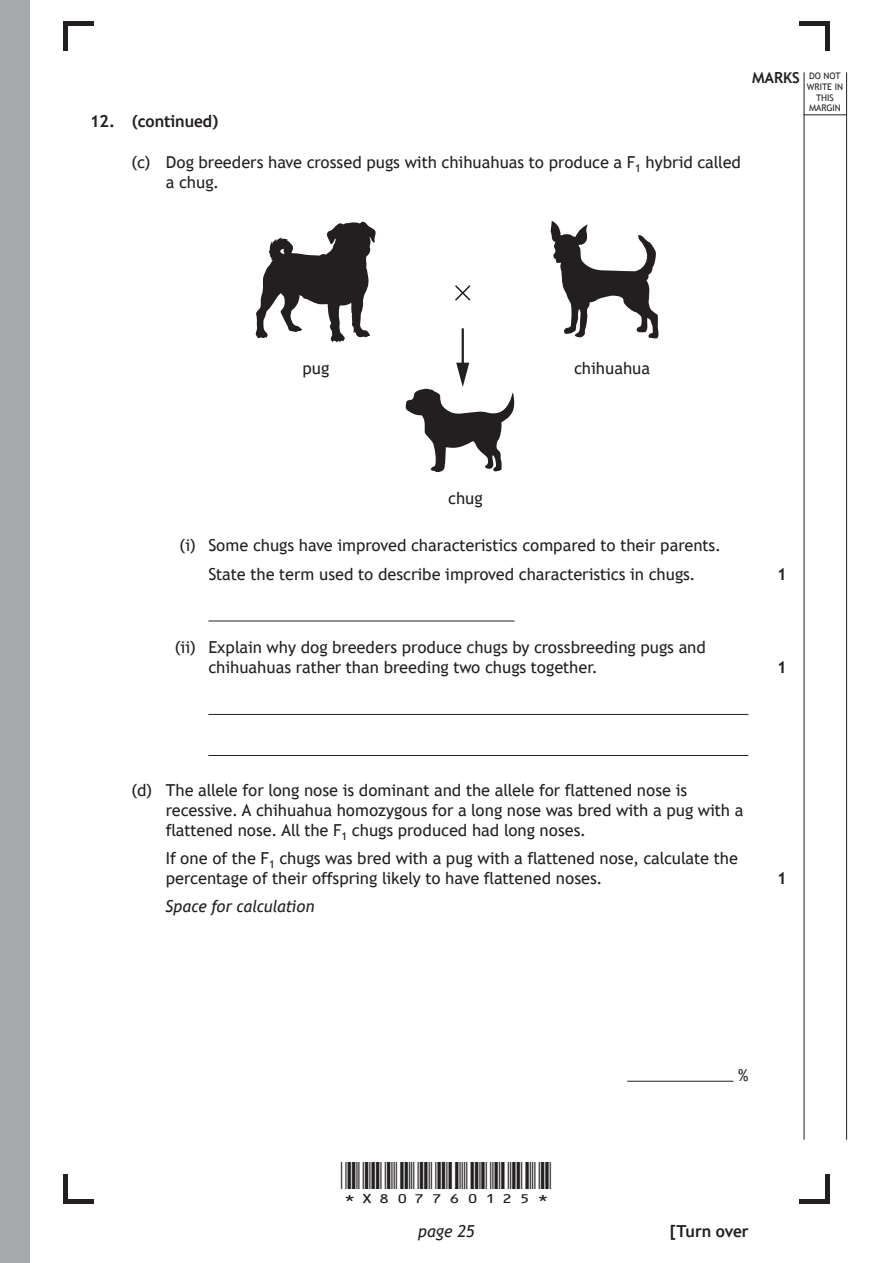
    (c) Dog breeders have crossed pugs with chihuahuas to produce a F₁ hybrid called
       a chug.

                    pug                      chihuahua

                                 chug

         (i) Some chugs have improved characteristics compared to their parents.
           State the term used to describe improved characteristics in chugs. 1

        (ii) Explain why dog breeders produce chugs by crossbreeding pugs and
           chihuahuas rather than breeding two chugs together. 1

    (d) The allele for long nose is dominant and the allele for flattened nose is
       recessive. A chihuahua homozygous for a long nose was bred with a pug with a
       flattened nose. All the F₁ chugs produced had long noses.

       If one of the F₁ chugs was bred with a pug with a flattened nose, calculate the
       percentage of their offspring likely to have flattened noses. 1
       Space for calculation

                                                  ����������������������� %

                       *X807760125*

                              page 25                 [Turn over
PDF page 26
Paper 2, Question 13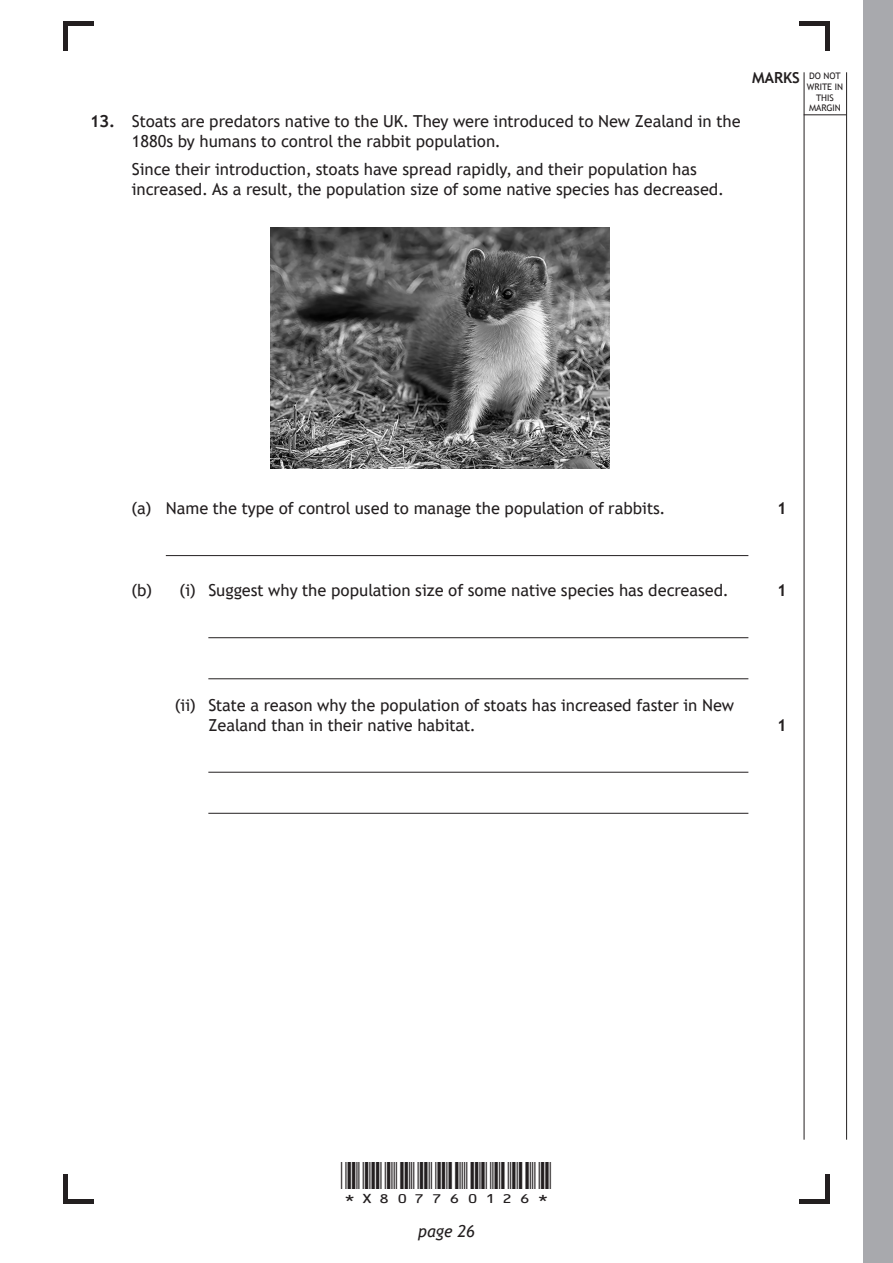
Selectable page text
MARKS _{W}^{D}_{R}^{O}_{I} _{T}^{N}OT
                                                                    E IN
                                                                   THIS
                                                                  MARGIN
13. Stoats are predators native to the UK. They were introduced to New Zealand in the
    1880s by humans to control the rabbit population.
    Since their introduction, stoats have spread rapidly, and their population has
    increased. As a result, the population size of some native species has decreased.

    (a) Name the type of control used to manage the population of rabbits. 1

    (b)  (i) Suggest why the population size of some native species has decreased. 1

        (ii) State a reason why the population of stoats has increased faster in New
           Zealand than in their native habitat.               1

                       *X807760126*

                              page 26
PDF page 27
Selectable page text
13. (continued)                                              MARKS _{W}^{D}_{R}^{O}_{I} _{T}^{N}OT
                                                                    E IN
                                                                   THIS
                                                                  MARGIN
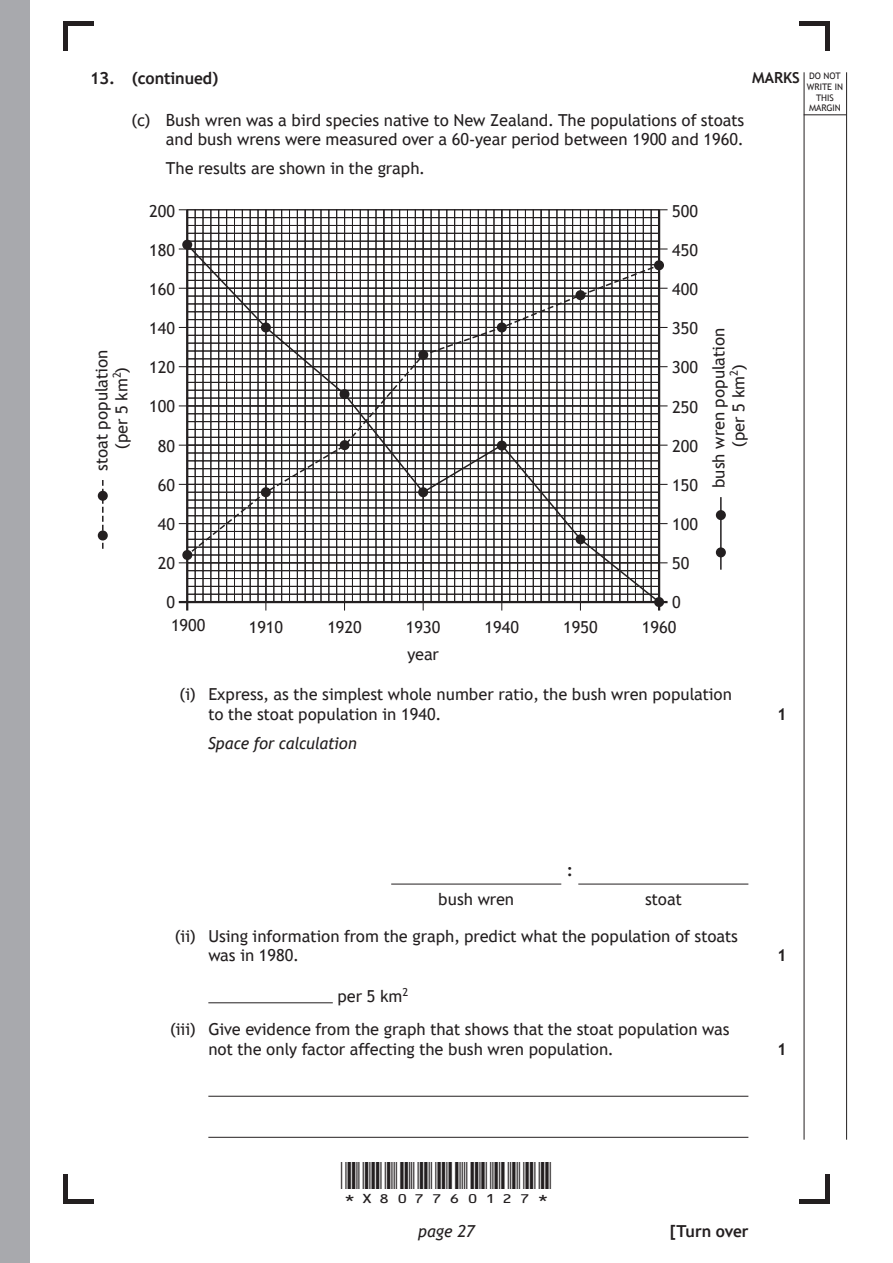
    (c) Bush wren was a bird species native to New Zealand. The populations of stoats
       and bush wrens were measured over a 60‑year period between 1900 and 1960.
       The results are shown in the graph.

                       *X807760127*

                              page 27
                                                         noitalupop
                                                         nerw
                                                         hsub
                                                           )2mk
                                                           5
                                                           rep(
      200                                             500
      180                                             450
      160                                             400
      140                                             350
      120                                             300
      100                                             250
       80                                             200
       60                                             150
       40                                             100
       20                                             50
       0                                              0
        1900   1910   1920   1930    1940   1950   1960
                             year
 noitalupop
 taots
  )2mk
   5
   rep(
         (i) Express, as the simplest whole number ratio, the bush wren population
           to the stoat population in 1940.                    1
           Space for calculation
                                            :
                                bush wren          stoat
        (ii) Using information from the graph, predict what the population of stoats
           was in 1980.                                        1
                       per 5 km²
        (iii) Give evidence from the graph that shows that the stoat population was
           not the only factor affecting the bush wren population. 1
                                                      [Turn over
PDF page 28

Selectable page text
MARKS _{W}^{D}_{R}^{O}_{I} _{T}^{N}OT
                                                                    E IN
                                                                   THIS
                                                                  MARGIN
13. (c) (continued)
        (iv) Stoats are an invasive species in New Zealand.
           Use evidence from the graph to justify this statement. 1

                       *X807760128*

                              page 28
PDF page 29
Paper 2, Question 14
Selectable page text
MARKS _{W}^{D}_{R}^{O}_{I} _{T}^{N}OT
                                                                    E IN
                                                                   THIS
                                                                  MARGIN
14. Attempt either A or B. Write your answer in the space below and on pages 30 and
    31.
    A  Write notes on crop productivity under the following headings:
         (i) problems with weeds and invertebrate pests        5
        (ii) chemical control.                                 3

    OR

    B  Write notes on interdependence under the following headings:
         (i) parasitism                                        5

        (ii) social insects.                                   3

       You may use labelled diagrams where appropriate.

                                                      [Turn over

                       *X807760129*

                              page 29
PDF page 30

Selectable page text
DO NOT
                                                    WRITE IN
                                                     THIS
                                                    MARGIN
ADDITIONAL SPACE FOR ANSWER to question 14

         *X807760130*

                page 30
PDF page 31

Selectable page text
DO NOT
                                                    WRITE IN
                                                     THIS
                                                    MARGIN
ADDITIONAL SPACE FOR ANSWER to question 14

          [END OF QUESTION PAPER]

         *X807760131*

                page 31
PDF page 32

Selectable page text
DO NOT
                                                                  WRITE IN
                                                                   THIS
                                                                  MARGIN
            ADDITIONAL SPACE FOR ANSWERS AND ROUGH WORK
Additional graph paper for question 11 (b)

                       *X807760132*

                              page 32
PDF page 33

Selectable page text
DO NOT
                                                      WRITE IN
                                                       THIS
                                                      MARGIN
ADDITIONAL SPACE FOR ANSWERS AND ROUGH WORK

           *X807760133*

                  page 33
PDF page 34

Selectable page text
DO NOT
                                                      WRITE IN
                                                       THIS
                                                      MARGIN
ADDITIONAL SPACE FOR ANSWERS AND ROUGH WORK

           *X807760134*

                  page 34
PDF page 35

Selectable page text
[BLANK PAGE]

DO NOT WRITE ON THIS PAGE

*X807760135*

       page 35
PDF page 36

Selectable page text
[BLANK PAGE]

                       DO NOT WRITE ON THIS PAGE

Acknowledgement of copyright
Question 4 LevelUpDigitalMedia/shutterstock.com
           Bonaime/shutterstock.com
Question 13 Paul Abrahams/shutterstock.com

                       *X807760136*

                              page 36