2024 Higher Biology - Paper 2 questions
Source: Scottish Qualifications Authority (SQA) / Qualifications Scotland. This is a StemInteract HTML companion, not an official HTML edition. Selectable text is supplied alongside original page images. Use the images or original PDF for equations, powers, fractions, vector notation, tables and diagrams; text extraction cannot fully preserve mathematical layout.
Jump to a question
PDF page 1
Selectable page text
FOR OFFICIAL USE
H
National
Qualications
Mark
2024
X807/76/01 Biology
Paper 2
WEDNESDAY, 15 MAY
10:10 AM – 12:30 PM
*X8077601*
Fill in these boxes and read what is printed below.
Full name of centre Town
Forename(s) Surname Number of seat
Date of birth
Day Month Year Scottish candidate number
Total marks — 95
Attempt ALL questions.
You may use a calculator.
Questions 9 and 15 contain a choice.
Write your answers clearly in the spaces provided in this booklet. Additional space for answers
and rough work is provided at the end of this booklet. If you use this space you must clearly
identify the question number you are attempting. Any rough work must be written in this
booklet. Score through your rough work when you have written your final copy.
Use blue or black ink.
Before leaving the examination room you must give this booklet to the Invigilator; if you do not,
you may lose all the marks for this paper.
©
*X807760101*
A/HTPPDF page 2
Paper 2, Question 1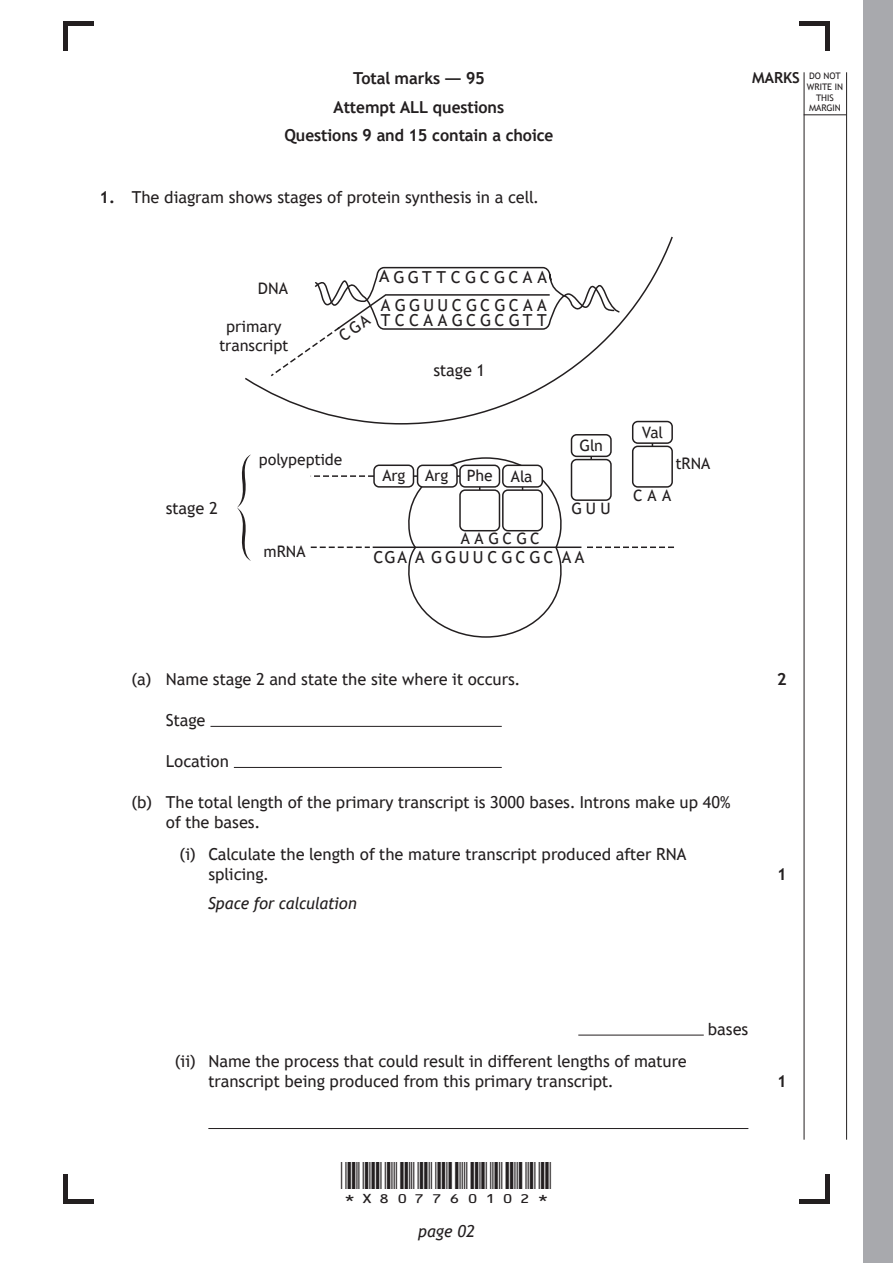
Selectable page text
Total marks — 95                     MARKS _{W}^{D}_{R}^{O}_{I} _{T}^{N}OT
                                                                   E IN
                                                                  THIS
                      Attempt ALL questions                      MARGIN
                 Questions 9 and 15 contain a choice

1. The diagram shows stages of protein synthesis in a cell.

                          AGGT T C GC GC A A
               DNA
                          A GGUUC GC GC A A
                        A T C C A A GC GC GT T
            primary    G
                      C
           transcript
                               stage 1
                                                  Val
                                            Gln
               polypeptide                           tRNA
                          Arg Arg Phe Ala
                                                 C A A
      stage 2                               GU U
                                 A A GC GC
               mRNA
                         CGA A GGUUC GC GC AA

   (a) Name stage 2 and state the site where it occurs.       2

      Stage

      Location

   (b) The total length of the primary transcript is 3000 bases. Introns make up 40%
      of the bases.
        (i) Calculate the length of the mature transcript produced after RNA
          splicing.                                           1

          Space for calculation

                                                        bases

       (ii) Name the process that could result in different lengths of mature
          transcript being produced from this primary transcript. 1

                      *X807760102*

                             page 02
PDF page 3
Selectable page text
1. (continued)                                              MARKS _{W}^{D}_{R}^{O}_{I} _{T}^{N}OT
                                                                   E IN
                                                                  THIS
                                                                 MARGIN
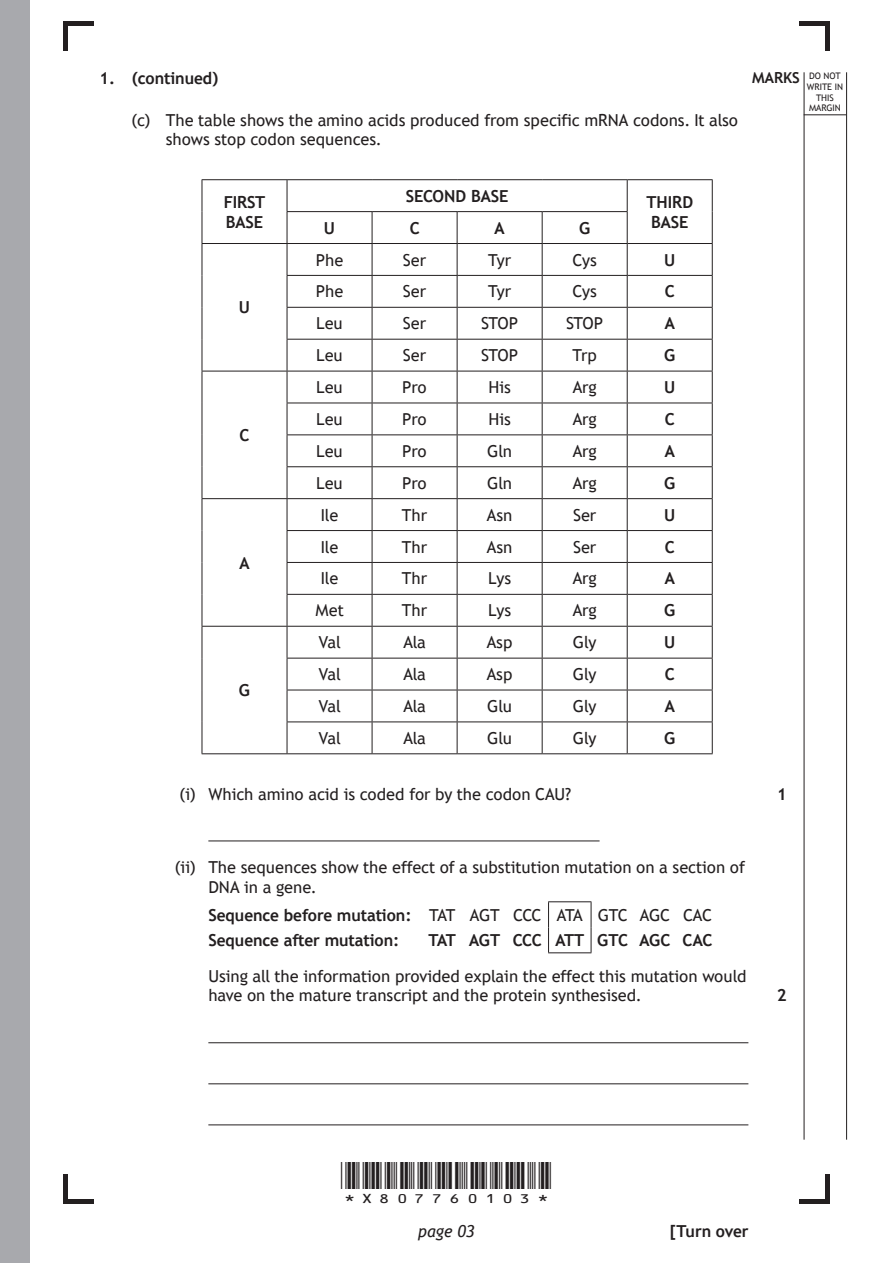
   (c) The table shows the amino acids produced from specific mRNA codons. It also
      shows stop codon sequences.
                            SECOND BASE
            FIRST                                 THIRD
            BASE                                   BASE
                     U       C      A       G
                    Phe     Ser     Tyr     Cys     U
                    Phe     Ser     Tyr     Cys     C
             U
                    Leu     Ser    STOP    STOP     A
                    Leu     Ser    STOP     Trp     G

                    Leu     Pro     His     Arg     U
                    Leu     Pro     His     Arg     C
             C
                    Leu     Pro     Gln     Arg     A
                    Leu     Pro     Gln     Arg     G

                    Ile     Thr     Asn     Ser     U

                    Ile     Thr     Asn     Ser     C
             A
                    Ile     Thr     Lys     Arg     A
                    Met     Thr     Lys     Arg     G

                    Val     Ala     Asp     Gly     U
                    Val     Ala     Asp     Gly     C
             G
                    Val     Ala     Glu     Gly     A

                    Val     Ala     Glu     Gly     G

        (i) Which amino acid is coded for by the codon CAU?   1

       (ii) The sequences show the effect of a substitution mutation on a section of
          DNA in a gene.

          Sequence before mutation: TAT AGT CCC ATA GTC AGC CAC
          Sequence after mutation: TAT AGT CCC ATT GTC AGC CAC

          Using all the information provided explain the effect this mutation would
          have on the mature transcript and the protein synthesised. 2

                      *X807760103*

                             page 03                 [Turn over
PDF page 4
Paper 2, Question 2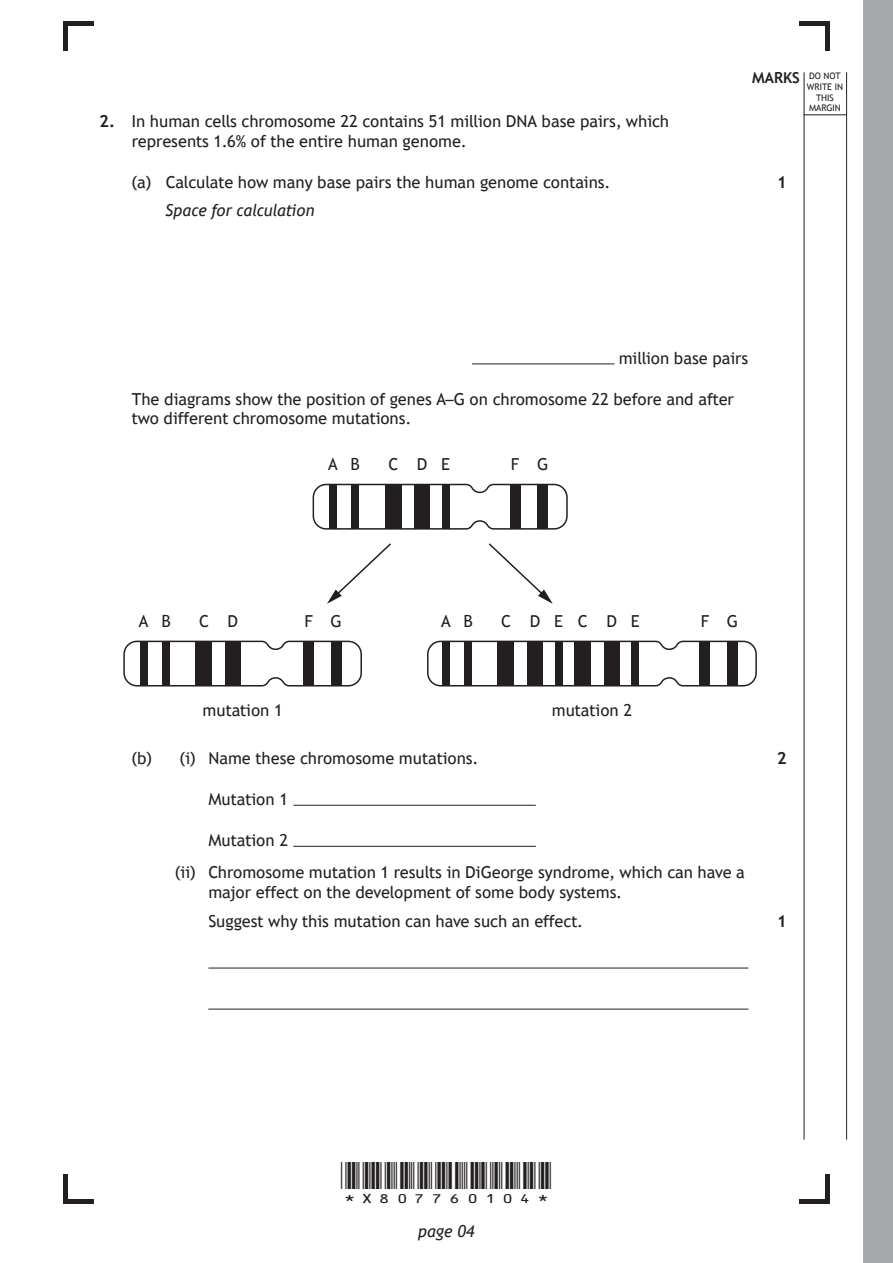
Selectable page text
MARKS _{W}^{D}_{R}^{O}_{I} _{T}^{N}OT
                                                                   E IN
                                                                  THIS
                                                                 MARGIN
2. In human cells chromosome 22 contains 51 million DNA base pairs, which
   represents 1.6% of the entire human genome.
   (a) Calculate how many base pairs the human genome contains. 1
      Space for calculation

                                                million base pairs

   The diagrams show the position of genes A–G on chromosome 22 before and after
   two different chromosome mutations.

                     A B   C D  E     F G

    A B  C  D      F G          A B  C  D E C  D E     F  G

          mutation 1                      mutation 2

   (b)  (i) Name these chromosome mutations.                  2

          Mutation 1

          Mutation 2
       (ii) Chromosome mutation 1 results in DiGeorge syndrome, which can have a
          major effect on the development of some body systems.

          Suggest why this mutation can have such an effect.  1

                      *X807760104*

                             page 04
PDF page 5

Selectable page text
MARKS _{W}^{D}_{R}^{O}_{I} _{T}^{N}OT
                                                                   E IN
                                                                  THIS
                                                                 MARGIN
2. (continued)
   (c)  (i) Describe how mutation 2 has occurred.             1

       (ii) Explain why this type of chromosome mutation can be important in
          evolution.                                          2

                                                     [Turn over

                      *X807760105*

                             page 05
PDF page 6
Paper 2, Question 3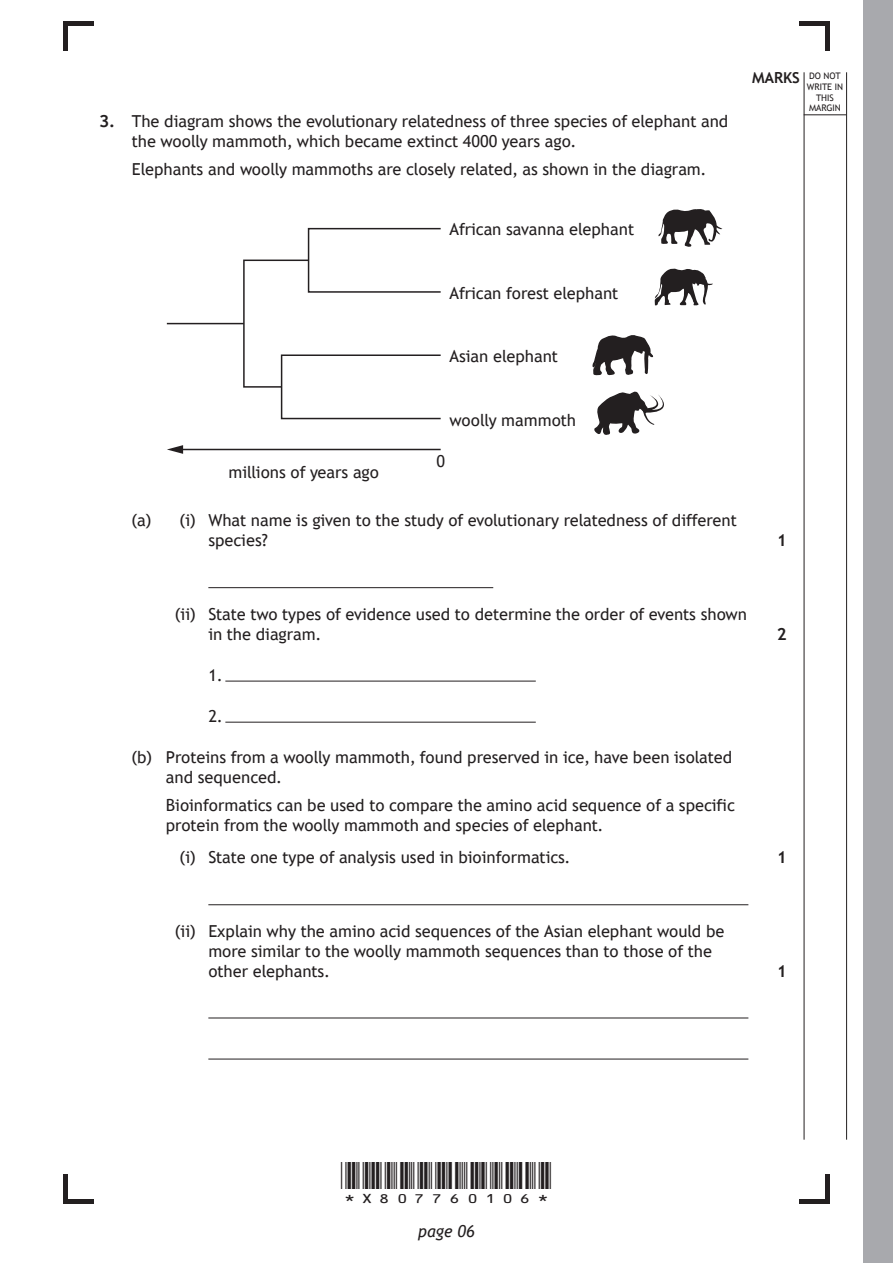
Selectable page text
MARKS _{W}^{D}_{R}^{O}_{I} _{T}^{N}OT
                                                                   E IN
                                                                  THIS
                                                                 MARGIN
3. The diagram shows the evolutionary relatedness of three species of elephant and
   the woolly mammoth, which became extinct 4000 years ago.
   Elephants and woolly mammoths are closely related, as shown in the diagram.
                                African savanna elephant

                                African forest elephant

                                Asian elephant

                                woolly mammoth

                               0
            millions of years ago

   (a)  (i) What name is given to the study of evolutionary relatedness of different
          species?                                            1

       (ii) State two types of evidence used to determine the order of events shown
          in the diagram.                                     2

          1.

          2.

   (b) Proteins from a woolly mammoth, found preserved in ice, have been isolated
      and sequenced.

      Bioinformatics can be used to compare the amino acid sequence of a specific
      protein from the woolly mammoth and species of elephant.

        (i) State one type of analysis used in bioinformatics. 1

       (ii) Explain why the amino acid sequences of the Asian elephant would be
          more similar to the woolly mammoth sequences than to those of the
          other elephants.                                    1

                      *X807760106*

                             page 06
PDF page 7
Paper 2, Question 4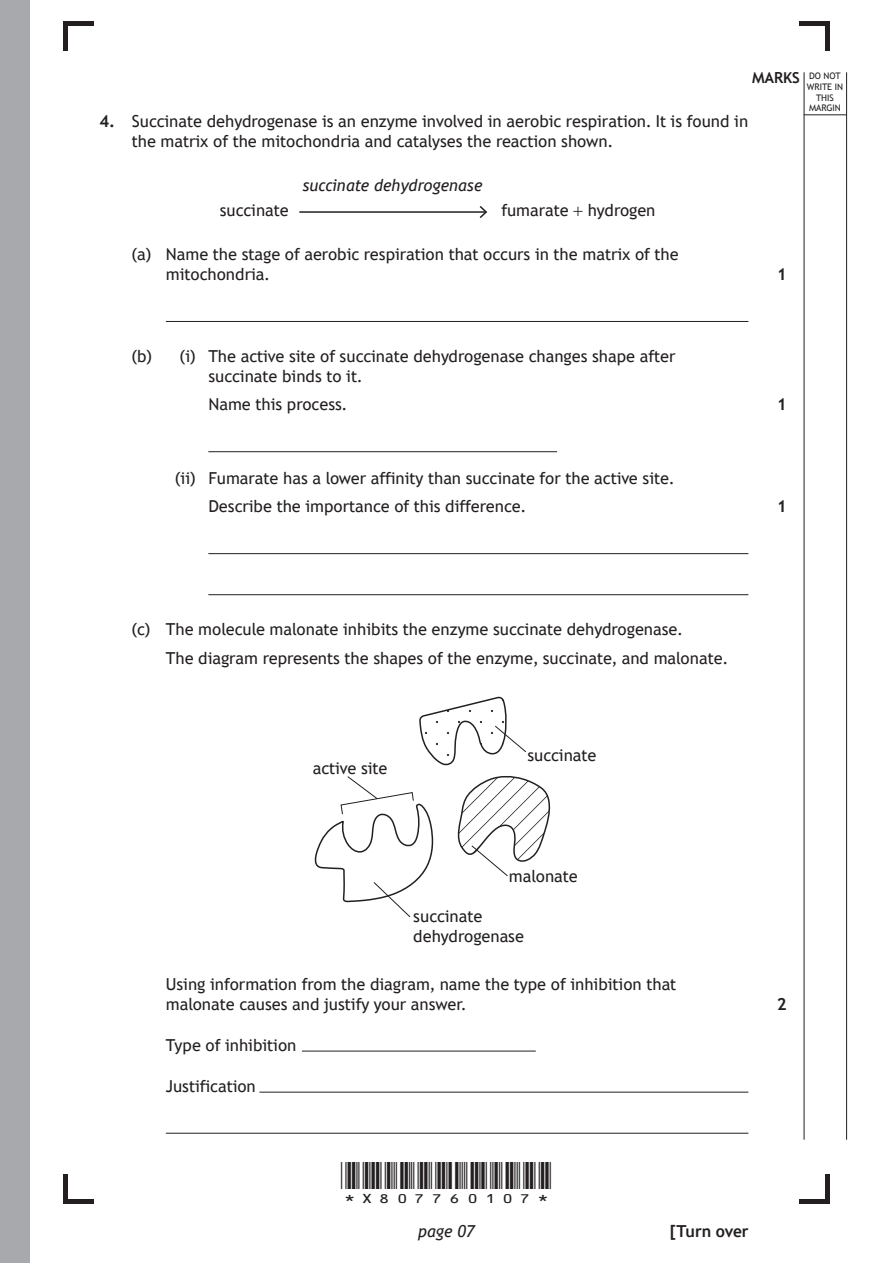
Selectable page text
MARKS _{W}^{D}_{R}^{O}_{I} _{T}^{N}OT
                                                                   E IN
                                                                  THIS
                                                                 MARGIN
4. Succinate dehydrogenase is an enzyme involved in aerobic respiration. It is found in
   the matrix of the mitochondria and catalyses the reaction shown.
                   succinate dehydrogenase
           succinate                 fumarate + hydrogen

   (a) Name the stage of aerobic respiration that occurs in the matrix of the
      mitochondria.                                           1

   (b)  (i) The active site of succinate dehydrogenase changes shape after
          succinate binds to it.
          Name this process.                                  1

       (ii) Fumarate has a lower affinity than succinate for the active site.

          Describe the importance of this difference.         1

   (c) The molecule malonate inhibits the enzyme succinate dehydrogenase.
      The diagram represents the shapes of the enzyme, succinate, and malonate.

                                       succinate
                    active site

                                      malonate

                             succinate
                             dehydrogenase

      Using information from the diagram, name the type of inhibition that
      malonate causes and justify your answer.                2

      Type of inhibition

      Justification

                      *X807760107*

                             page 07                 [Turn over
PDF page 8
Paper 2, Question 5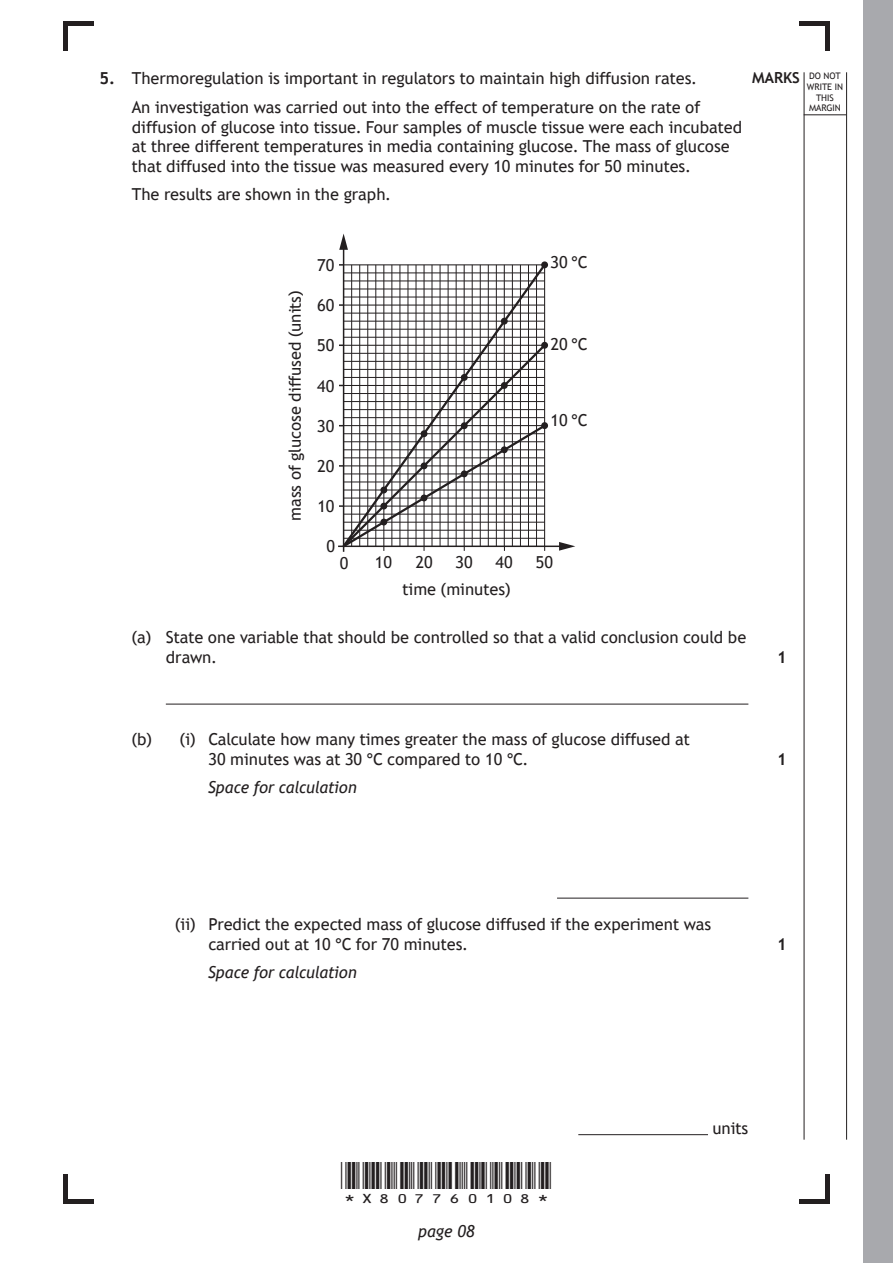
Selectable page text
5. Thermoregulation is important in regulators to maintain high diffusion rates. MARKS _{W}^{D}_{R}^{O}_{I} _{T}^{N}OT
                                                                   E IN
                                                                  THIS
   An investigation was carried out into the effect of temperature on the rate of MARGIN
   diffusion of glucose into tissue. Four samples of muscle tissue were each incubated
   at three different temperatures in media containing glucose. The mass of glucose
   that diffused into the tissue was measured every 10 minutes for 50 minutes.
   The results are shown in the graph.

                    70                    30 °C

                    60

                    50                    20 °C

                    40

                                          10 °C
                    30

                    20

                    10

                     0
                      0  10  20  30  40 50
                            time (minutes)

                      *X807760108*

                             page 08
                  )stinu(
                  desuffid
                  esoculg
                  fo
                  ssam
   (a) State one variable that should be controlled so that a valid conclusion could be
      drawn.                                                  1
   (b)  (i) Calculate how many times greater the mass of glucose diffused at
          30 minutes was at 30 °C compared to 10 °C.          1
          Space for calculation
       (ii) Predict the expected mass of glucose diffused if the experiment was
          carried out at 10 °C for 70 minutes.                1
          Space for calculation
                                                         units
PDF page 9
Selectable page text
MARKS _{W}^{D}_{R}^{O}_{I} _{T}^{N}OT
                                                                   E IN
                                                                  THIS
                                                                 MARGIN
5. (continued)
   (c) Suggest why high diffusion rates are important for regulators. 2

   (d) Regulators increase their metabolic rate when there is a decrease in body
      temperature.
      Describe one other corrective response to a decrease in body temperature.
      Explain how this response returns body temperature to normal. 2

      Description

      Explanation

                                                     [Turn over

                      *X807760109*

                             page 09
PDF page 10
Paper 2, Question 6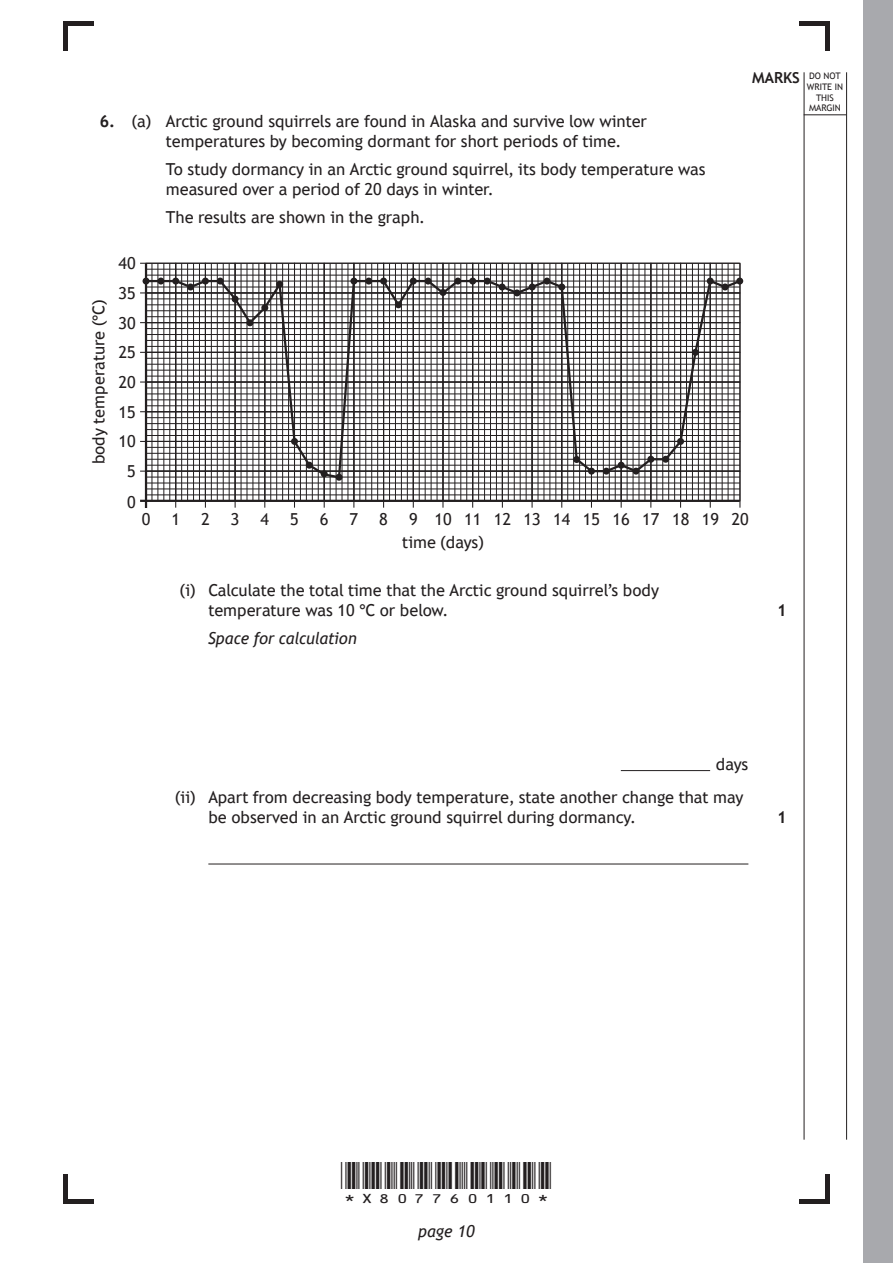
Selectable page text
MARKS _{W}^{D}_{R}^{O}_{I} _{T}^{N}OT
                                                                    E IN
                                                                   THIS
                                                                  MARGIN
 6. (a) Arctic ground squirrels are found in Alaska and survive low winter
       temperatures by becoming dormant for short periods of time.
       To study dormancy in an Arctic ground squirrel, its body temperature was
       measured over a period of 20 days in winter.
       The results are shown in the graph.
   40

   35
   30

   25
   20

   15
   10

    5
    0
     0  1 2  3  4  5 6  7  8  9 10 11 12 13 14 15 16 17 18 19 20
                             time (days)

                       *X807760110*

                              page 10
)C°(
erutarepmet
ydob
         (i) Calculate the total time that the Arctic ground squirrel’s body
           temperature was 10 °C or below.                     1
           Space for calculation
                                                          days
        (ii) Apart from decreasing body temperature, state another change that may
           be observed in an Arctic ground squirrel during dormancy. 1
PDF page 11
Selectable page text
6. (continued)                                              MARKS _{W}^{D}_{R}^{O}_{I} _{T}^{N}OT
                                                                   E IN
                                                                  THIS
                                                                 MARGIN
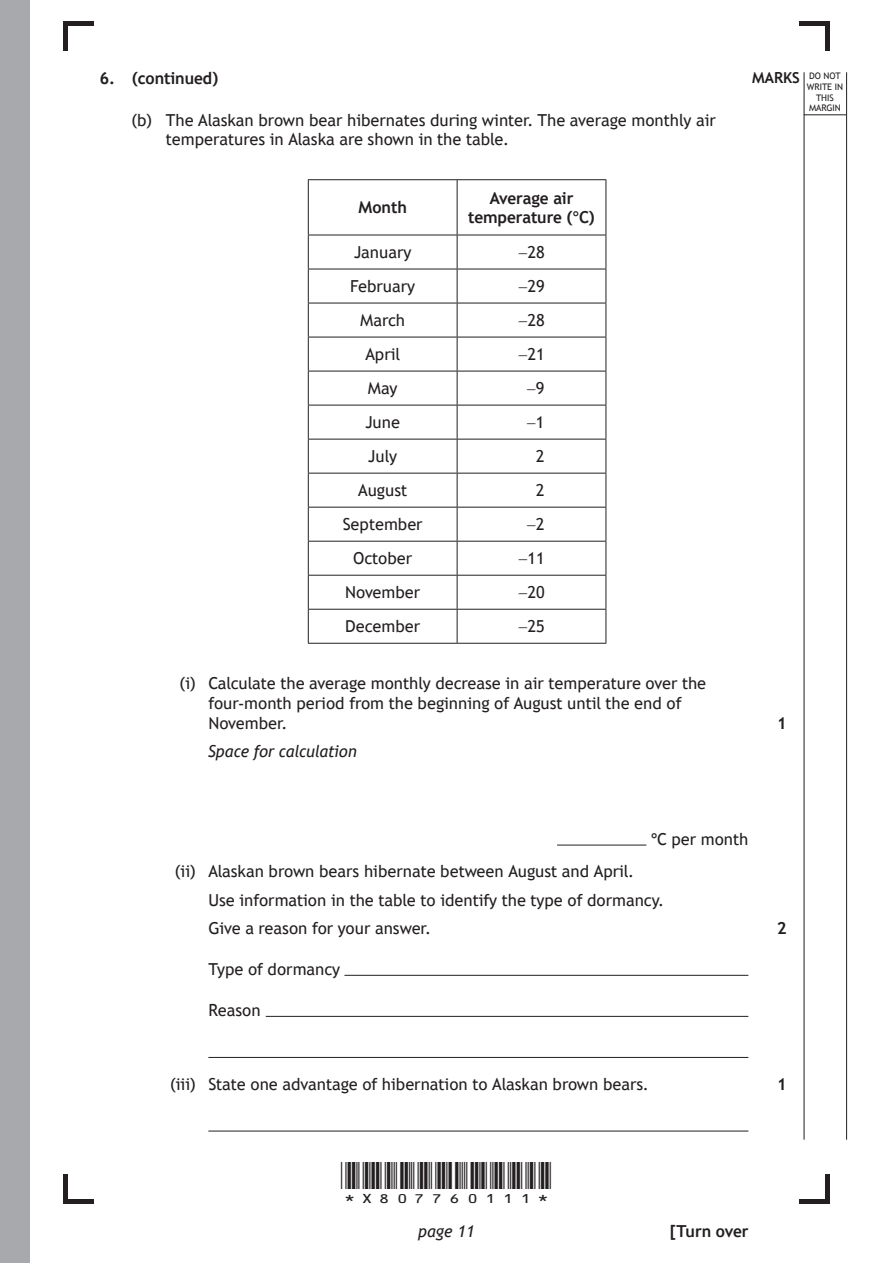
   (b) The Alaskan brown bear hibernates during winter. The average monthly air
      temperatures in Alaska are shown in the table.
                                    Average air
                        Month
                                  temperature (°C)
                        January        −28
                       February        −29

                        March          −28

                         April         −21

                         May           −9
                         June          −1

                         July           2

                        August          2

                       September       −2
                       October         −11

                       November        −20

                       December        −25

        (i) Calculate the average monthly decrease in air temperature over the
          four‑month period from the beginning of August until the end of
          November.                                           1
          Space for calculation

                                                   °C per month
       (ii) Alaskan brown bears hibernate between August and April.

          Use information in the table to identify the type of dormancy.
          Give a reason for your answer.                      2

          Type of dormancy

          Reason

       (iii) State one advantage of hibernation to Alaskan brown bears. 1

                      *X807760111*

                             page 11                 [Turn over
PDF page 12
Paper 2, Question 7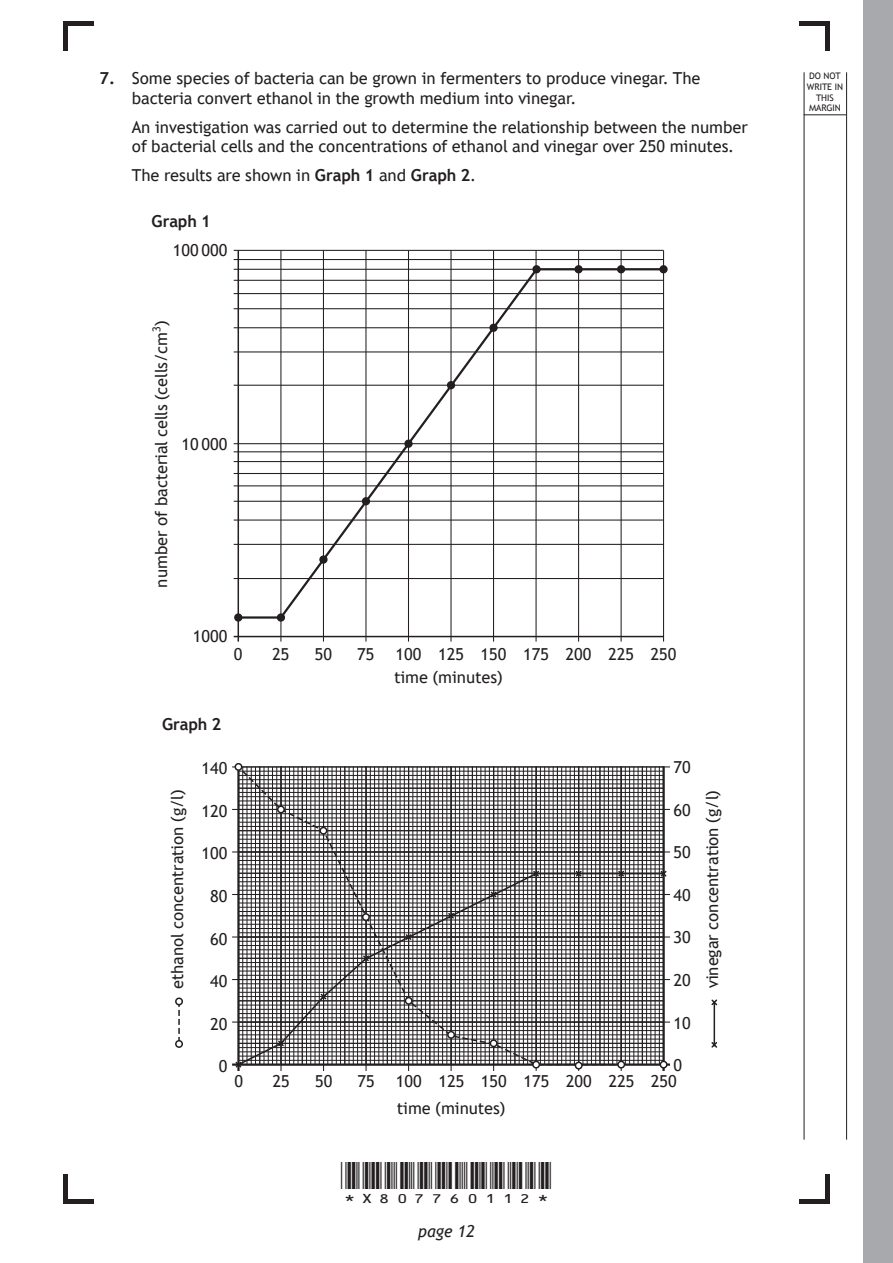
Selectable page text
7. Some species of bacteria can be grown in fermenters to produce vinegar. The DO NOT
                                                                 WRITE IN
   bacteria convert ethanol in the growth medium into vinegar.    THIS
                                                                 MARGIN
   An investigation was carried out to determine the relationship between the number
   of bacterial cells and the concentrations of ethanol and vinegar over 250 minutes.
   The results are shown in Graph 1 and Graph 2.
     Graph 1
       100 000

        10 000

         1000
             0  25  50  75 100 125 150 175 200 225 250
                           time (minutes)

                      *X807760112*

                             page 12
     )3mc/sllec(
     sllec
     lairetcab
     fo
     rebmun
      Graph 2
          140                                        70
          120                                        60
          100                                        50
          80                                         40
          60                                         30
          40                                         20
          20                                         10
           0                                         0
             0  25  50  75 100 125
                            time (minutes)
                                                        )l/g(
                                                        noitartnecnoc
                                                        rageniv
                                   150 175 200 225 250
       )l/g(
       noitartnecnoc
       lonahte
PDF page 13
Selectable page text
MARKS _{W}^{D}_{R}^{O}_{I} _{T}^{N}OT
                                                                   E IN
                                                                  THIS
                                                                 MARGIN
7. (continued)
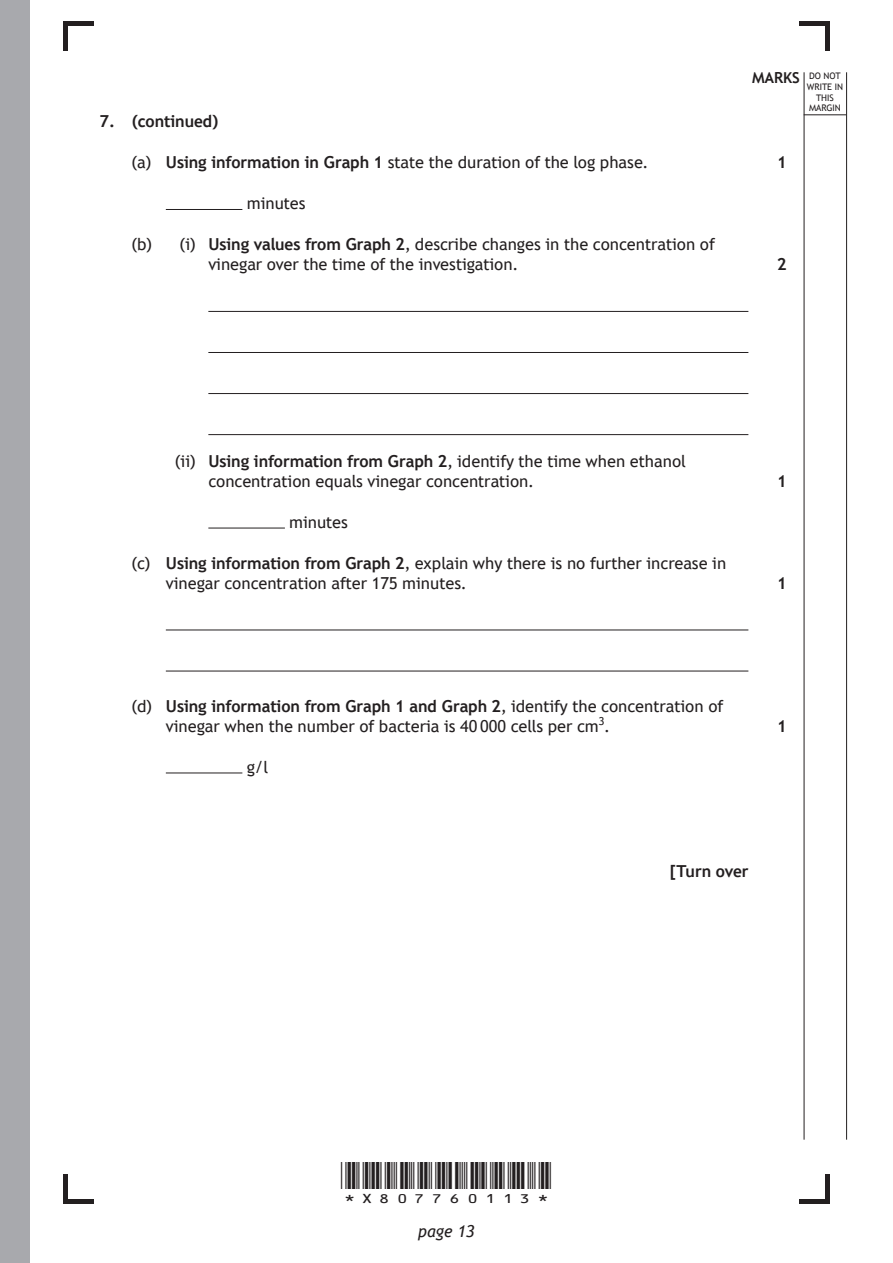
   (a) Using information in Graph 1 state the duration of the log phase. 1
              minutes

   (b)  (i) Using values from Graph 2, describe changes in the concentration of
          vinegar over the time of the investigation.         2

       (ii) Using information from Graph 2, identify the time when ethanol
          concentration equals vinegar concentration.         1

                  minutes

   (c) Using information from Graph 2, explain why there is no further increase in
      vinegar concentration after 175 minutes.                1

   (d) Using information from Graph 1 and Graph 2, identify the concentration of
      vinegar when the number of bacteria is 40 000 cells per cm³. 1

              g/l

                                                     [Turn over

                      *X807760113*

                             page 13
PDF page 14
Paper 2, Question 8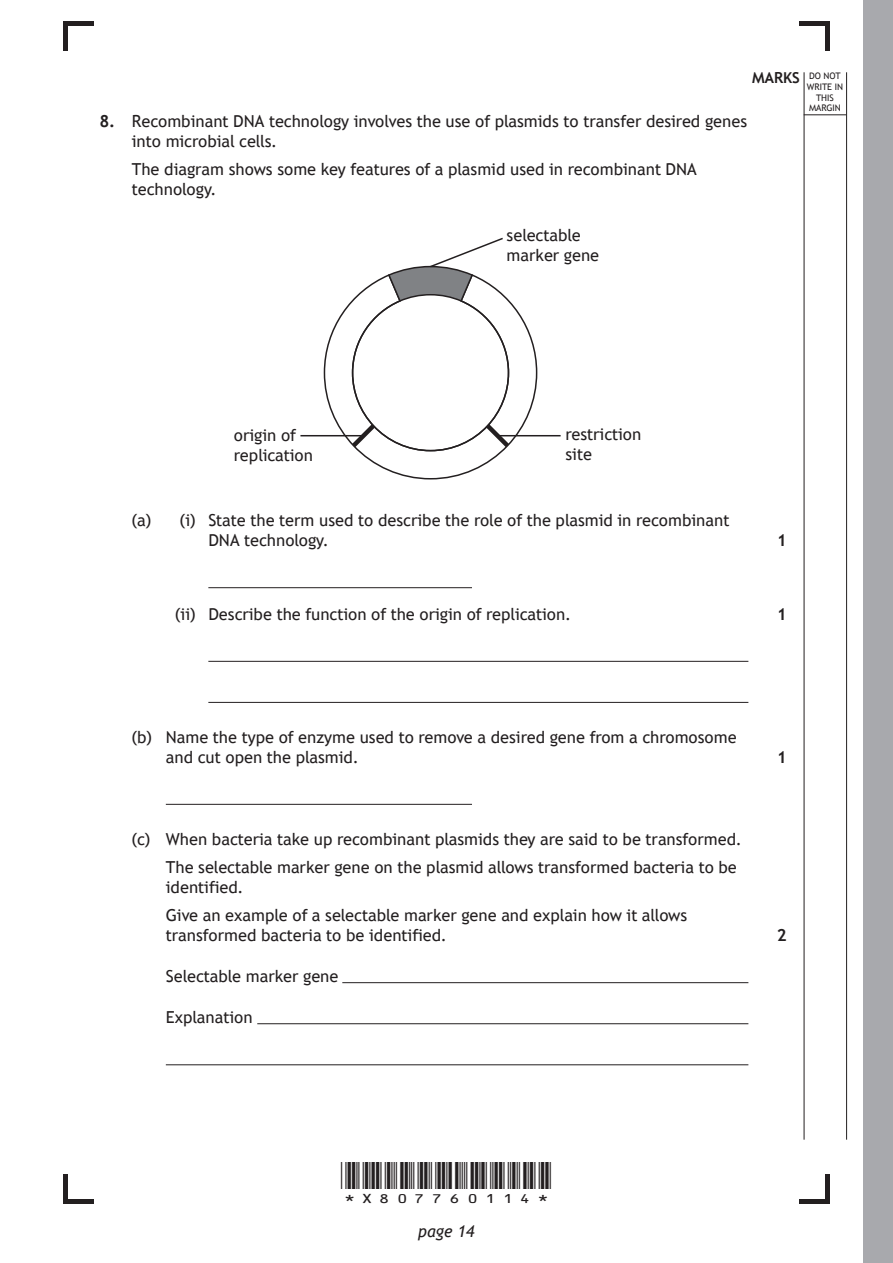
Selectable page text
MARKS _{W}^{D}_{R}^{O}_{I} _{T}^{N}OT
                                                                   E IN
                                                                  THIS
                                                                 MARGIN
8. Recombinant DNA technology involves the use of plasmids to transfer desired genes
   into microbial cells.
   The diagram shows some key features of a plasmid used in recombinant DNA
   technology.
                                      selectable
                                      marker gene

             origin of                     restriction
             replication                   site

   (a)  (i) State the term used to describe the role of the plasmid in recombinant
          DNA technology.                                     1

       (ii) Describe the function of the origin of replication. 1

   (b) Name the type of enzyme used to remove a desired gene from a chromosome
      and cut open the plasmid.                               1

   (c) When bacteria take up recombinant plasmids they are said to be transformed.
      The selectable marker gene on the plasmid allows transformed bacteria to be
      identified.

      Give an example of a selectable marker gene and explain how it allows
      transformed bacteria to be identified.                  2

      Selectable marker gene

      Explanation

                      *X807760114*

                             page 14
PDF page 15
Paper 2, Question 9
Selectable page text
MARKS _{W}^{D}_{R}^{O}_{I} _{T}^{N}OT
                                                                   E IN
                                                                  THIS
                                                                 MARGIN
9. Attempt either A or B. Write your answer in the space below.
   A  Write notes on the circulatory system and heart chambers of mammals. 4
   OR

   B  Write notes on fermentation in plants and yeast.        4

   You may use labelled diagrams where appropriate.

                                                     [Turn over

                      *X807760115*

                             page 15
PDF page 16
Paper 2, Question 10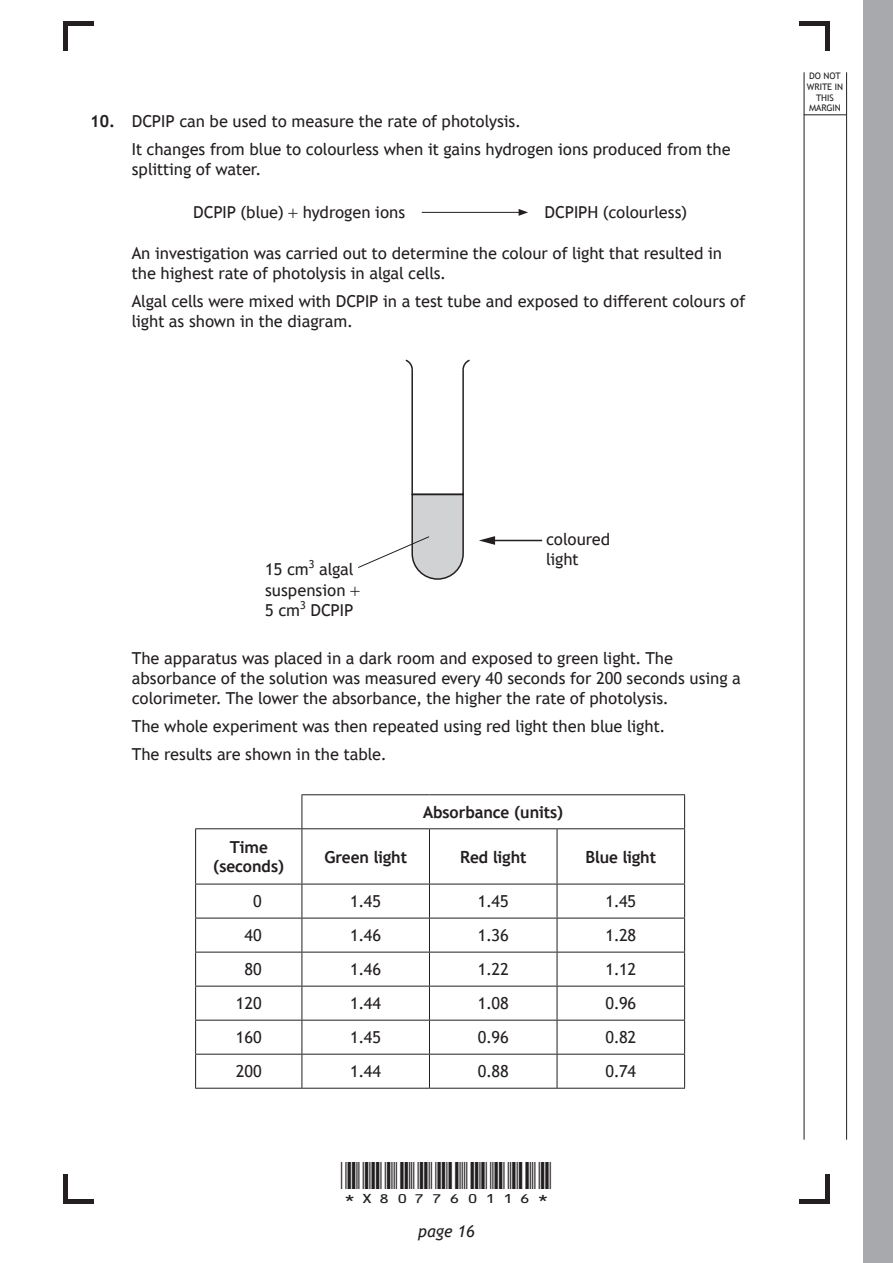
Selectable page text
DO NOT
                                                                  WRITE IN
                                                                   THIS
                                                                  MARGIN
10. DCPIP can be used to measure the rate of photolysis.
    It changes from blue to colourless when it gains hydrogen ions produced from the
    splitting of water.
          DCPIP (blue) + hydrogen ions    DCPIPH (colourless)

    An investigation was carried out to determine the colour of light that resulted in
    the highest rate of photolysis in algal cells.
    Algal cells were mixed with DCPIP in a test tube and exposed to different colours of
    light as shown in the diagram.

                                          coloured
                                          light
                15 cm³ algal
                suspension +
                5 cm³ DCPIP

    The apparatus was placed in a dark room and exposed to green light. The
    absorbance of the solution was measured every 40 seconds for 200 seconds using a
    colorimeter. The lower the absorbance, the higher the rate of photolysis.

    The whole experiment was then repeated using red light then blue light.
    The results are shown in the table.

                               Absorbance (units)

             Time
                      Green light Red light   Blue light
            (seconds)
               0        1.45        1.45        1.45

              40        1.46        1.36        1.28
              80        1.46        1.22        1.12

              120       1.44        1.08        0.96

              160       1.45        0.96        0.82

              200       1.44        0.88        0.74

                       *X807760116*

                              page 16
PDF page 17

Selectable page text
MARKS _{W}^{D}_{R}^{O}_{I} _{T}^{N}OT
                                                                    E IN
                                                                   THIS
                                                                  MARGIN
10. (continued)
    (a)  (i) Identify the dependent variable in this investigation. 1

        (ii) Suggest why the investigation was carried out in a dark room. 1

    (b) On the grid, complete the line graph to show the results for the blue light.

       The results for the green light and red light are shown on the grid.
       (Additional graph paper, if required, can be found on page 28.) 2

                                                   green light

                                                   red light

         0.70

    (c) Draw the conclusion from the results of this investigation. 1

    (d) Suggest why the absorbance values shown in the table remained high when
       algal cells were exposed to green light.                2

                       *X807760117*

                              page 17                 [Turn over
PDF page 18
Paper 2, Question 11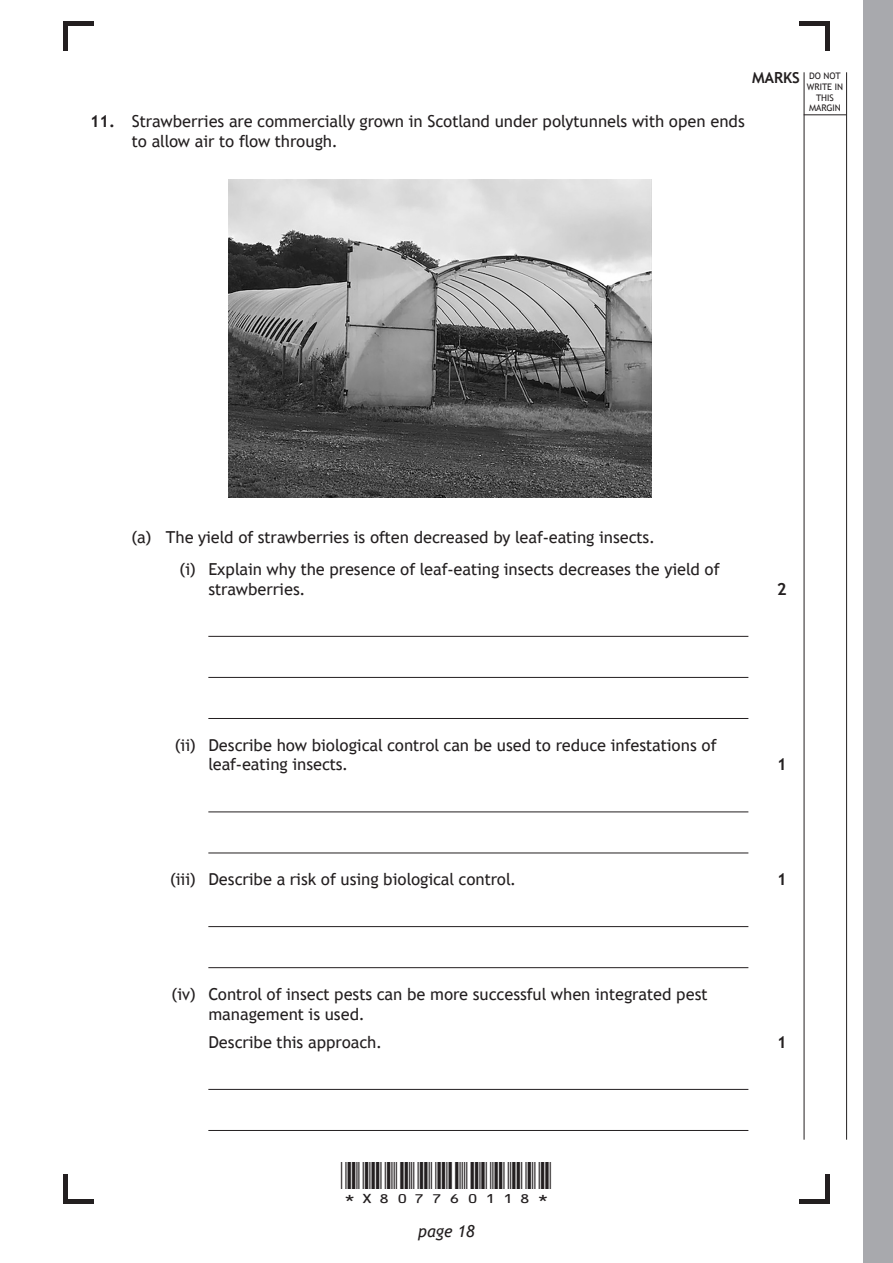
Selectable page text
MARKS _{W}^{D}_{R}^{O}_{I} _{T}^{N}OT
                                                                    E IN
                                                                   THIS
                                                                  MARGIN
11. Strawberries are commercially grown in Scotland under polytunnels with open ends
    to allow air to flow through.

    (a) The yield of strawberries is often decreased by leaf‑eating insects.

         (i) Explain why the presence of leaf‑eating insects decreases the yield of
           strawberries.                                       2

        (ii) Describe how biological control can be used to reduce infestations of
           leaf‑eating insects.                                1

        (iii) Describe a risk of using biological control.     1

        (iv) Control of insect pests can be more successful when integrated pest
           management is used.
           Describe this approach.                             1

                       *X807760118*

                              page 18
PDF page 19
Selectable page text
MARKS _{W}^{D}_{R}^{O}_{I} _{T}^{N}OT
                                                                    E IN
                                                                   THIS
                                                                  MARGIN
11. (continued)
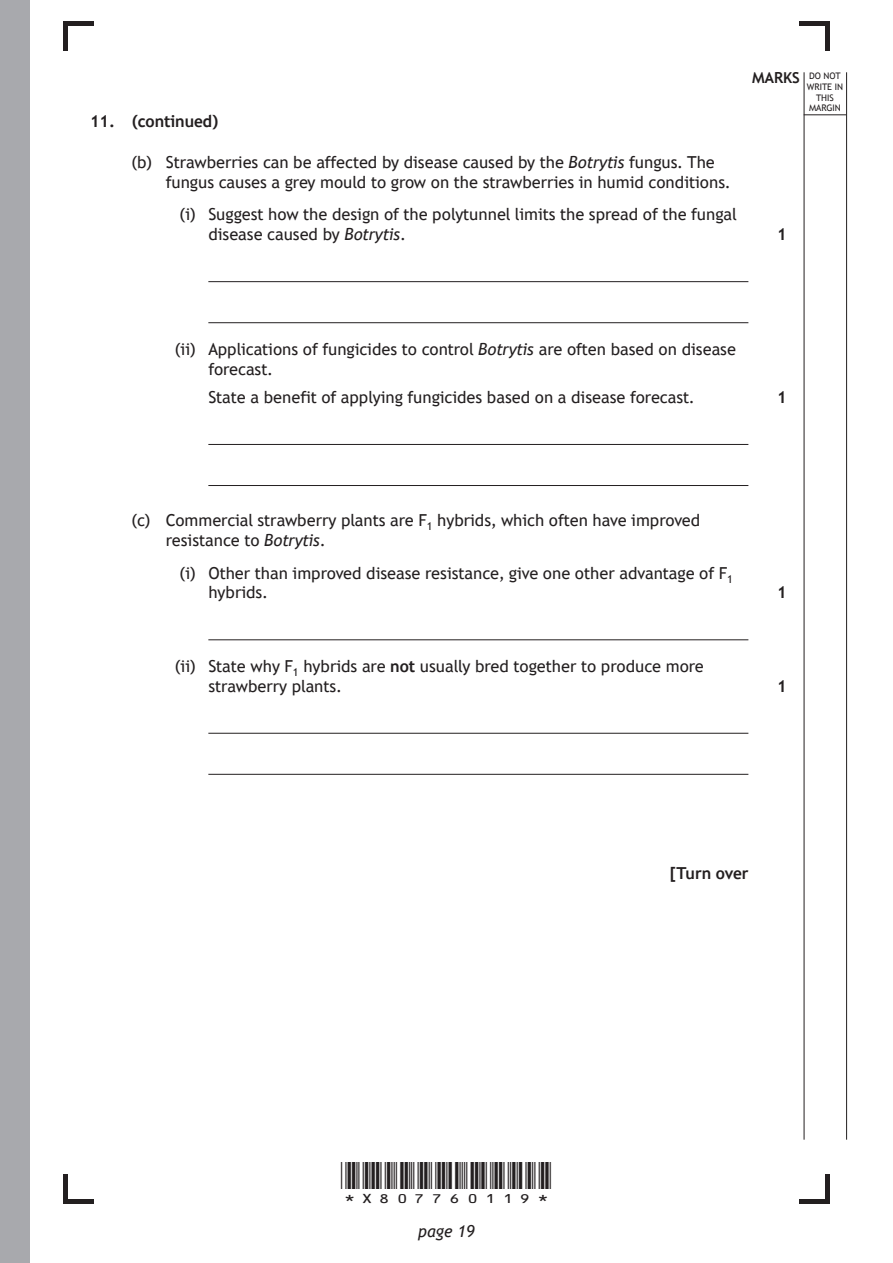
    (b) Strawberries can be affected by disease caused by the Botrytis fungus. The
       fungus causes a grey mould to grow on the strawberries in humid conditions.
         (i) Suggest how the design of the polytunnel limits the spread of the fungal
           disease caused by Botrytis.                         1

        (ii) Applications of fungicides to control Botrytis are often based on disease
           forecast.
           State a benefit of applying fungicides based on a disease forecast. 1

    (c) Commercial strawberry plants are F₁ hybrids, which often have improved
       resistance to Botrytis.

         (i) Other than improved disease resistance, give one other advantage of F₁
           hybrids.                                            1

        (ii) State why F₁ hybrids are not usually bred together to produce more
           strawberry plants.                                  1

                                                      [Turn over

                       *X807760119*

                              page 19
PDF page 20
Paper 2, Question 12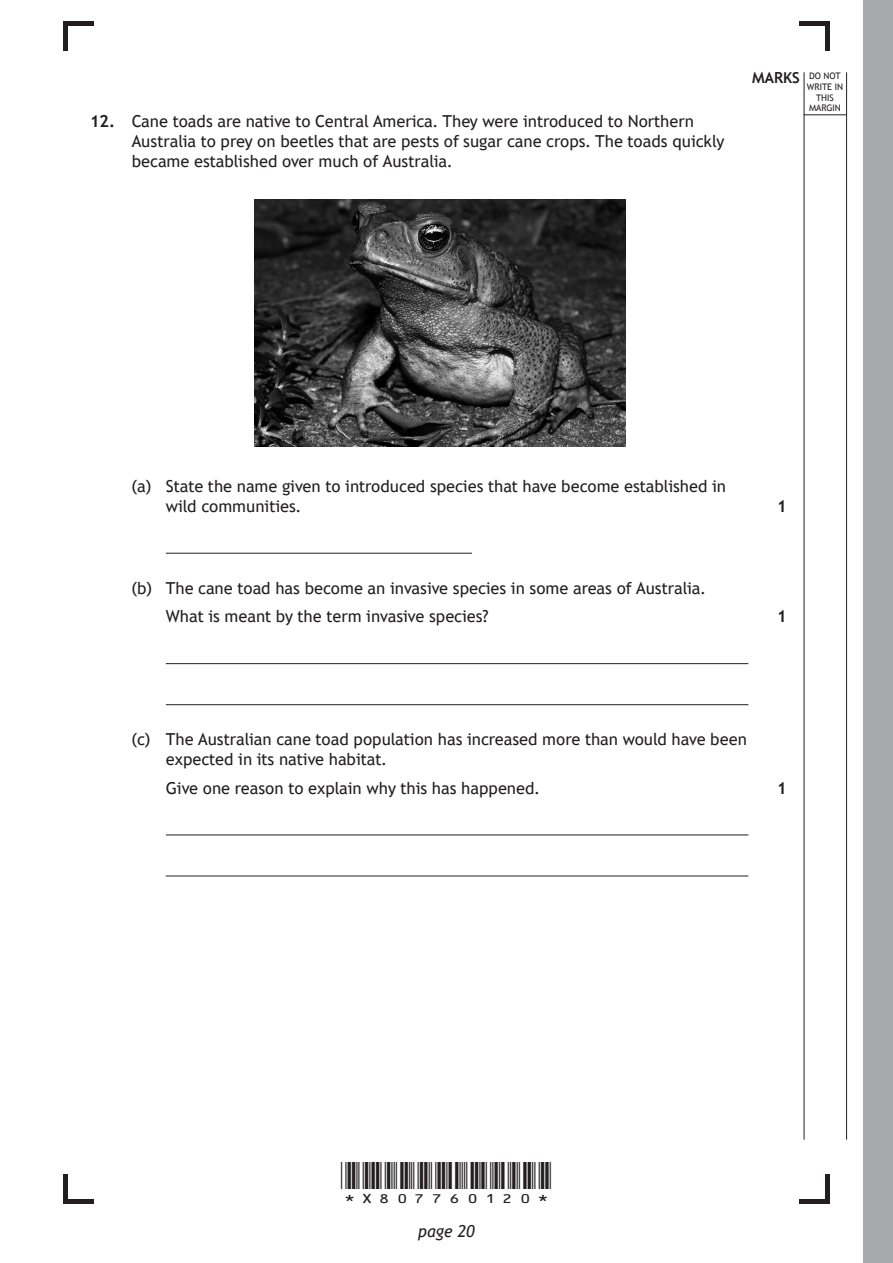
Selectable page text
MARKS _{W}^{D}_{R}^{O}_{I} _{T}^{N}OT
                                                                    E IN
                                                                   THIS
                                                                  MARGIN
12. Cane toads are native to Central America. They were introduced to Northern
    Australia to prey on beetles that are pests of sugar cane crops. The toads quickly
    became established over much of Australia.

    (a) State the name given to introduced species that have become established in
       wild communities.                                       1

    (b) The cane toad has become an invasive species in some areas of Australia.
       What is meant by the term invasive species?             1

    (c) The Australian cane toad population has increased more than would have been
       expected in its native habitat.
       Give one reason to explain why this has happened.       1

                       *X807760120*

                              page 20
PDF page 21
Selectable page text
MARKS _{W}^{D}_{R}^{O}_{I} _{T}^{N}OT
                                                                    E IN
                                                                   THIS
                                                                  MARGIN
12. (continued)
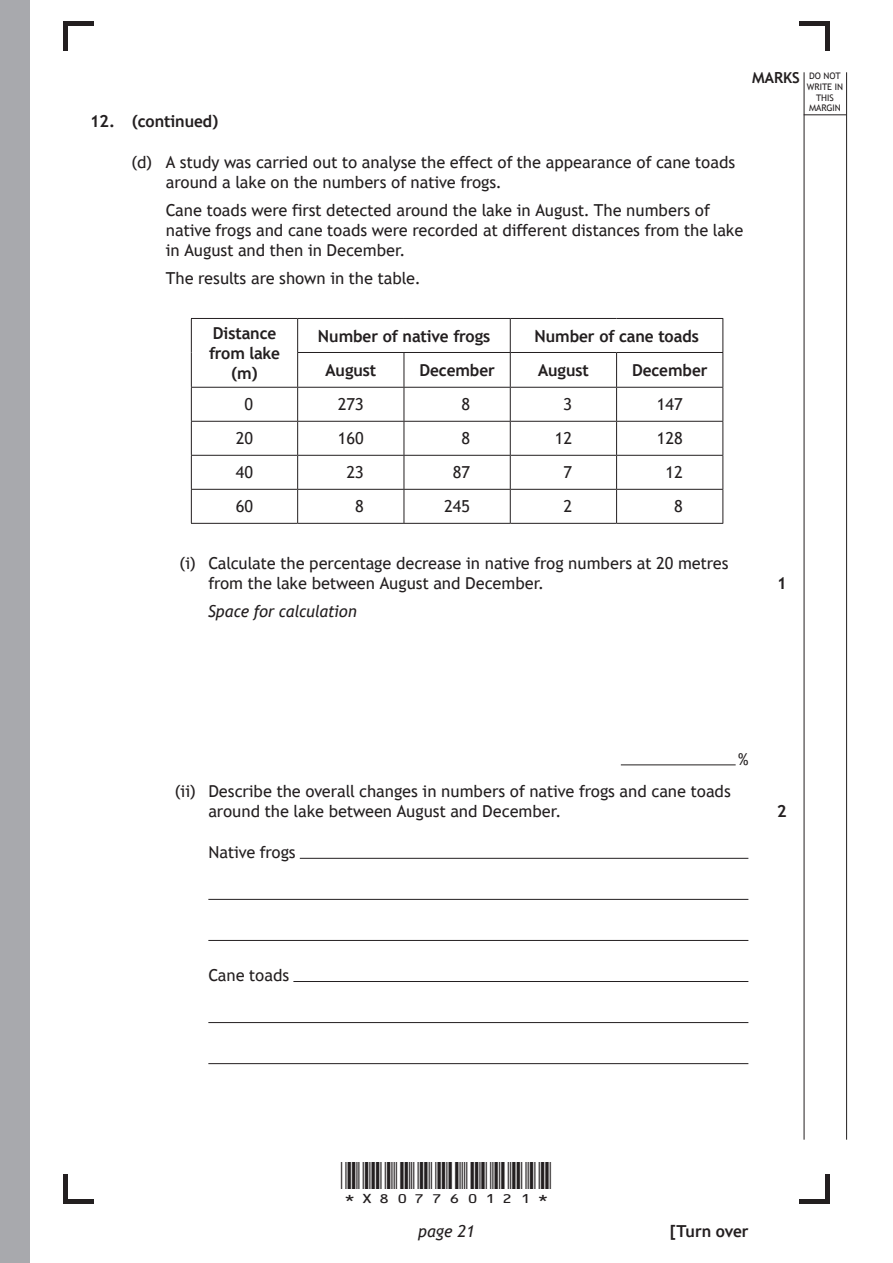
    (d) A study was carried out to analyse the effect of the appearance of cane toads
       around a lake on the numbers of native frogs.
       Cane toads were first detected around the lake in August. The numbers of
       native frogs and cane toads were recorded at different distances from the lake
       in August and then in December.
       The results are shown in the table.

            Distance Number of native frogs Number of cane toads
           from lake
             (m)      August   December  August   December
              0        273        8         3       147

              20       160        8        12       128

              40        23        87        7        12

              60         8       245        2         8

         (i) Calculate the percentage decrease in native frog numbers at 20 metres
           from the lake between August and December.          1
           Space for calculation

                                                            %
        (ii) Describe the overall changes in numbers of native frogs and cane toads
           around the lake between August and December.        2

           Native frogs

           Cane toads

                       *X807760121*

                              page 21                 [Turn over
PDF page 22
Paper 2, Question 13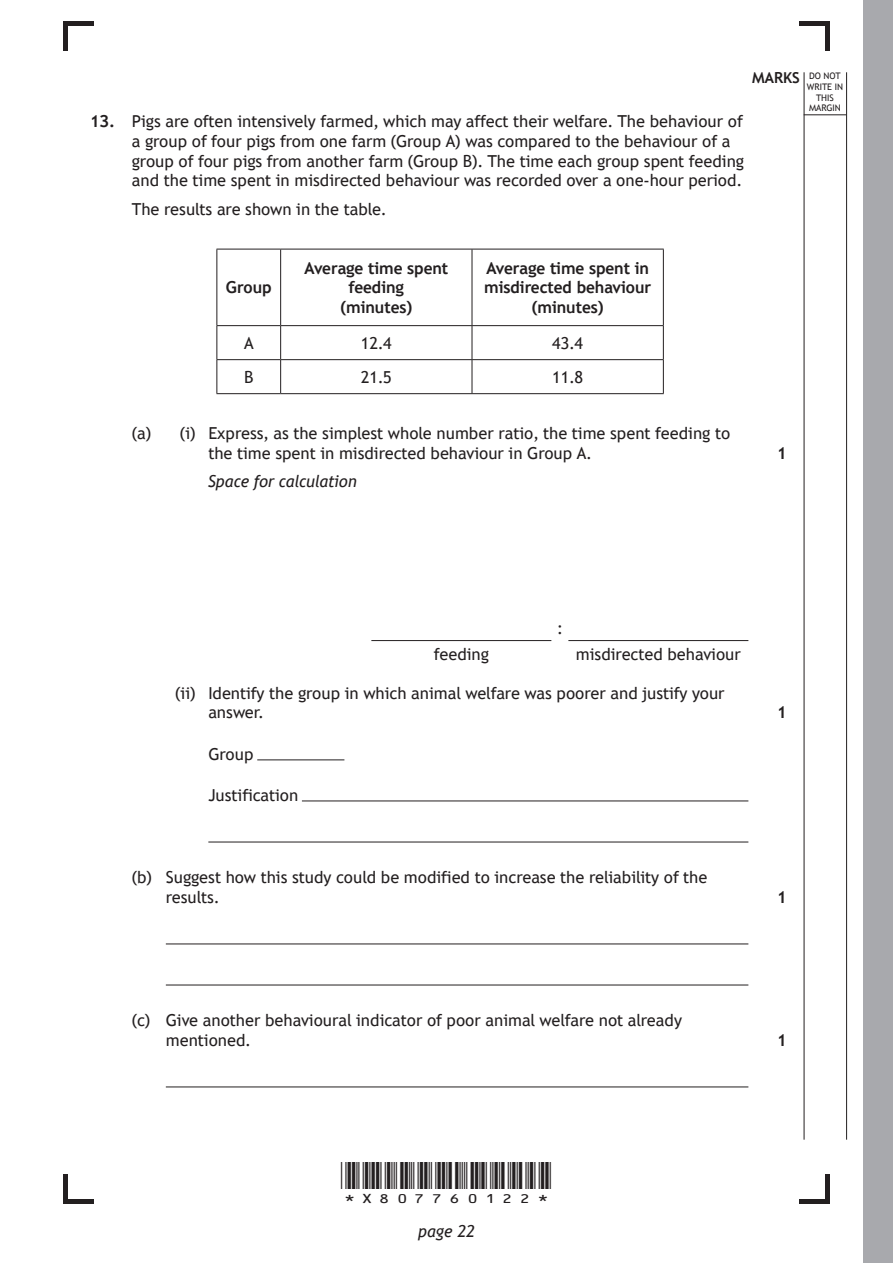
Selectable page text
MARKS _{W}^{D}_{R}^{O}_{I} _{T}^{N}OT
                                                                    E IN
                                                                   THIS
                                                                  MARGIN
13. Pigs are often intensively farmed, which may affect their welfare. The behaviour of
    a group of four pigs from one farm (Group A) was compared to the behaviour of a
    group of four pigs from another farm (Group B). The time each group spent feeding
    and the time spent in misdirected behaviour was recorded over a one‑hour period.
    The results are shown in the table.
                    Average time spent Average time spent in
             Group      feeding      misdirected behaviour
                       (minutes)         (minutes)

              A          12.4              43.4

              B          21.5              11.8

    (a)  (i) Express, as the simplest whole number ratio, the time spent feeding to
           the time spent in misdirected behaviour in Group A. 1
           Space for calculation

                                           :
                                feeding      misdirected behaviour

        (ii) Identify the group in which animal welfare was poorer and justify your
           answer.                                             1

           Group

           Justification

    (b) Suggest how this study could be modified to increase the reliability of the
       results.                                                1

    (c) Give another behavioural indicator of poor animal welfare not already
       mentioned.                                              1

                       *X807760122*

                              page 22
PDF page 23

Selectable page text
MARKS _{W}^{D}_{R}^{O}_{I} _{T}^{N}OT
                                                                    E IN
                                                                   THIS
                                                                  MARGIN
13. (continued)
    (d) Give one reason why intensive farming is often used instead of free range
       farming.                                                1

    (e) Livestock are fed cereal crops such as barley and wheat.

       Explain how food security would be increased if humans ate more cereal crops
       instead of eating meat.                                 2

                                                      [Turn over

                       *X807760123*

                              page 23
PDF page 24
Paper 2, Question 14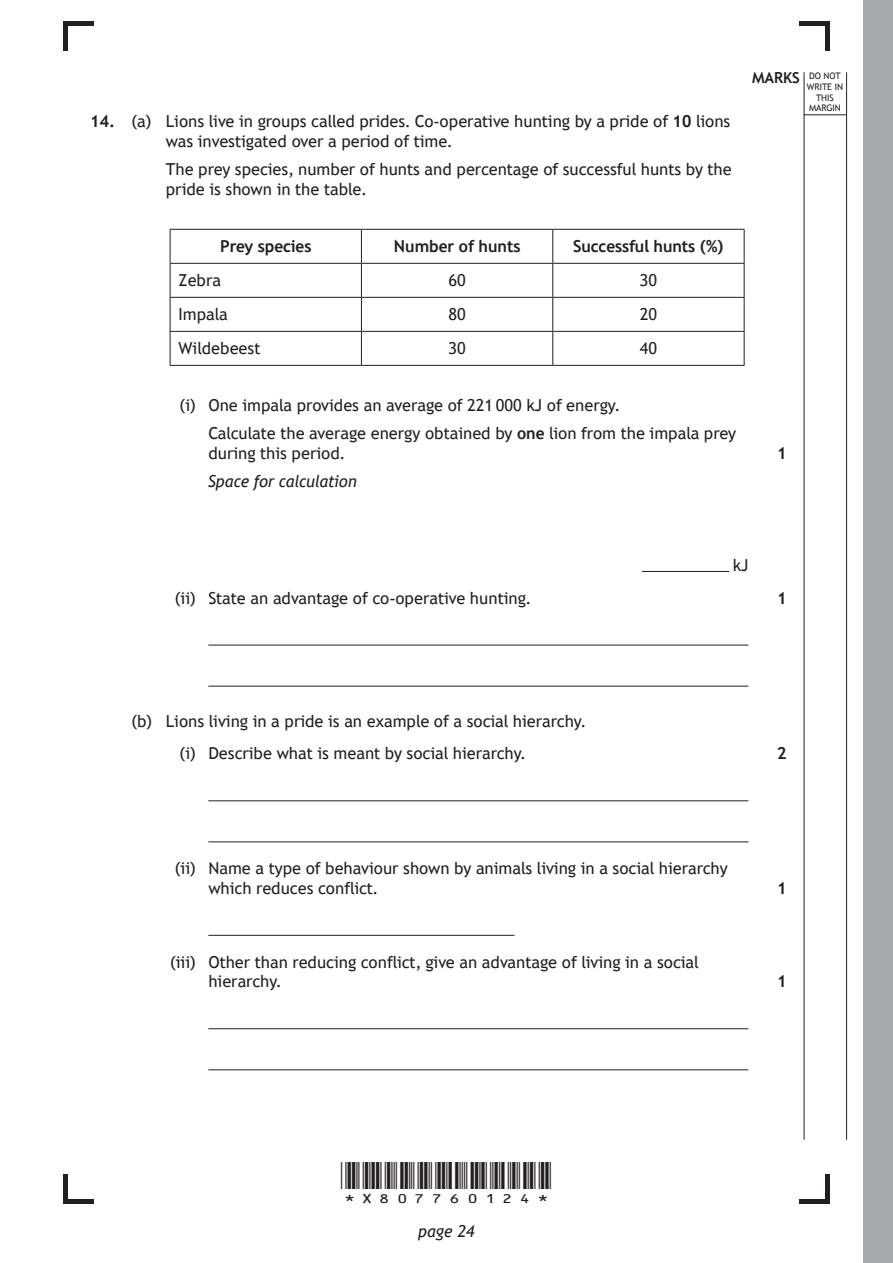
Selectable page text
MARKS _{W}^{D}_{R}^{O}_{I} _{T}^{N}OT
                                                                    E IN
                                                                   THIS
                                                                  MARGIN
14. (a) Lions live in groups called prides. Co‑operative hunting by a pride of 10 lions
       was investigated over a period of time.
       The prey species, number of hunts and percentage of successful hunts by the
       pride is shown in the table.
            Prey species    Number of hunts  Successful hunts (%)

        Zebra                    60                30

        Impala                   80                20

        Wildebeest               30                40

         (i) One impala provides an average of 221 000 kJ of energy.

           Calculate the average energy obtained by one lion from the impala prey
           during this period.                                 1
           Space for calculation

                                                           kJ
        (ii) State an advantage of co‑operative hunting.       1

    (b) Lions living in a pride is an example of a social hierarchy.
         (i) Describe what is meant by social hierarchy.       2

        (ii) Name a type of behaviour shown by animals living in a social hierarchy
           which reduces conflict.                             1

        (iii) Other than reducing conflict, give an advantage of living in a social
           hierarchy.                                          1

                       *X807760124*

                              page 24
PDF page 25
Paper 2, Question 15
Selectable page text
MARKS _{W}^{D}_{R}^{O}_{I} _{T}^{N}OT
                                                                    E IN
                                                                   THIS
                                                                  MARGIN
15. Attempt either A or B. Write your answer in the space below and on pages 26 and
    27.
    A  Write notes on DNA replication.                         8
    OR

    B  Write notes on speciation.                              8

    You may use labelled diagrams where appropriate.

                                                      [Turn over

                       *X807760125*

                              page 25
PDF page 26

Selectable page text
MARKS _{W}^{D}_{R}^{O}_{I} _{T}^{N}OT
                                                      E IN
                                                     THIS
                                                    MARGIN
ADDITIONAL SPACE FOR ANSWER to question 15

         *X807760126*

                page 26
PDF page 27

Selectable page text
MARKS _{W}^{D}_{R}^{O}_{I} _{T}^{N}OT
                                                      E IN
                                                     THIS
                                                    MARGIN
ADDITIONAL SPACE FOR ANSWER to question 15

          [END OF QUESTION PAPER]

         *X807760127*

                page 27
PDF page 28
Selectable page text
MARKS _{W}^{D}_{R}^{O}_{I} _{T}^{N}OT
                                                                    E IN
                                                                   THIS
                                                                  MARGIN
            ADDITIONAL SPACE FOR ANSWERS AND ROUGH WORK
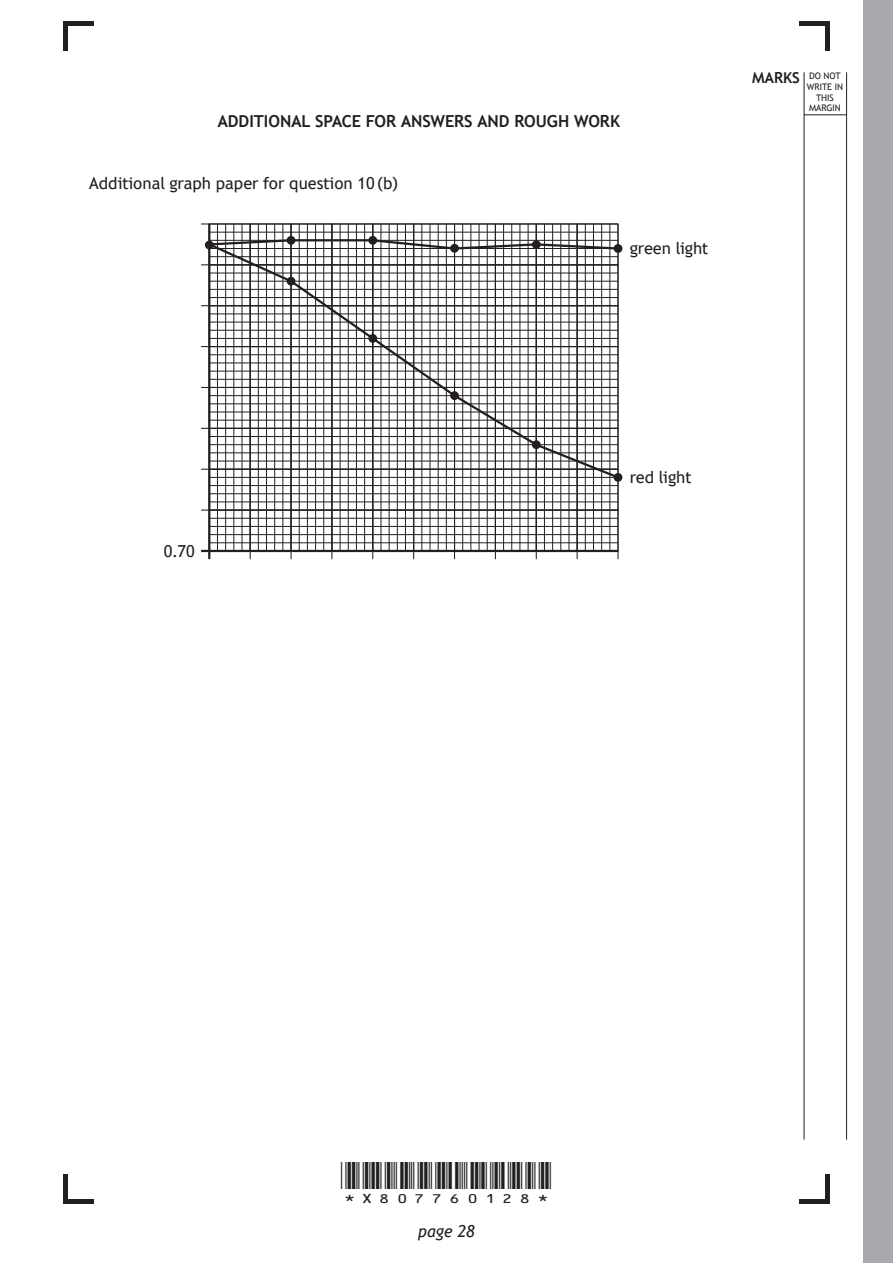
Additional graph paper for question 10 (b)

                                                  green light

                                                  red light

       0.70

                       *X807760128*

                              page 28
PDF page 29

Selectable page text
MARKS _{W}^{D}_{R}^{O}_{I} _{T}^{N}OT
                                                        E IN
                                                       THIS
                                                      MARGIN
ADDITIONAL SPACE FOR ANSWERS AND ROUGH WORK

           *X807760129*

                  page 29
PDF page 30

Selectable page text
MARKS _{W}^{D}_{R}^{O}_{I} _{T}^{N}OT
                                                        E IN
                                                       THIS
                                                      MARGIN
ADDITIONAL SPACE FOR ANSWERS AND ROUGH WORK

           *X807760130*

                  page 30
PDF page 31

Selectable page text
[BLANK PAGE]

DO NOT WRITE ON THIS PAGE

*X807760131*

       page 31
PDF page 32

Selectable page text
[BLANK PAGE]

                       DO NOT WRITE ON THIS PAGE

Acknowledgement of copyright
Question 12 Mr F/shutterstock.com

                       *X807760132*

                              page 32