2023 Higher Biology - Paper 2 questions
Source: Scottish Qualifications Authority (SQA) / Qualifications Scotland. This is a StemInteract HTML companion, not an official HTML edition. Selectable text is supplied alongside original page images. Use the images or original PDF for equations, powers, fractions, vector notation, tables and diagrams; text extraction cannot fully preserve mathematical layout.
Jump to a question
PDF page 1

Selectable page text
FOR OFFICIAL USE
H
National
Qualications
Mark
2023
X807/76/01 Biology
Paper 2
THURSDAY, 27 APRIL
10:10 AM – 12:30 PM
*X8077601*
Fill in these boxes and read what is printed below.
Full name of centre Town
Forename(s) Surname Number of seat
Date of birth
Day Month Year Scottish candidate number
Total marks — 95
Attempt ALL questions.
You may use a calculator.
Questions 5 and 15 contain a choice.
Write your answers clearly in the spaces provided in this booklet. Additional space for answers
and rough work is provided at the end of this booklet. If you use this space you must clearly
identify the question number you are attempting. Any rough work must be written in this
booklet. Score through your rough work when you have written your final copy.
Use blue or black ink.
Before leaving the examination room you must give this booklet to the Invigilator; if you do not,
you may lose all the marks for this paper.
©
*X807760101*
A/HTPPDF page 2
Paper 2, Question 1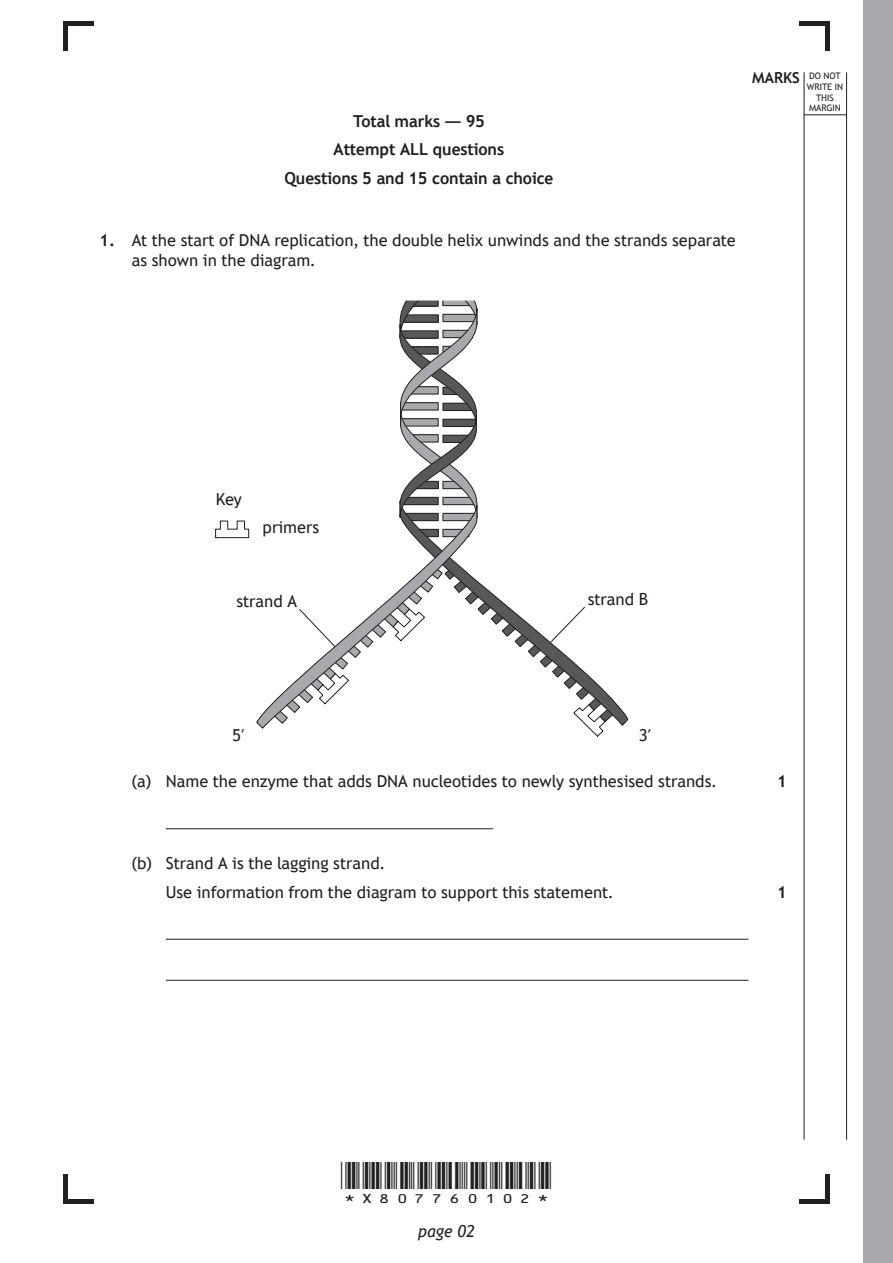
Selectable page text
MARKS _{W}^{D}_{R}^{O}_{I} _{T}^{N}OT
                                                                   E IN
                                                                  THIS
                                                                 MARGIN
                       Total marks — 95
                      Attempt ALL questions
                 Questions 5 and 15 contain a choice

1. At the start of DNA replication, the double helix unwinds and the strands separate
   as shown in the diagram.

           Key

               primers

             strand A                        strand B

            5′                                    3′

   (a) Name the enzyme that adds DNA nucleotides to newly synthesised strands. 1

   (b) Strand A is the lagging strand.
      Use information from the diagram to support this statement. 1

                      *X807760102*

                             page 02
PDF page 3
Selectable page text
MARKS _{W}^{D}_{R}^{O}_{I} _{T}^{N}OT
                                                                   E IN
                                                                  THIS
                                                                 MARGIN
1. (continued)
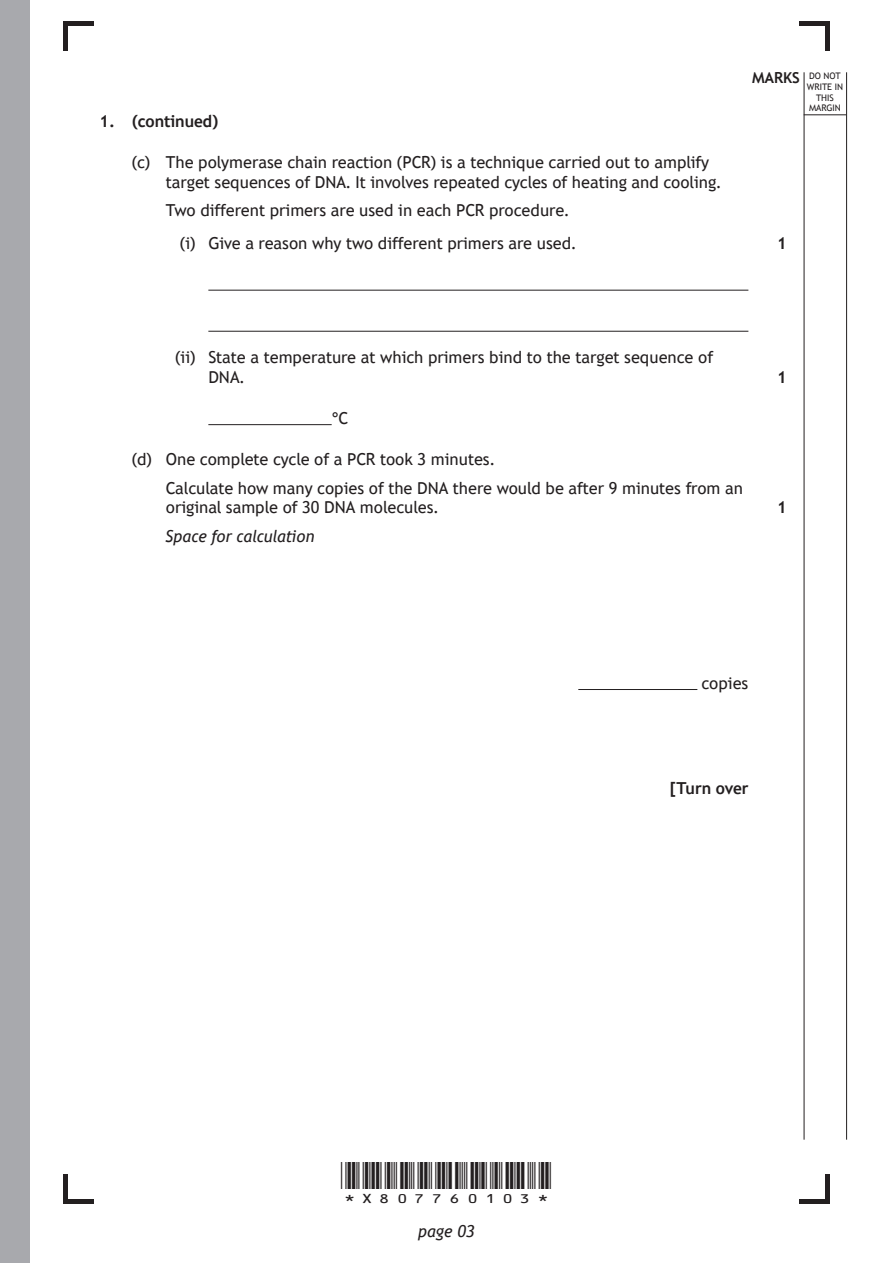
   (c) The polymerase chain reaction (PCR) is a technique carried out to amplify
      target sequences of DNA. It involves repeated cycles of heating and cooling.
      Two different primers are used in each PCR procedure.
        (i) Give a reason why two different primers are used. 1

       (ii) State a temperature at which primers bind to the target sequence of
          DNA.                                                1

                      °C

   (d) One complete cycle of a PCR took 3 minutes.

      Calculate how many copies of the DNA there would be after 9 minutes from an
      original sample of 30 DNA molecules.                    1
      Space for calculation

                                                       copies

                                                     [Turn over

                      *X807760103*

                             page 03
PDF page 4
Paper 2, Question 2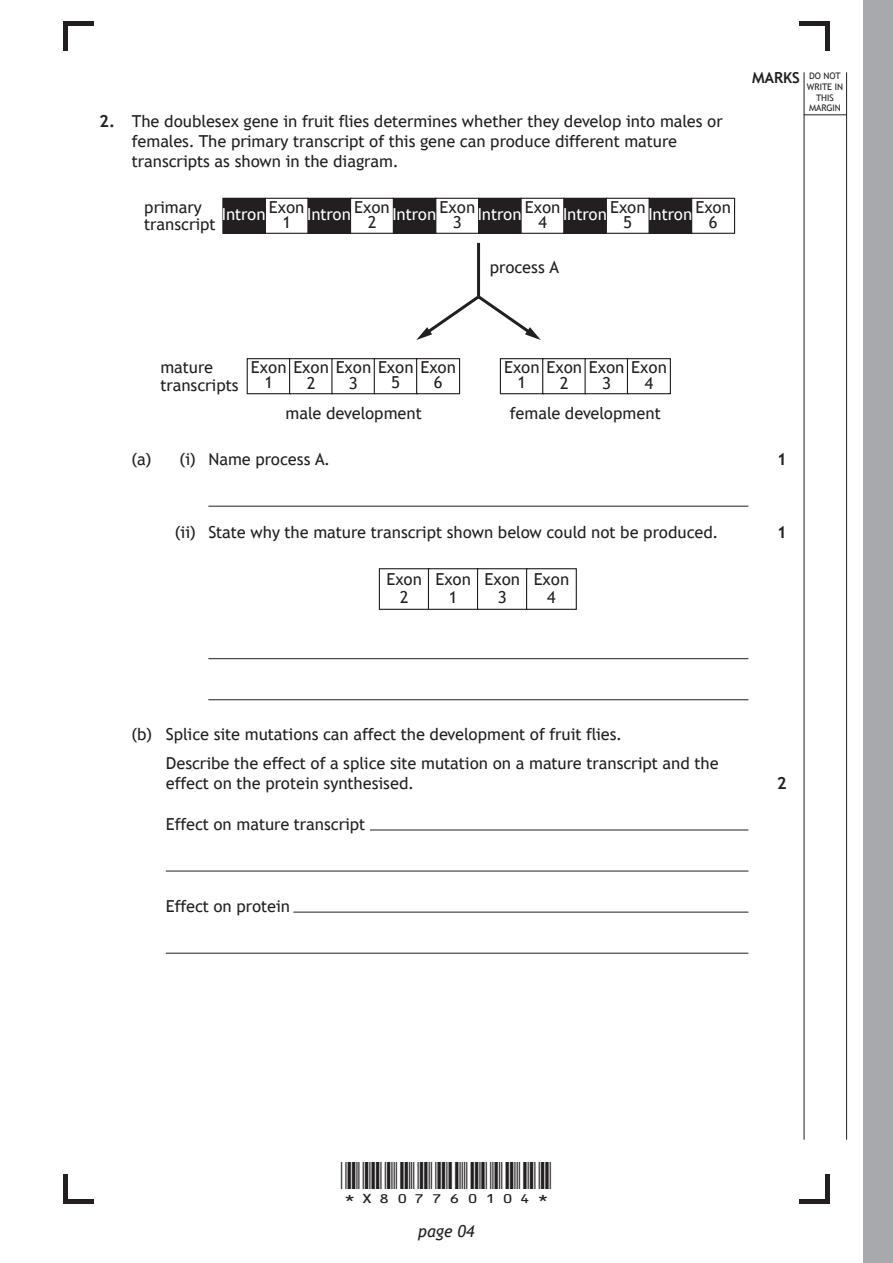
Selectable page text
MARKS _{W}^{D}_{R}^{O}_{I} _{T}^{N}OT
                                                                   E IN
                                                                  THIS
                                                                 MARGIN
2. The doublesex gene in fruit flies determines whether they develop into males or
   females. The primary transcript of this gene can produce different mature
   transcripts as shown in the diagram.
    primary     Exon    Exon   Exon    Exon    Exon    Exon
           Intron  Intron  Intron  Intron  Intron  Intron
    transcript   1       2       3       4      5       6
                                    process A

      mature  Exon Exon Exon Exon Exon Exon Exon Exon Exon
      transcripts 1 2  3   5   6       1  2   3   4

                 male development     female development

   (a)  (i) Name process A.                                   1

       (ii) State why the mature transcript shown below could not be produced. 1

                           Exon Exon Exon Exon
                            2   1    3   4

   (b) Splice site mutations can affect the development of fruit flies.

      Describe the effect of a splice site mutation on a mature transcript and the
      effect on the protein synthesised.                      2

      Effect on mature transcript

      Effect on protein

                      *X807760104*

                             page 04
PDF page 5
Paper 2, Question 3
Selectable page text
MARKS _{W}^{D}_{R}^{O}_{I} _{T}^{N}OT
                                                                   E IN
                                                                  THIS
                                                                 MARGIN
3. Stem cells are used in research to study how diseases develop.
   (a)  (i) State one other research use of stem cells.       1

       (ii) Describe a property of embryonic stem cells, which makes them useful
          for research.                                       1

       (iii) Suggest an ethical reason why medical research may involve the use of
          embryonic stem cells.                               1

                                                     [Turn over

                      *X807760105*

                             page 05
PDF page 6
Selectable page text
MARKS _{W}^{D}_{R}^{O}_{I} _{T}^{N}OT
                                                                   E IN
3. (continued)                                                    THIS
                                                                 MARGIN
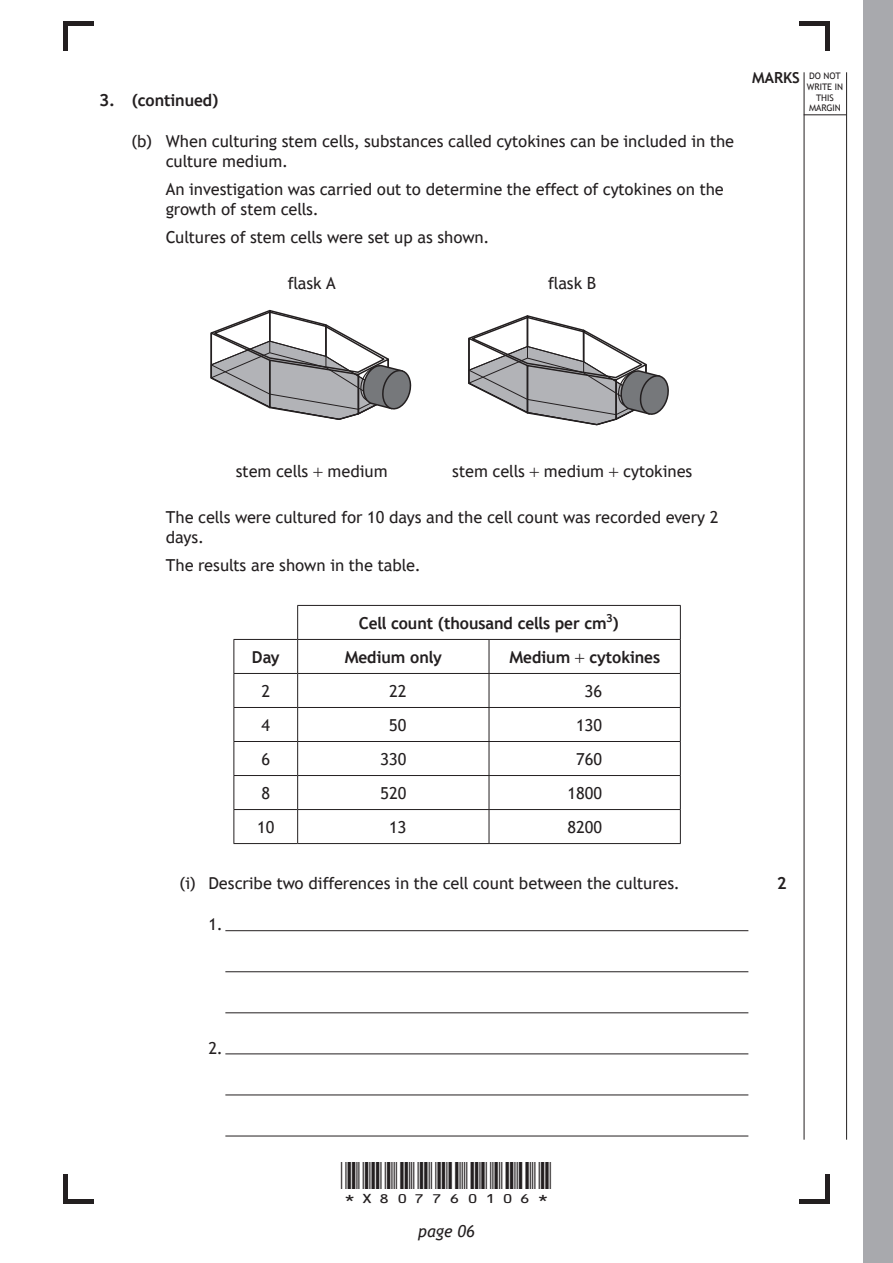
   (b) When culturing stem cells, substances called cytokines can be included in the
      culture medium.
      An investigation was carried out to determine the effect of cytokines on the
      growth of stem cells.
      Cultures of stem cells were set up as shown.

                 flask A                 flask B

             stem cells + medium stem cells + medium + cytokines

      The cells were cultured for 10 days and the cell count was recorded every 2
      days.

      The results are shown in the table.

                        Cell count (thousand cells per cm³)
              Day      Medium only    Medium + cytokines

               2           22                36

               4           50               130

               6          330               760
               8          520              1800

               10          13              8200

        (i) Describe two differences in the cell count between the cultures. 2

          1.

          2.

                      *X807760106*

                             page 06
PDF page 7

Selectable page text
MARKS _{W}^{D}_{R}^{O}_{I} _{T}^{N}OT
                                                                   E IN
                                                                  THIS
                                                                 MARGIN
3. (b) (continued)
       (ii) Calculate how many cells would be present in a 0.01 cm³ sample taken
          from the culture containing cytokines after 10 days. 1
          Space for calculation

                                                  thousand cells

       (iii) The cell count was a viable cell count.
          Use evidence from the table to support this statement. 1

                                                     [Turn over

                      *X807760107*

                             page 07
PDF page 8
Paper 2, Question 4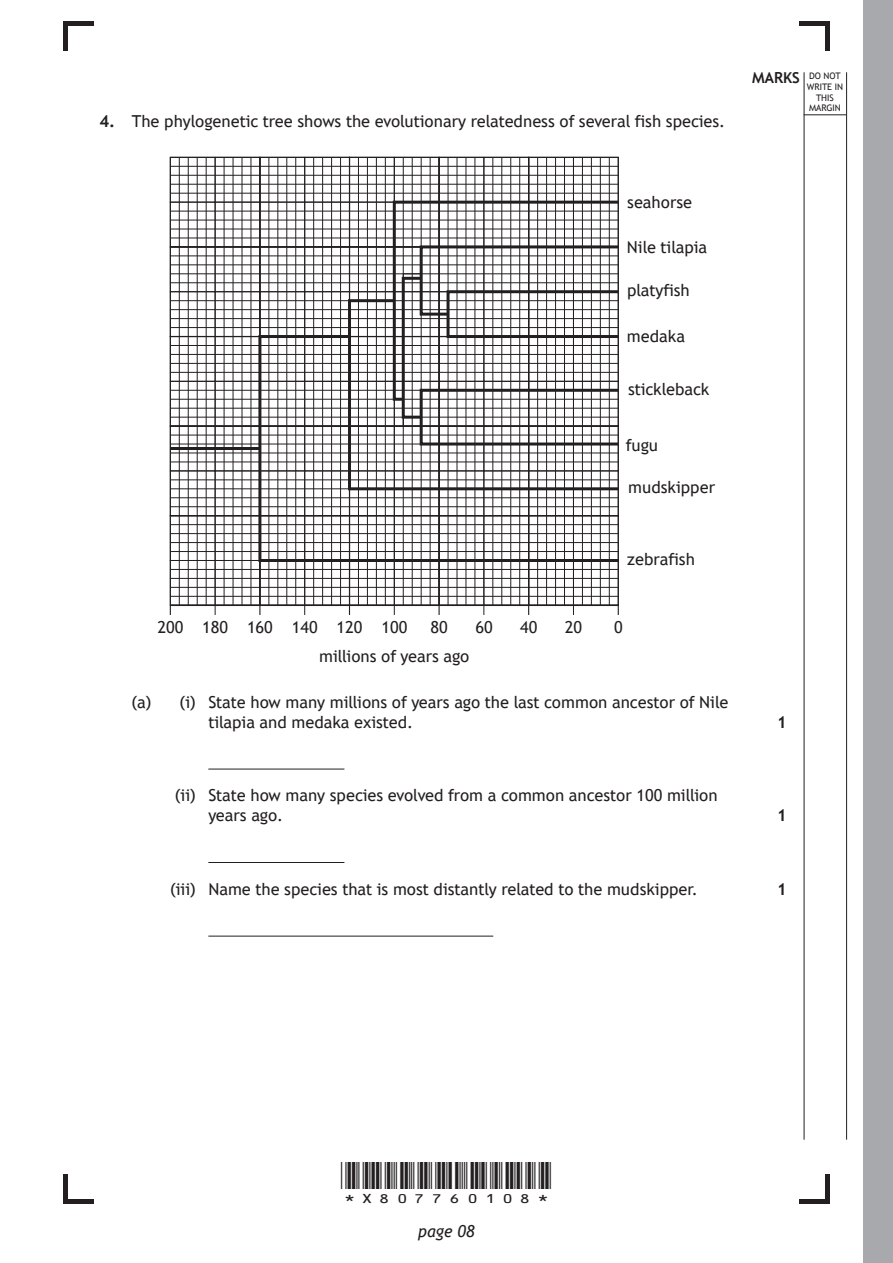
Selectable page text
MARKS _{W}^{D}_{R}^{O}_{I} _{T}^{N}OT
                                                                   E IN
                                                                  THIS
                                                                 MARGIN
4. The phylogenetic tree shows the evolutionary relatedness of several fish species.

                                                 seahorse

                                                 Nile tilapia

                                                 platyfish

                                                 medaka

                                                 stickleback

                                                 fugu

                                                 mudskipper

                                                 zebrafish

     200  180 160 140 120 100  80  60  40  20  0
                    millions of years ago

   (a)  (i) State how many millions of years ago the last common ancestor of Nile
          tilapia and medaka existed.                         1

       (ii) State how many species evolved from a common ancestor 100 million
          years ago.                                          1

       (iii) Name the species that is most distantly related to the mudskipper. 1

                      *X807760108*

                             page 08
PDF page 9

Selectable page text
MARKS _{W}^{D}_{R}^{O}_{I} _{T}^{N}OT
                                                                   E IN
                                                                  THIS
                                                                 MARGIN
4. (continued)
   (b) Many fish species have fins on the underside of their bodies called pelvic fins.
      Nile tilapia, zebrafish and Atlantic cod have pelvic fins, but seahorses do not.
      A series of genes, A – F, is involved in fin development in fish. The genes
      present and their locations on a chromosome are shown in the diagram.

       Nile tilapia A     B     C     D     E     F

       zebrafish    A     B     C     D     E     F

       seahorse     A     B     D     E     F

       Atlantic cod A     E     D     C     B     F

        (i) Use the information given to identify the gene responsible for the
          development of the pelvic fin.                      1

       (ii) Name the type of mutation that resulted in the gene sequence found in
          the Atlantic cod.                                   1

                                                     [Turn over

                      *X807760109*

                             page 09
PDF page 10
Paper 2, Question 5
Selectable page text
MARKS _{W}^{D}_{R}^{O}_{I} _{T}^{N}OT
                                                                   E IN
                                                                  THIS
                                                                 MARGIN
5. Attempt either A or B. Write your answer in the space below.
   A  Write notes on the organisation and location of DNA in prokaryotic and
      eukaryotic cells.                                       5
   OR

   B  Write notes on the translation stage of protein synthesis. 5

   You may use labelled diagrams where appropriate.

                      *X807760110*

                             page 10
PDF page 11
Paper 2, Question 6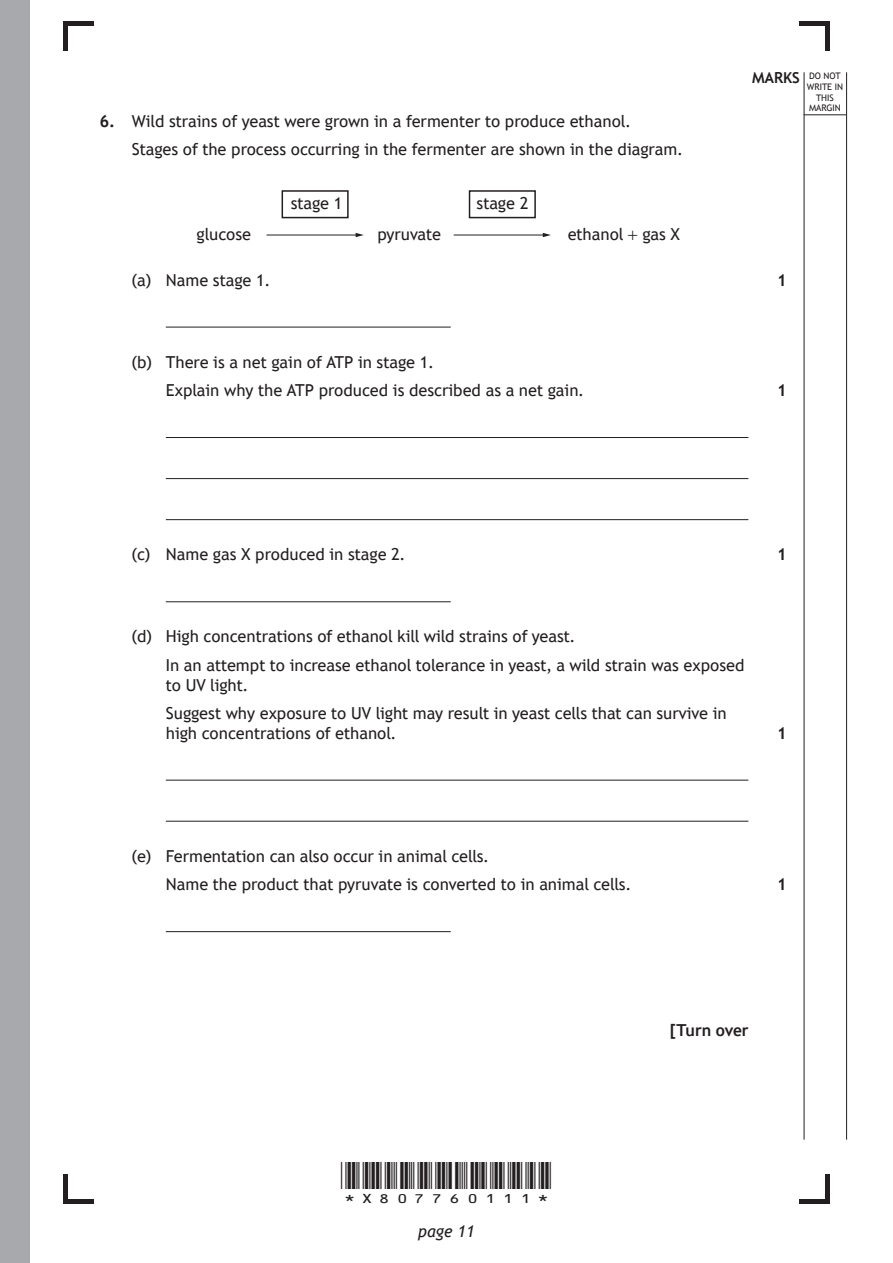
Selectable page text
MARKS _{W}^{D}_{R}^{O}_{I} _{T}^{N}OT
                                                                   E IN
                                                                  THIS
                                                                 MARGIN
6. Wild strains of yeast were grown in a fermenter to produce ethanol.
   Stages of the process occurring in the fermenter are shown in the diagram.
                  stage 1          stage 2

         glucose          pyruvate         ethanol + gas X

   (a) Name stage 1.                                          1

   (b) There is a net gain of ATP in stage 1.

      Explain why the ATP produced is described as a net gain. 1

   (c) Name gas X produced in stage 2.                        1

   (d) High concentrations of ethanol kill wild strains of yeast.

      In an attempt to increase ethanol tolerance in yeast, a wild strain was exposed
      to UV light.
      Suggest why exposure to UV light may result in yeast cells that can survive in
      high concentrations of ethanol.                         1

   (e) Fermentation can also occur in animal cells.
      Name the product that pyruvate is converted to in animal cells. 1

                                                     [Turn over

                      *X807760111*

                             page 11
PDF page 12
Paper 2, Question 7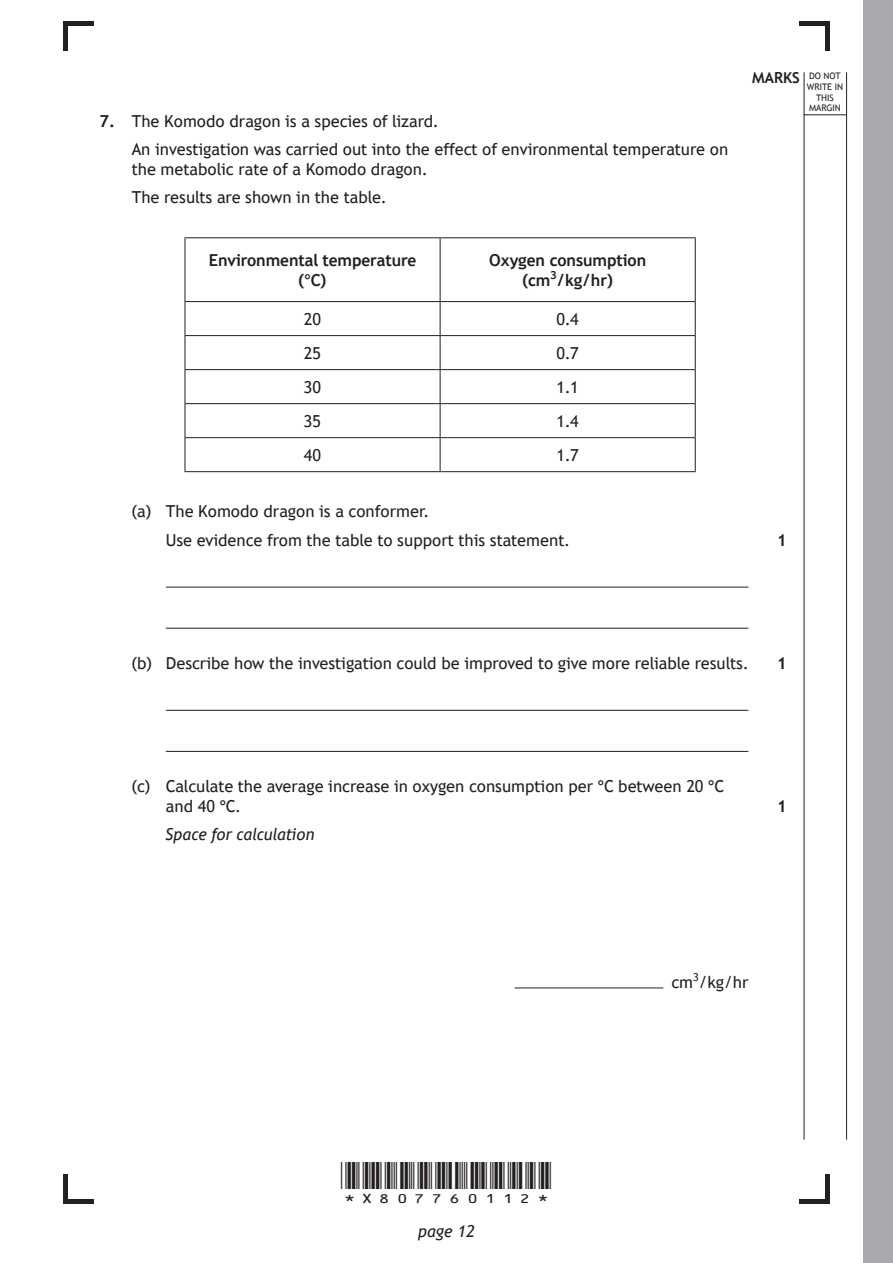
Selectable page text
MARKS _{W}^{D}_{R}^{O}_{I} _{T}^{N}OT
                                                                   E IN
                                                                  THIS
                                                                 MARGIN
7. The Komodo dragon is a species of lizard.
   An investigation was carried out into the effect of environmental temperature on
   the metabolic rate of a Komodo dragon.
   The results are shown in the table.

          Environmental temperature Oxygen consumption
                  (°C)                 (cm³/kg/hr)

                   20                     0.4

                   25                     0.7
                   30                     1.1

                   35                     1.4

                   40                     1.7

   (a) The Komodo dragon is a conformer.
      Use evidence from the table to support this statement.  1

   (b) Describe how the investigation could be improved to give more reliable results. 1

   (c) Calculate the average increase in oxygen consumption per °C between 20 °C
      and 40 °C.                                              1
      Space for calculation

                                                     cm³/kg/hr

                      *X807760112*

                             page 12
PDF page 13
Selectable page text
MARKS _{W}^{D}_{R}^{O}_{I} _{T}^{N}OT
                                                                   E IN
                                                                  THIS
                                                                 MARGIN
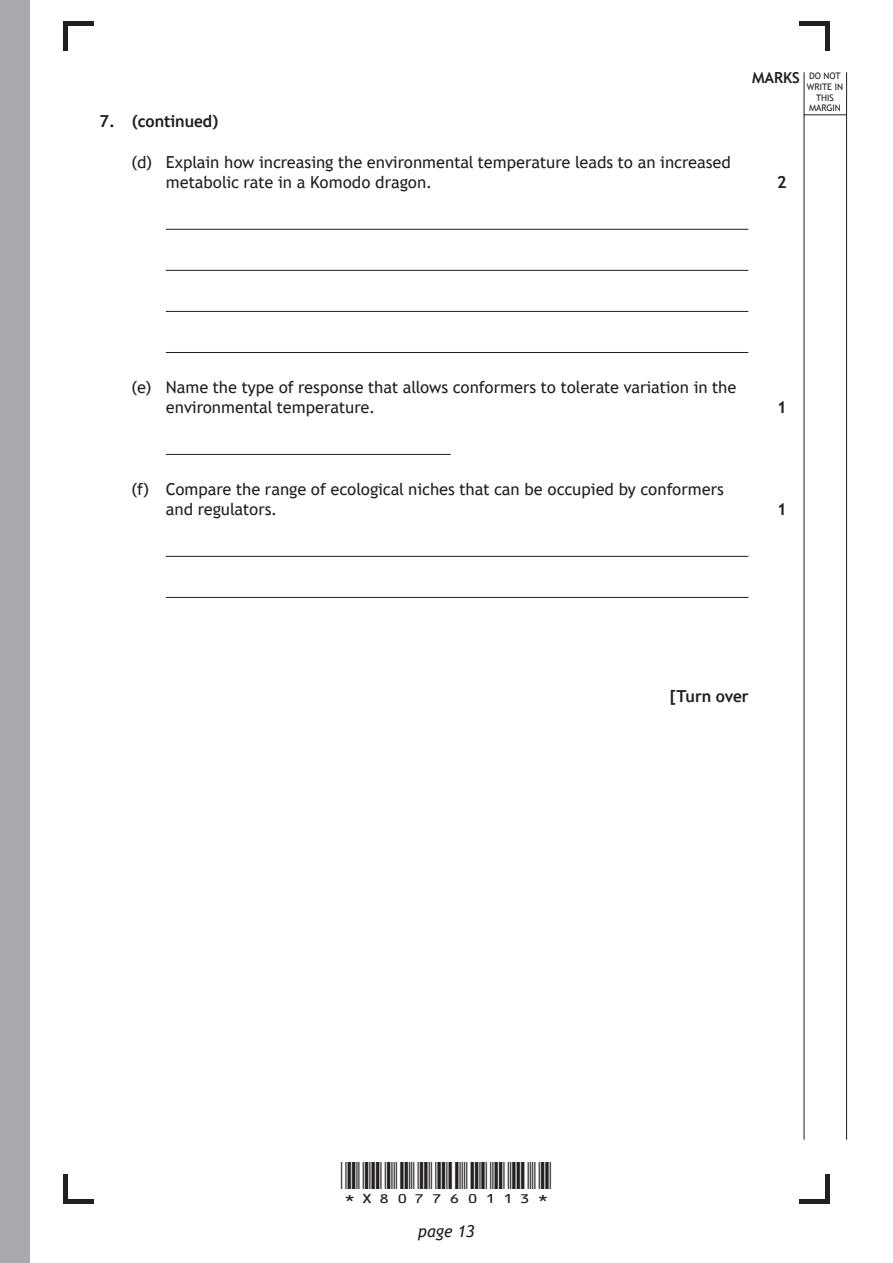
7. (continued)
   (d) Explain how increasing the environmental temperature leads to an increased
      metabolic rate in a Komodo dragon.                      2

   (e) Name the type of response that allows conformers to tolerate variation in the
      environmental temperature.                              1

   (f) Compare the range of ecological niches that can be occupied by conformers
      and regulators.                                         1

                                                     [Turn over

                      *X807760113*

                             page 13
PDF page 14
Paper 2, Question 8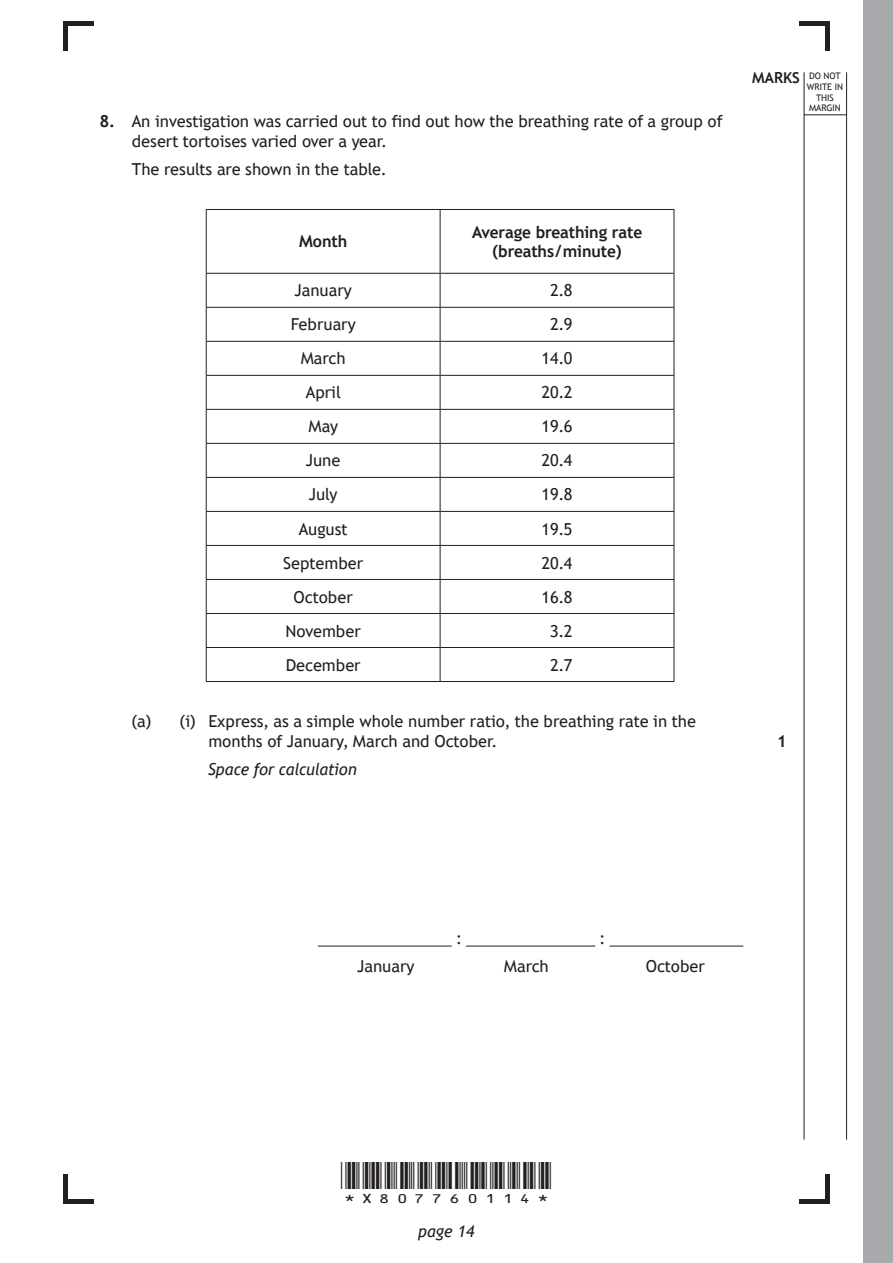
Selectable page text
MARKS _{W}^{D}_{R}^{O}_{I} _{T}^{N}OT
                                                                   E IN
                                                                  THIS
                                                                 MARGIN
8. An investigation was carried out to find out how the breathing rate of a group of
   desert tortoises varied over a year.
   The results are shown in the table.

                                  Average breathing rate
                  Month
                                    (breaths/minute)
                  January                 2.8
                  February                2.9

                   March                 14.0

                   April                 20.2

                   May                   19.6
                   June                  20.4

                   July                  19.8

                  August                 19.5

                 September               20.4
                  October                16.8

                 November                 3.2

                 December                 2.7

   (a)  (i) Express, as a simple whole number ratio, the breathing rate in the
          months of January, March and October.               1
          Space for calculation

                                 :            :
                        January      March        October

                      *X807760114*

                             page 14
PDF page 15
Selectable page text
MARKS _{W}^{D}_{R}^{O}_{I} _{T}^{N}OT
                                                                   E IN
                                                                  THIS
                                                                 MARGIN
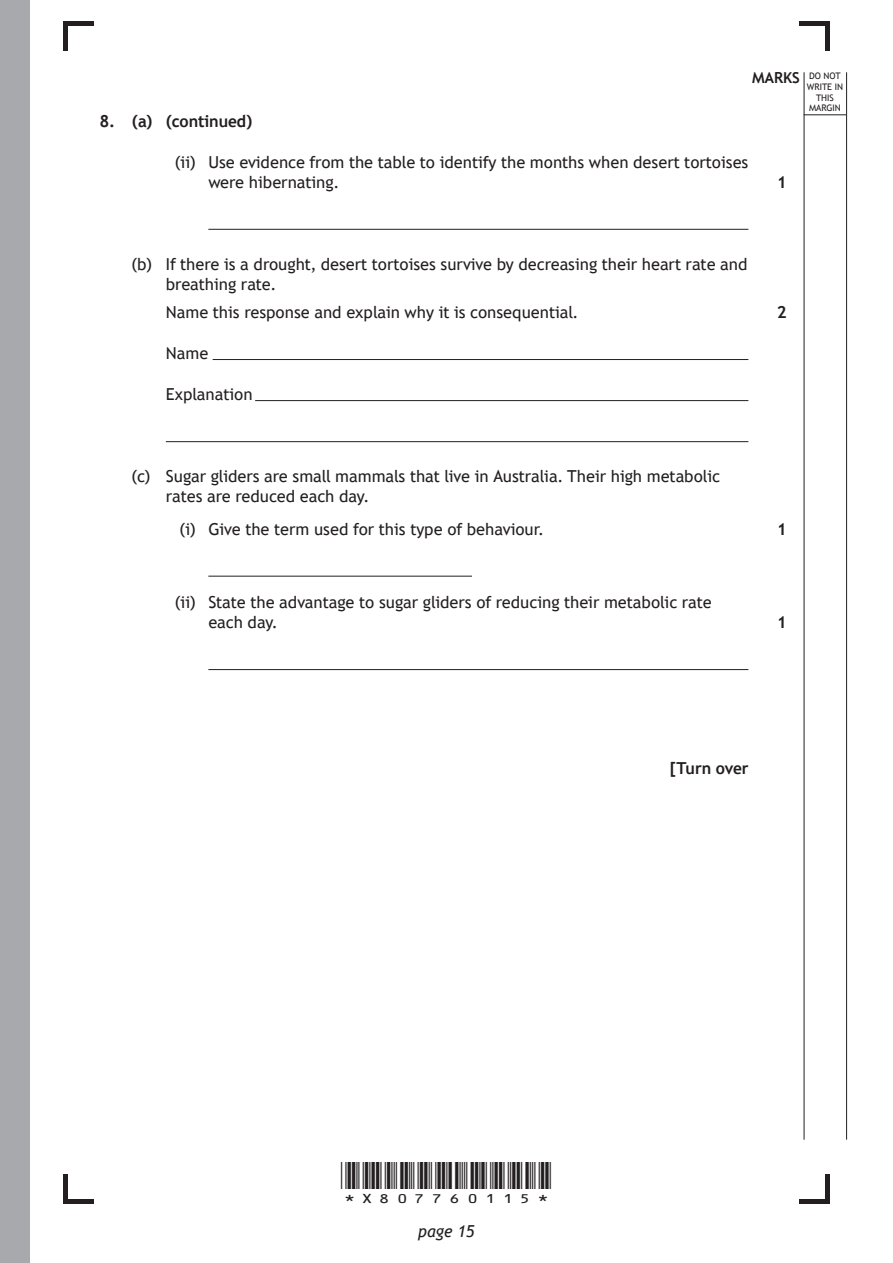
8. (a) (continued)
       (ii) Use evidence from the table to identify the months when desert tortoises
          were hibernating.                                   1

   (b) If there is a drought, desert tortoises survive by decreasing their heart rate and
      breathing rate.

      Name this response and explain why it is consequential. 2

      Name

      Explanation

   (c) Sugar gliders are small mammals that live in Australia. Their high metabolic
      rates are reduced each day.

        (i) Give the term used for this type of behaviour.    1

       (ii) State the advantage to sugar gliders of reducing their metabolic rate
          each day.                                           1

                                                     [Turn over

                      *X807760115*

                             page 15
PDF page 16
Paper 2, Question 9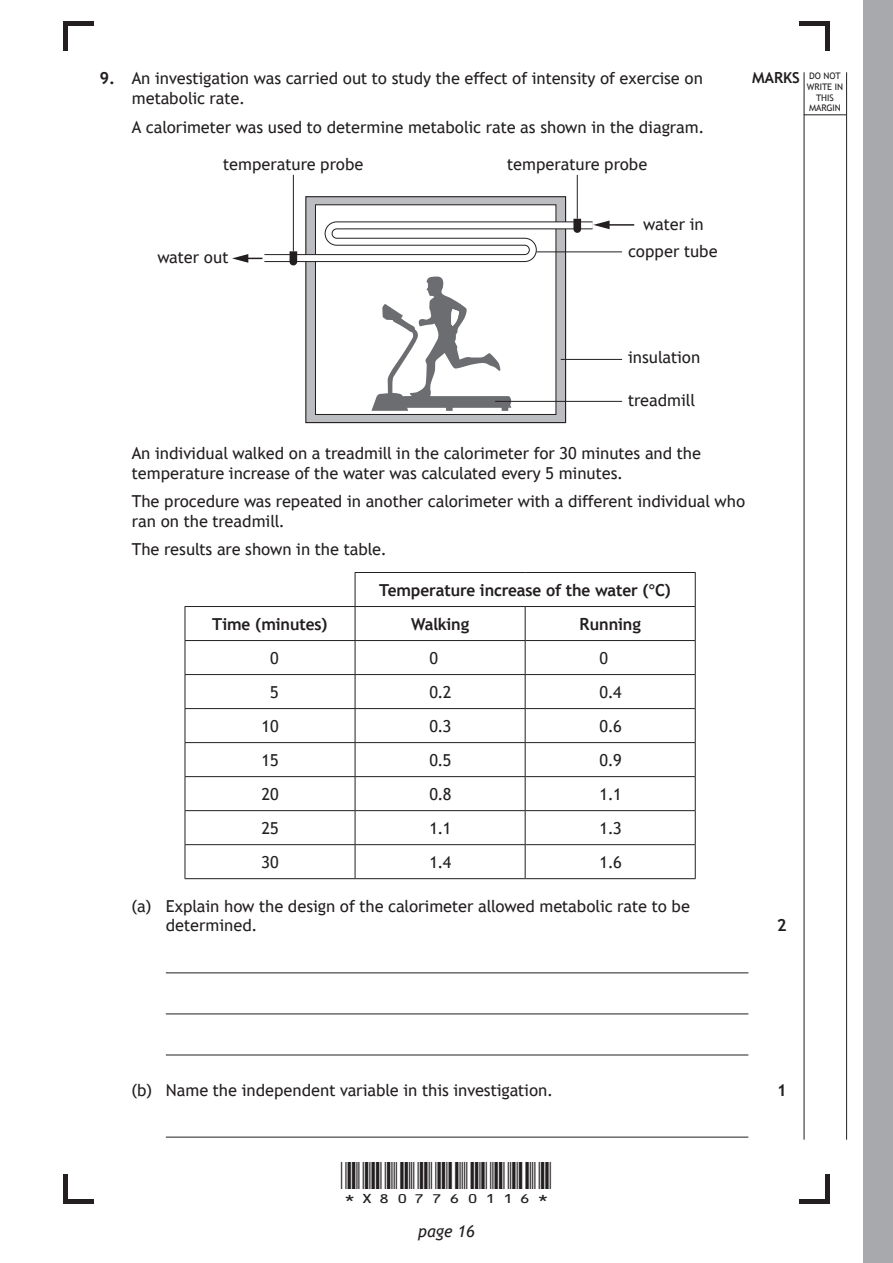
Selectable page text
9. An investigation was carried out to study the effect of intensity of exercise on MARKS _{W}^{D}_{R}^{O}_{I} _{T}^{N}OT
                                                                   E IN
   metabolic rate.                                                THIS
                                                                 MARGIN
   A calorimeter was used to determine metabolic rate as shown in the diagram.
            temperature probe         temperature probe

                                                  water in

                                                 copper tube
     water out

                                                 insulation

                                                 treadmill

   An individual walked on a treadmill in the calorimeter for 30 minutes and the
   temperature increase of the water was calculated every 5 minutes.
   The procedure was repeated in another calorimeter with a different individual who
   ran on the treadmill.

   The results are shown in the table.

                          Temperature increase of the water (°C)

           Time (minutes)    Walking        Running
                0             0               0

                5             0.2             0.4

               10             0.3             0.6

               15             0.5             0.9
               20             0.8             1.1

               25             1.1             1.3

               30             1.4             1.6

   (a) Explain how the design of the calorimeter allowed metabolic rate to be
      determined.                                             2

   (b) Name the independent variable in this investigation.   1

                      *X807760116*

                             page 16
PDF page 17
Selectable page text
MARKS _{W}^{D}_{R}^{O}_{I} _{T}^{N}OT
                                                                   E IN
                                                                  THIS
                                                                 MARGIN
9. (continued)
   (c) Identify two variables, not already mentioned, that should be controlled for a
      valid conclusion to be drawn.                           2
      1.

      2.

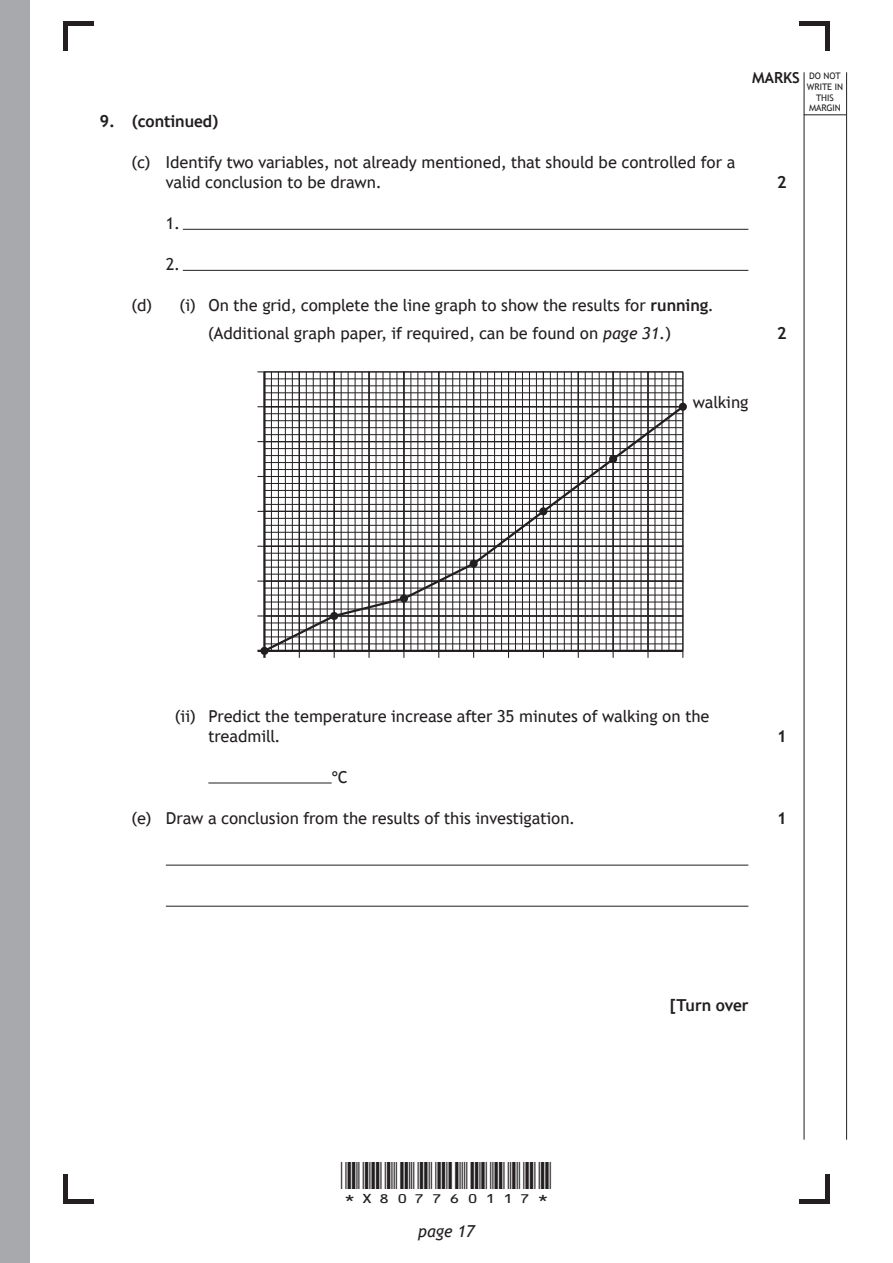
   (d)  (i) On the grid, complete the line graph to show the results for running.

          (Additional graph paper, if required, can be found on page 31.) 2

                                                       walking

       (ii) Predict the temperature increase after 35 minutes of walking on the
          treadmill.                                          1

                     °C

   (e) Draw a conclusion from the results of this investigation. 1

                                                     [Turn over

                      *X807760117*

                             page 17
PDF page 18
Paper 2, Question 10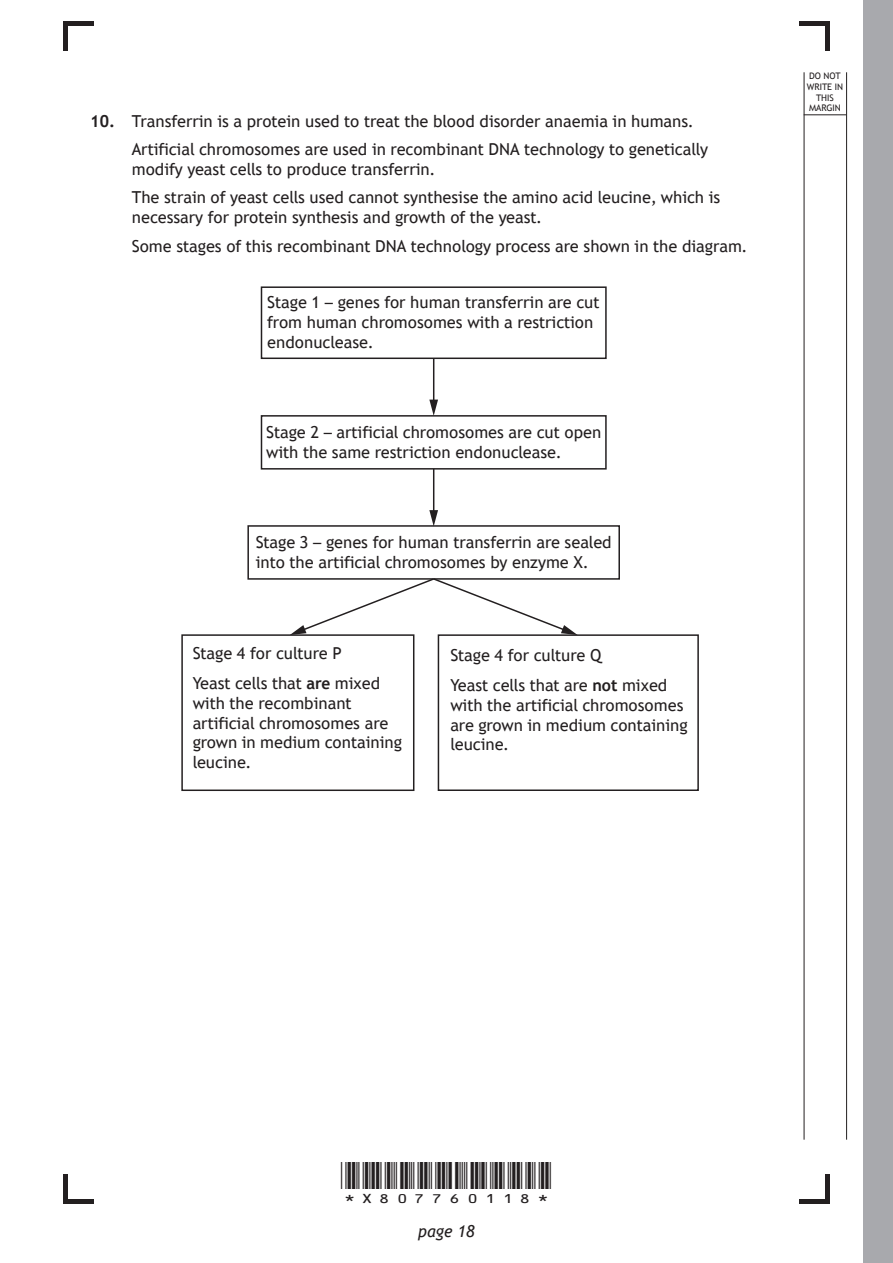
Selectable page text
DO NOT
                                                                  WRITE IN
                                                                   THIS
                                                                  MARGIN
10. Transferrin is a protein used to treat the blood disorder anaemia in humans.
    Artificial chromosomes are used in recombinant DNA technology to genetically
    modify yeast cells to produce transferrin.
    The strain of yeast cells used cannot synthesise the amino acid leucine, which is
    necessary for protein synthesis and growth of the yeast.
    Some stages of this recombinant DNA technology process are shown in the diagram.

                 Stage 1 – genes for human transferrin are cut
                 from human chromosomes with a restriction
                 endonuclease.

                Stage 2 – artificial chromosomes are cut open
                with the same restriction endonuclease.

                Stage 3 – genes for human transferrin are sealed
                into the artificial chromosomes by enzyme X.

          Stage 4 for culture P  Stage 4 for culture Q

          Yeast cells that are mixed Yeast cells that are not mixed
          with the recombinant   with the artificial chromosomes
          artificial chromosomes are are grown in medium containing
          grown in medium containing leucine.
          leucine.

                       *X807760118*

                              page 18
PDF page 19
Selectable page text
MARKS _{W}^{D}_{R}^{O}_{I} _{T}^{N}OT
                                                                    E IN
                                                                   THIS
                                                                  MARGIN
10. (continued)
    (a)  (i) State the term used to describe the artificial chromosome that carries
           the human gene into yeast cells.                    1

        (ii) State why an artificial chromosome rather than a plasmid may be used in
           recombinant DNA technology.                         1

    (b) Explain why the same restriction endonuclease is used in stages 1 and 2. 1

    (c) Name enzyme X used in stage 3.                         1

    (d) The artificial chromosome used contains a selectable marker gene that only
       allows transformed yeast cells to synthesise leucine.
       After stage 4, cultures P and Q were transferred to separate plates containing
       solid medium without leucine.

       After incubation, yeast cells only grew on the plate containing culture P.
       Explain this result.                                    2

                                                      [Turn over

                       *X807760119*

                              page 19
PDF page 20
Paper 2, Question 11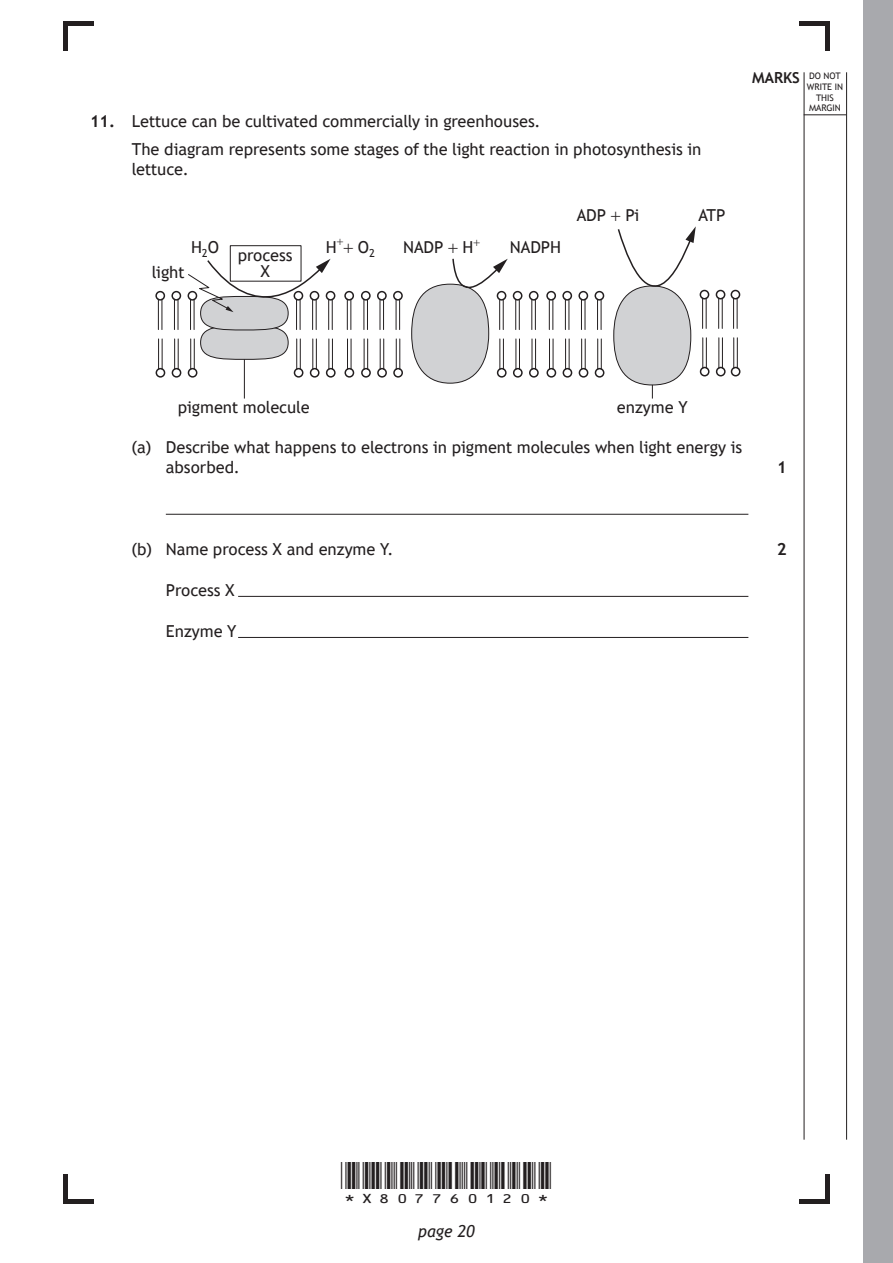
Selectable page text
MARKS _{W}^{D}_{R}^{O}_{I} _{T}^{N}OT
                                                                    E IN
                                                                   THIS
                                                                  MARGIN
11. Lettuce can be cultivated commercially in greenhouses.
    The diagram represents some stages of the light reaction in photosynthesis in
    lettuce.
                                             ADP + Pi   ATP
          H₂O         H⁺+ O₂ NADP + H⁺ NADPH
              process
      light     X

        pigment molecule                         enzyme Y

    (a) Describe what happens to electrons in pigment molecules when light energy is
       absorbed.                                               1

    (b) Name process X and enzyme Y.                           2

       Process X

       Enzyme Y

                       *X807760120*

                              page 20
PDF page 21
Selectable page text
MARKS _{W}^{D}_{R}^{O}_{I} _{T}^{N}OT
                                                                    E IN
                                                                   THIS
                                                                  MARGIN
11. (continued)
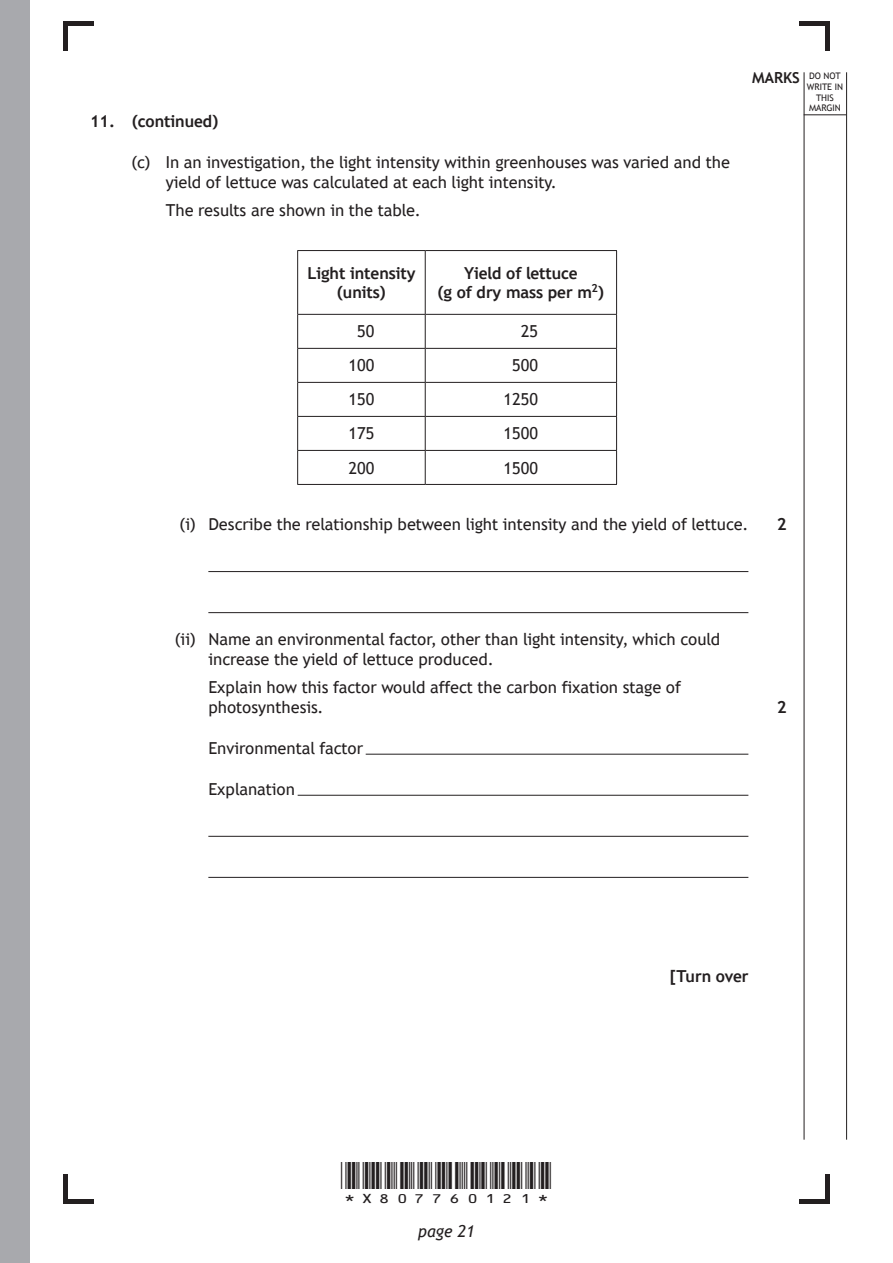
    (c) In an investigation, the light intensity within greenhouses was varied and the
       yield of lettuce was calculated at each light intensity.
       The results are shown in the table.

                    Light intensity Yield of lettuce
                       (units)  (g of dry mass per m²)

                         50             25
                        100            500

                        150           1250

                        175           1500

                        200           1500

         (i) Describe the relationship between light intensity and the yield of lettuce. 2

        (ii) Name an environmental factor, other than light intensity, which could
           increase the yield of lettuce produced.

           Explain how this factor would affect the carbon fixation stage of
           photosynthesis.                                     2

           Environmental factor

           Explanation

                                                      [Turn over

                       *X807760121*

                              page 21
PDF page 22
Paper 2, Question 12
Selectable page text
MARKS _{W}^{D}_{R}^{O}_{I} _{T}^{N}OT
                                                                    E IN
                                                                   THIS
                                                                  MARGIN
12. In the 1960s in Scotland, large areas of natural habitat were cleared to make way
    for a new motorway. This resulted in habitat fragments with reduced species and
    genetic diversity.
    (a) State the two components of species diversity.         2
       1.

       2.

    (b) It was suggested that the decrease in genetic diversity was a result of the
       bottleneck effect.

       Explain how the bottleneck effect may lead to the local extinction of certain
       species.                                                2

    (c) In an attempt to increase biodiversity, habitat fragments were linked together
       using tunnels under the motorway.

         (i) State the term used to describe these tunnels.    1

        (ii) Explain how these tunnels may result in an increase in biodiversity. 2

                       *X807760122*

                              page 22
PDF page 23
Paper 2, Question 13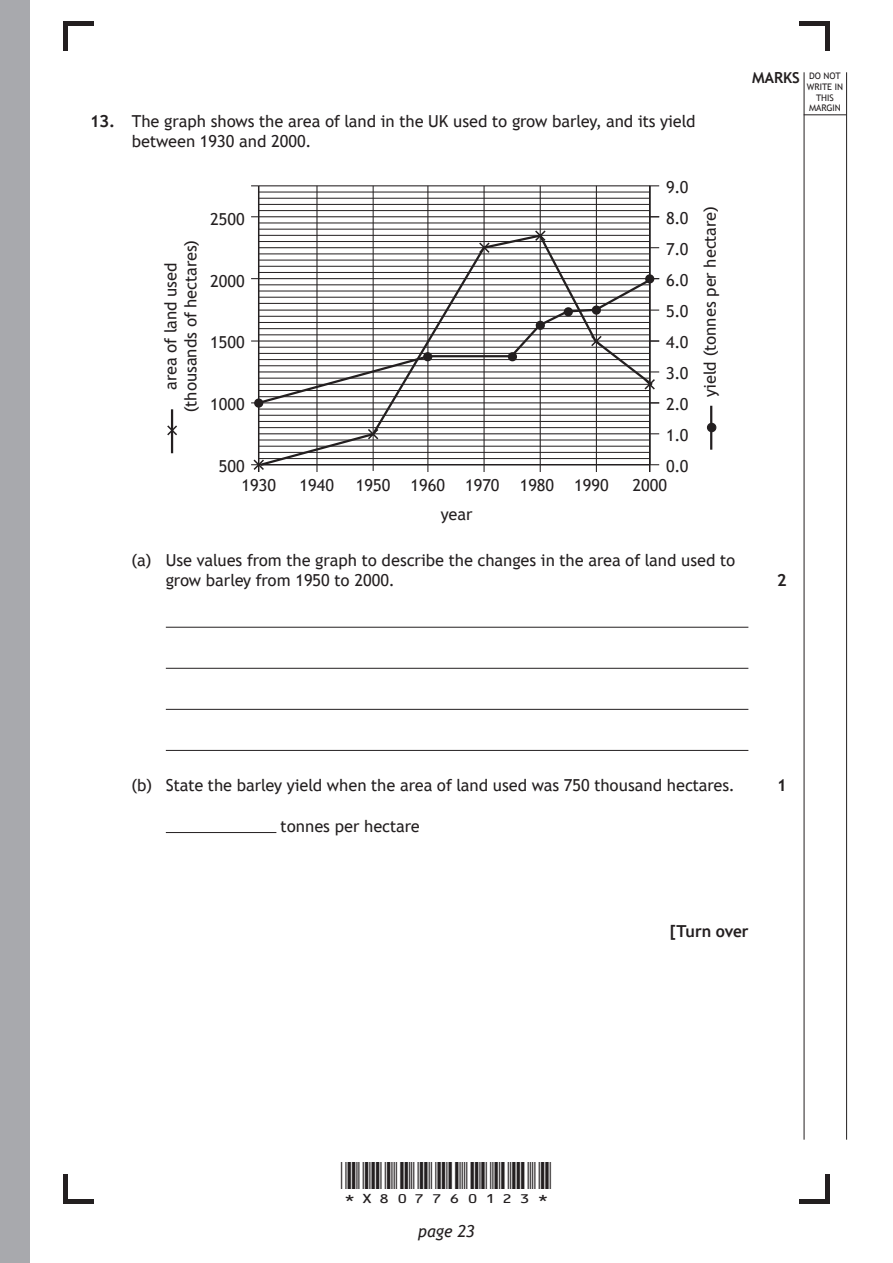
Selectable page text
MARKS _{W}^{D}_{R}^{O}_{I} _{T}^{N}OT
                                                                    E IN
                                                                   THIS
                                                                  MARGIN
13. The graph shows the area of land in the UK used to grow barley, and its yield
    between 1930 and 2000.

                       *X807760123*

                              page 23
       desu
       dnal
       fo
       aera
         )seratceh
         fo
         sdnasuoht(
                                                         )eratceh
                                                         rep
                                                         sennot(
                                                         dleiy
                                                     9.0
           2500                                      8.0
                                                     7.0
           2000                                      6.0
                                                     5.0
           1500                                      4.0
                                                     3.0
           1000                                      2.0
                                                     1.0
            500                                      0.0
              1930  1940 1950 1960 1970 1980 1990 2000
                                 year
    (a) Use values from the graph to describe the changes in the area of land used to
       grow barley from 1950 to 2000.                          2
    (b) State the barley yield when the area of land used was 750 thousand hectares. 1
                  tonnes per hectare
                                                      [Turn over
PDF page 24
Selectable page text
13. (continued)                                              MARKS _{W}^{D}_{R}^{O}_{I} _{T}^{N}OT
                                                                    E IN
                                                                   THIS
                                                                  MARGIN
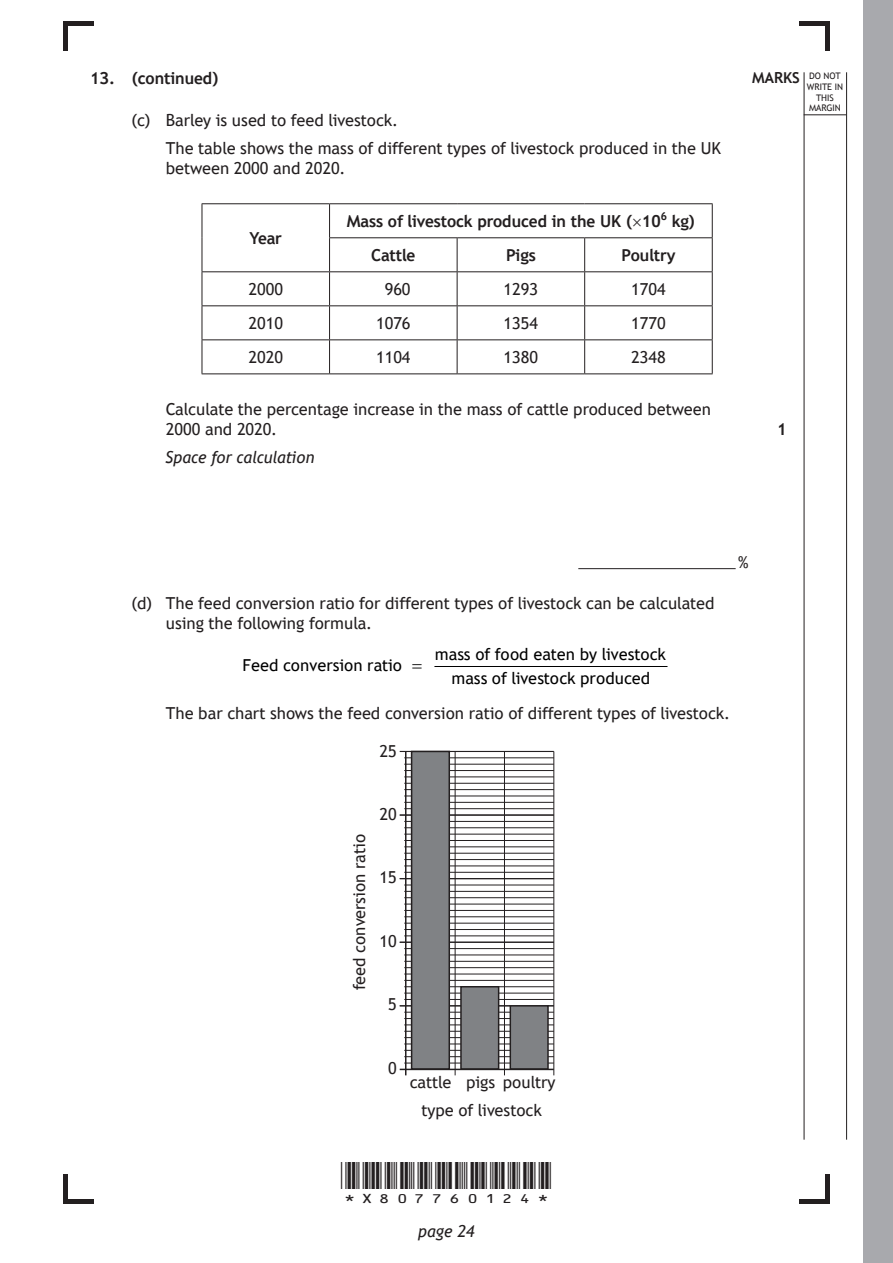
    (c) Barley is used to feed livestock.
       The table shows the mass of different types of livestock produced in the UK
       between 2000 and 2020.
                        Mass of livestock produced in the UK (×10⁶ kg)
               Year
                          Cattle       Pigs      Poultry
               2000        960        1293        1704

               2010        1076       1354        1770

               2020        1104       1380        2348

       Calculate the percentage increase in the mass of cattle produced between
       2000 and 2020.
       Space for calculation

                                                            %

    (d) The feed conversion ratio for different types of livestock can be calculated
       using the following formula.
                                mass of food eaten by livestock
              Feed conversion ratio =
                                  massof livestock produced
       The bar chart shows the feed conversion ratio of different types of livestock.

                       *X807760124*

                              page 24
                        oitar
                        noisrevnoc
                        deef
                                                               1
                           25
                           20
                           15
                           10
                            5
                            0
                              cattle pigs poultry
                               type of livestock
PDF page 25

Selectable page text
MARKS _{W}^{D}_{R}^{O}_{I} _{T}^{N}OT
                                                                    E IN
                                                                   THIS
                                                                  MARGIN
13. (d) (continued)
       Use information in the table and bar chart to calculate the total mass of feed
       required for poultry production in the UK in 2020.      1
       Space for calculation

                                                        ×10⁶ kg

    (e) Using information in the bar chart explain why eating poultry or pigs reduces
       the impact on food security compared with eating cattle. 2

                                                      [Turn over

                       *X807760125*

                              page 25
PDF page 26
Paper 2, Question 14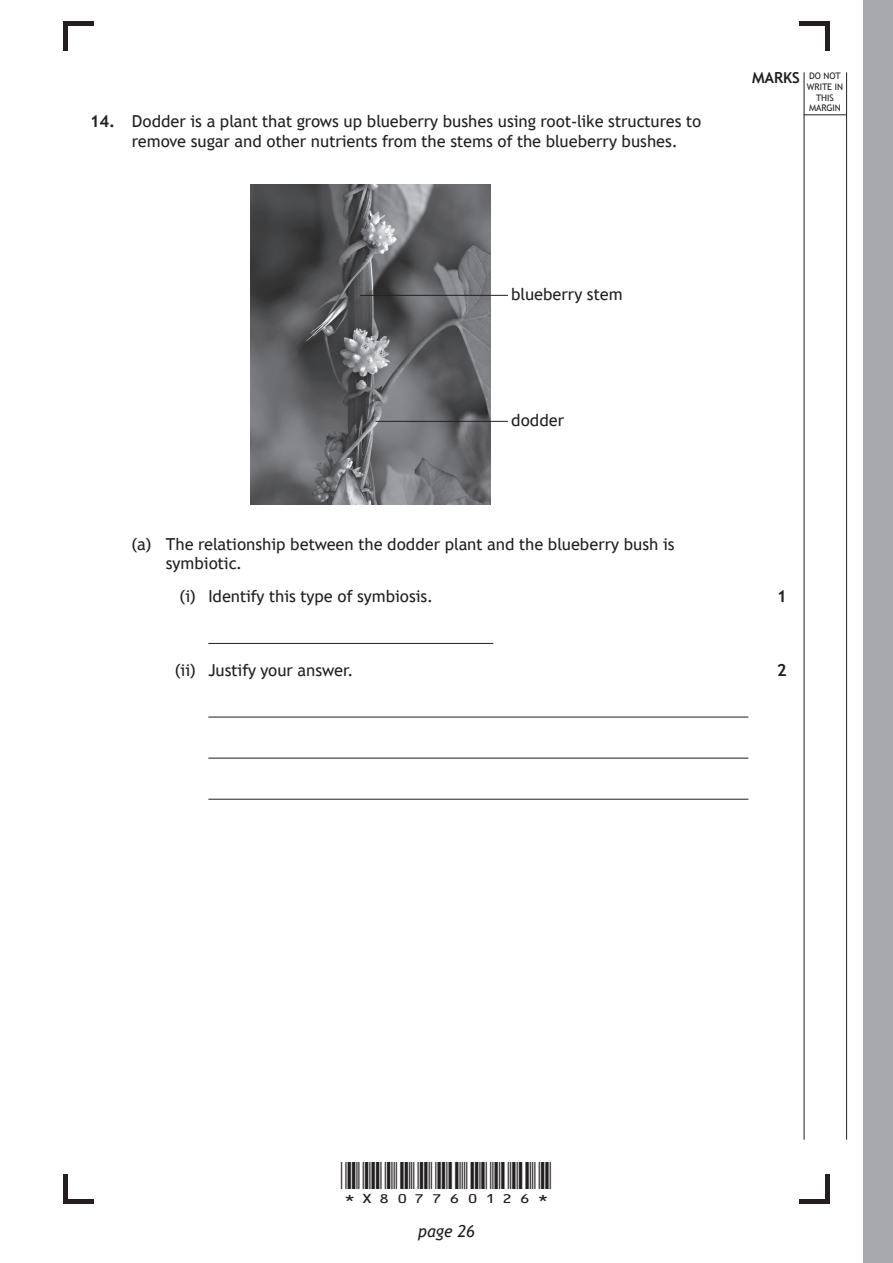
Selectable page text
MARKS _{W}^{D}_{R}^{O}_{I} _{T}^{N}OT
                                                                    E IN
                                                                   THIS
                                                                  MARGIN
14. Dodder is a plant that grows up blueberry bushes using root-like structures to
    remove sugar and other nutrients from the stems of the blueberry bushes.

                                       blueberry stem

                                       dodder

    (a) The relationship between the dodder plant and the blueberry bush is
       symbiotic.
         (i) Identify this type of symbiosis.                  1

        (ii) Justify your answer.                              2

                       *X807760126*

                              page 26
PDF page 27
Selectable page text
MARKS _{W}^{D}_{R}^{O}_{I} _{T}^{N}OT
                                                                    E IN
                                                                   THIS
                                                                  MARGIN
14. (continued)
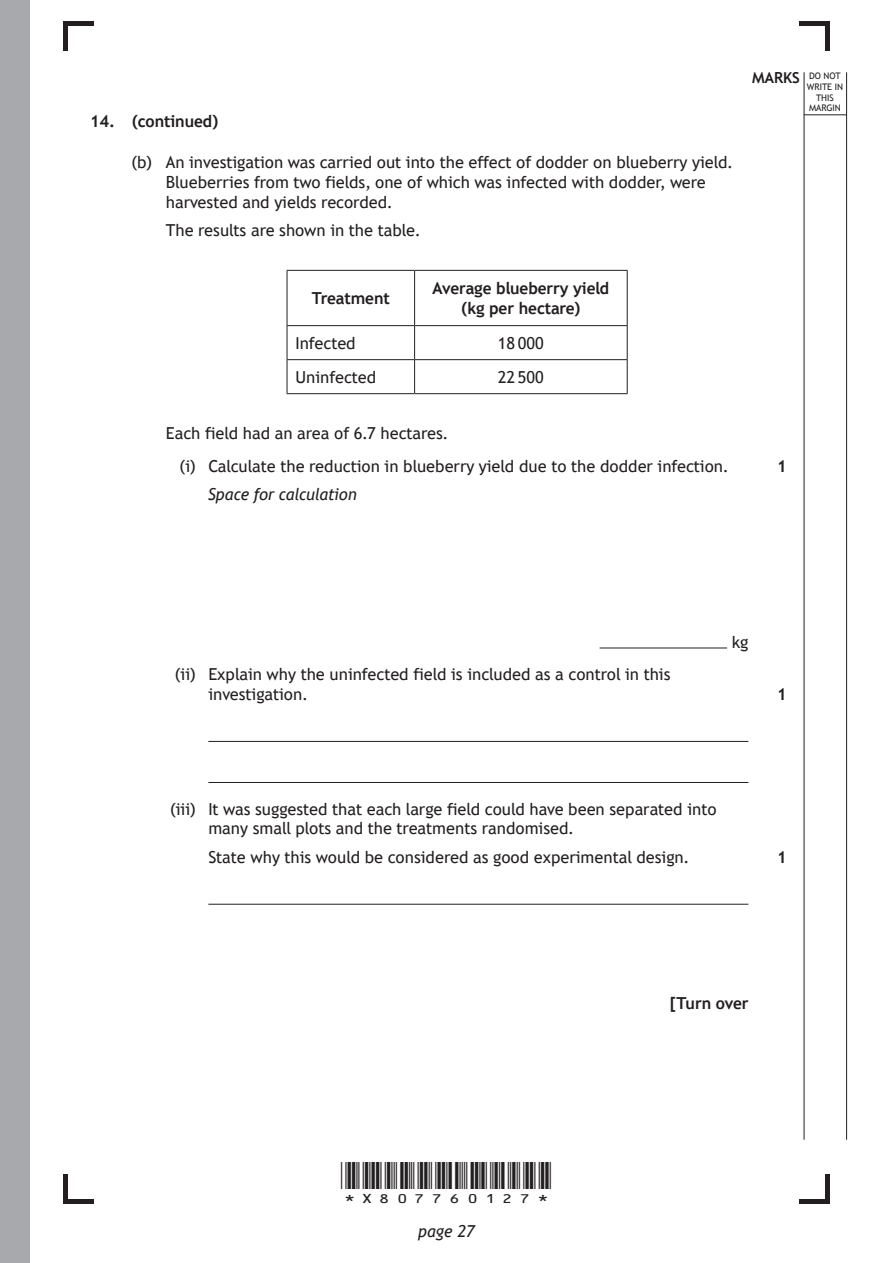
    (b) An investigation was carried out into the effect of dodder on blueberry yield.
       Blueberries from two fields, one of which was infected with dodder, were
       harvested and yields recorded.
       The results are shown in the table.

                                Average blueberry yield
                     Treatment
                                  (kg per hectare)
                   Infected           18 000

                   Uninfected         22 500

       Each field had an area of 6.7 hectares.

         (i) Calculate the reduction in blueberry yield due to the dodder infection. 1
           Space for calculation

                                                           kg
        (ii) Explain why the uninfected field is included as a control in this
           investigation.                                      1

        (iii) It was suggested that each large field could have been separated into
           many small plots and the treatments randomised.

           State why this would be considered as good experimental design. 1

                                                      [Turn over

                       *X807760127*

                              page 27
PDF page 28
Paper 2, Question 15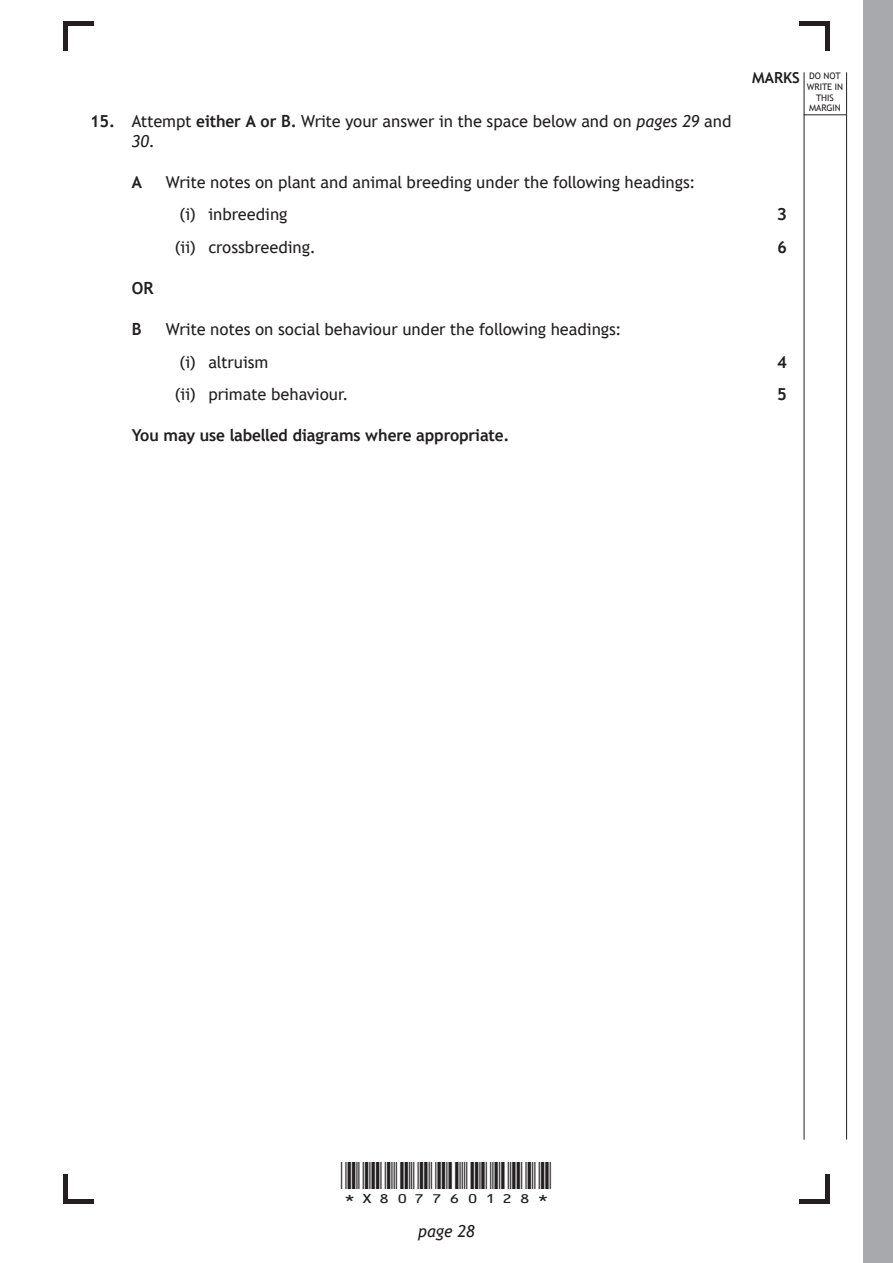
Selectable page text
MARKS _{W}^{D}_{R}^{O}_{I} _{T}^{N}OT
                                                                    E IN
                                                                   THIS
                                                                  MARGIN
15. Attempt either A or B. Write your answer in the space below and on pages 29 and
    30.
    A  Write notes on plant and animal breeding under the following headings:
         (i) inbreeding                                        3
        (ii) crossbreeding.                                    6

    OR

    B  Write notes on social behaviour under the following headings:
         (i) altruism                                          4

        (ii) primate behaviour.                                5

    You may use labelled diagrams where appropriate.

                       *X807760128*

                              page 28
PDF page 29

Selectable page text
MARKS _{W}^{D}_{R}^{O}_{I} _{T}^{N}OT
                                                      E IN
                                                     THIS
                                                    MARGIN
ADDITIONAL SPACE FOR ANSWER to question 15

         *X807760129*

                page 29                 [Turn over
PDF page 30

Selectable page text
MARKS _{W}^{D}_{R}^{O}_{I} _{T}^{N}OT
                                                      E IN
                                                     THIS
                                                    MARGIN
ADDITIONAL SPACE FOR ANSWER to question 15

          [END OF QUESTION PAPER]

         *X807760130*

                page 30
PDF page 31
Selectable page text
MARKS _{W}^{D}_{R}^{O}_{I} _{T}^{N}OT
                                                                    E IN
                                                                   THIS
                                                                  MARGIN
            ADDITIONAL SPACE FOR ANSWERS AND ROUGH WORK
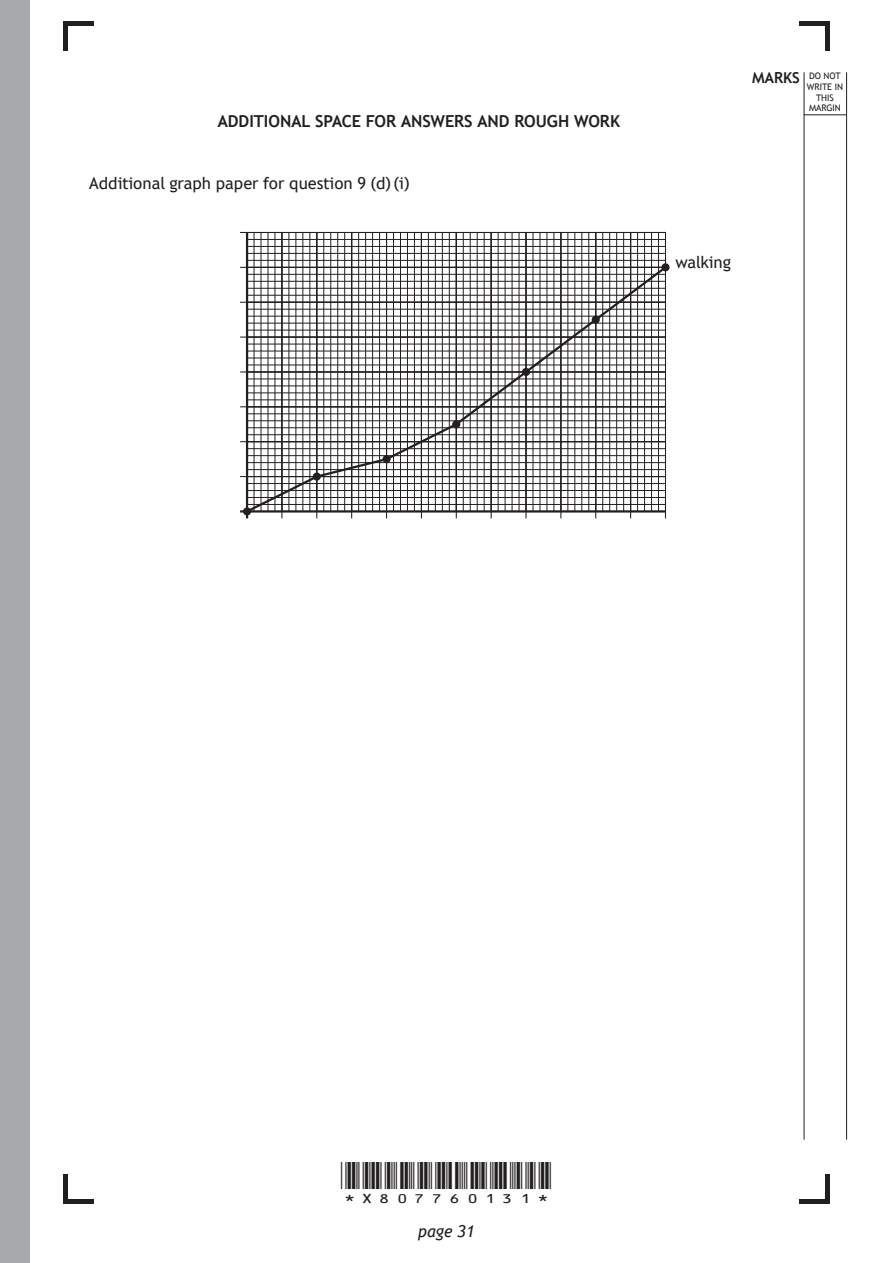
Additional graph paper for question 9 (d) (i)

                                                      walking

                       *X807760131*

                              page 31
PDF page 32

Selectable page text
MARKS _{W}^{D}_{R}^{O}_{I} _{T}^{N}OT
                                                        E IN
                                                       THIS
                                                      MARGIN
ADDITIONAL SPACE FOR ANSWERS AND ROUGH WORK

           *X807760132*

                  page 32
PDF page 33

Selectable page text
MARKS _{W}^{D}_{R}^{O}_{I} _{T}^{N}OT
                                                        E IN
                                                       THIS
                                                      MARGIN
ADDITIONAL SPACE FOR ANSWERS AND ROUGH WORK

           *X807760133*

                  page 33
PDF page 34

Selectable page text
[BLANK PAGE]

DO NOT WRITE ON THIS PAGE

*X807760134*

       page 34
PDF page 35

Selectable page text
[BLANK PAGE]

DO NOT WRITE ON THIS PAGE

*X807760135*

       page 35
PDF page 36

Selectable page text
[BLANK PAGE]

                       DO NOT WRITE ON THIS PAGE

Acknowledgement of copyright
Question 14 Eifel-Details/shutterstock.com

                       *X807760136*

                              page 36