2026 Higher Biology - Paper 1 questions
Source: Scottish Qualifications Authority (SQA) / Qualifications Scotland. This is a StemInteract HTML companion, not an official HTML edition. Selectable text is supplied alongside original page images. Use the images or original PDF for equations, powers, fractions, vector notation, tables and diagrams; text extraction cannot fully preserve mathematical layout.
Jump to a question
PDF page 1
Selectable page text
H
National
Qualications
2026
X807/76/12 Biology
Paper 1 — Multiple choice
TUESDAY, 28 APRIL
9:00 AM – 9:40 AM
Total marks — 25
Attempt ALL questions.
You may use a calculator.
Instructions for the completion of Paper 1 are given on page 02 of your answer booklet
X807/76/02.
Record your answers on the answer grid on page 03 of your answer booklet.
Space for rough work is provided at the end of this booklet.
You must leave your answer booklet on your desk; if you do not, you could lose all the marks for
this paper.
*X8077612*
A/HTP
© Qualifications Scotland 2026PDF page 2
Paper 1, Question 1Paper 1, Question 2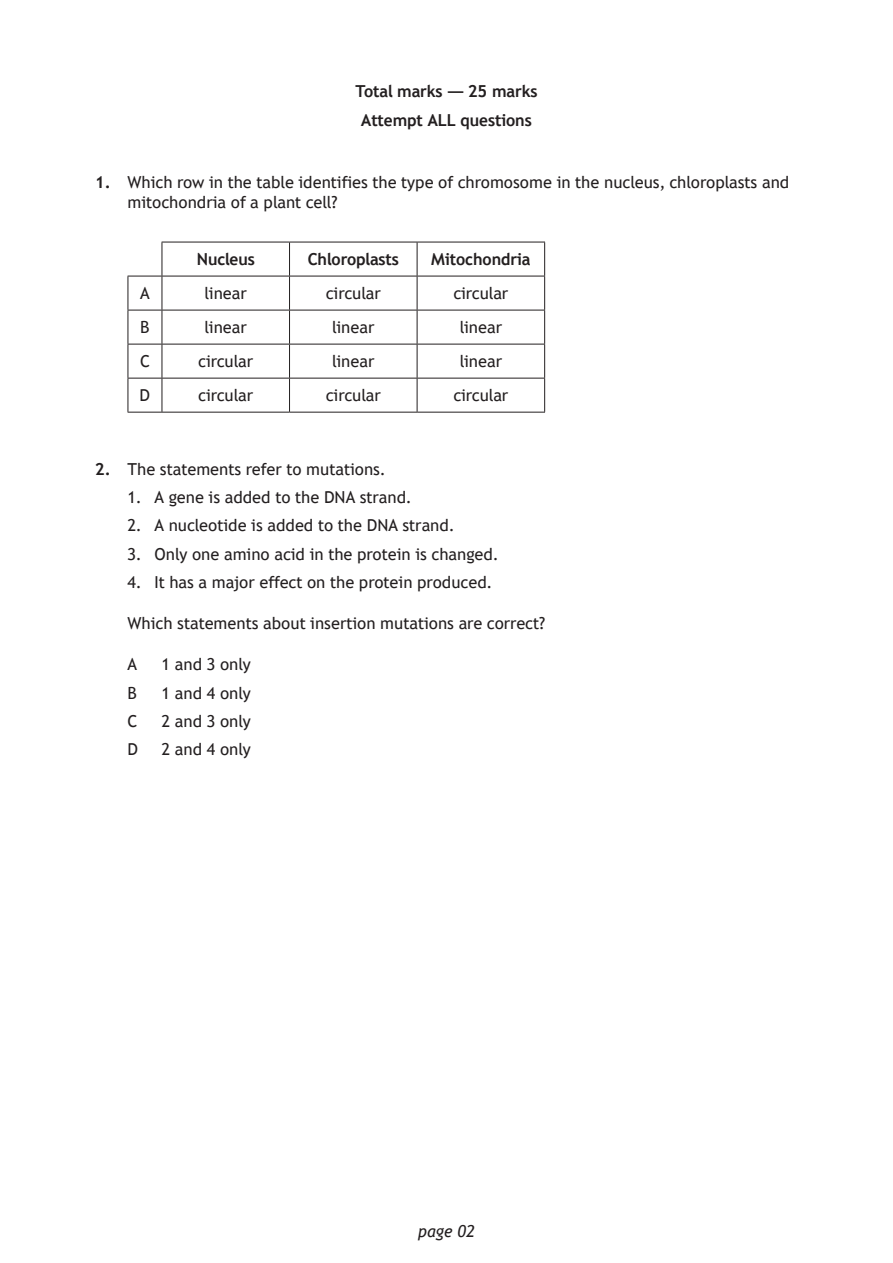
Selectable page text
Total marks — 25 marks

                        Attempt ALL questions

1. Which row in the table identifies the type of chromosome in the nucleus, chloroplasts and
   mitochondria of a plant cell?

         Nucleus   Chloroplasts Mitochondria

    A     linear     circular    circular
    B     linear      linear     linear

    C    circular     linear     linear

    D    circular    circular    circular

2. The statements refer to mutations.
   1. A gene is added to the DNA strand.

   2. A nucleotide is added to the DNA strand.
   3. Only one amino acid in the protein is changed.

   4. It has a major effect on the protein produced.

   Which statements about insertion mutations are correct?

   A  1 and 3 only
   B  1 and 4 only

   C  2 and 3 only
   D  2 and 4 only

                             page 02
PDF page 3
Paper 1, Question 3Paper 1, Question 4Paper 1, Question 5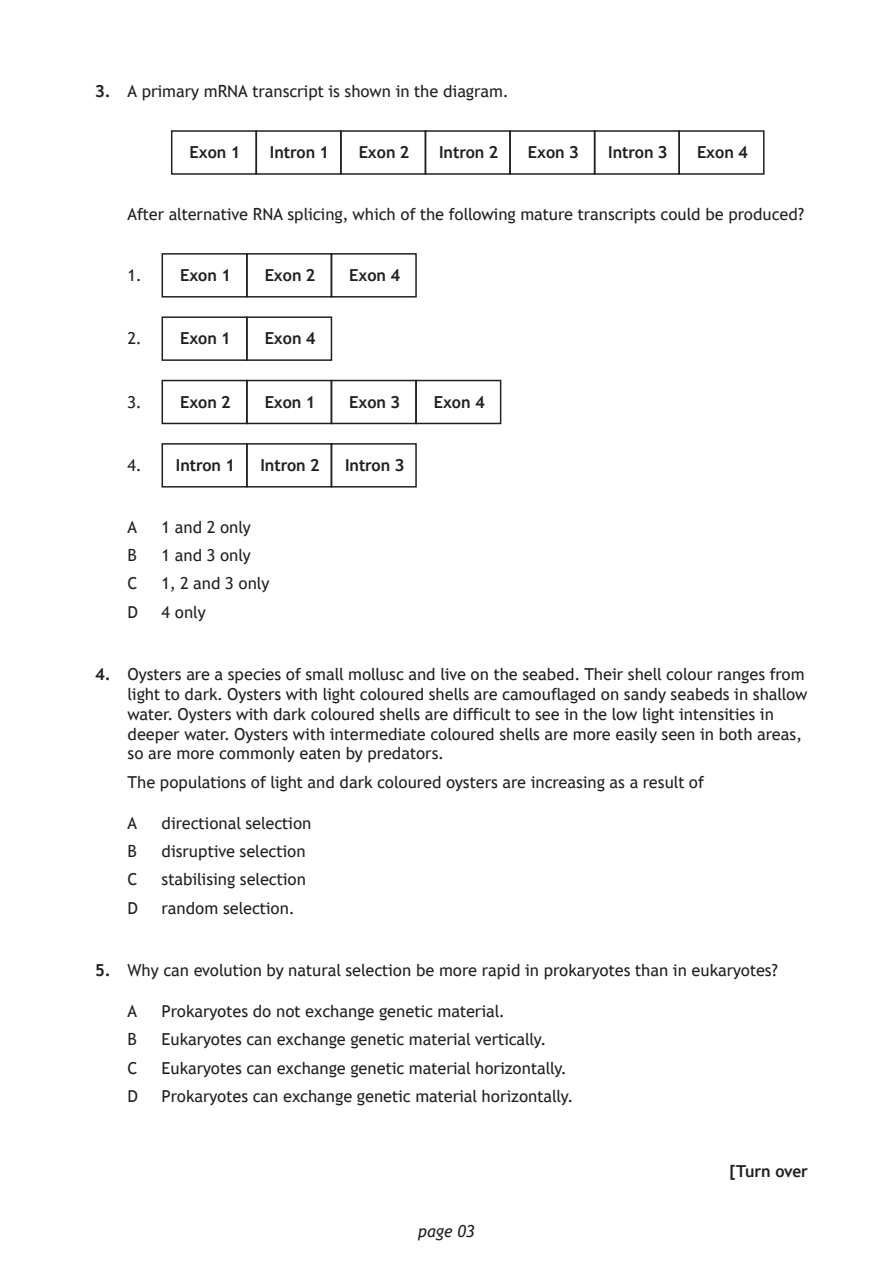
Selectable page text
3. A primary mRNA transcript is shown in the diagram.

        Exon 1  Intron 1 Exon 2 Intron 2 Exon 3 Intron 3 Exon 4

   After alternative RNA splicing, which of the following mature transcripts could be produced?

   1.   Exon 1 Exon 2  Exon 4

   2.   Exon 1 Exon 4

   3.   Exon 2 Exon 1  Exon 3  Exon 4

   4.  Intron 1 Intron 2 Intron 3

   A  1 and 2 only
   B  1 and 3 only

   C  1, 2 and 3 only
   D  4 only

4. Oysters are a species of small mollusc and live on the seabed. Their shell colour ranges from
   light to dark. Oysters with light coloured shells are camouflaged on sandy seabeds in shallow
   water. Oysters with dark coloured shells are difficult to see in the low light intensities in
   deeper water. Oysters with intermediate coloured shells are more easily seen in both areas,
   so are more commonly eaten by predators.

   The populations of light and dark coloured oysters are increasing as a result of

   A  directional selection
   B  disruptive selection

   C  stabilising selection
   D  random selection.

5. Why can evolution by natural selection be more rapid in prokaryotes than in eukaryotes?

   A  Prokaryotes do not exchange genetic material.
   B  Eukaryotes can exchange genetic material vertically.
   C  Eukaryotes can exchange genetic material horizontally.

   D  Prokaryotes can exchange genetic material horizontally.

                                                          [Turn over

                             page 03
PDF page 4
Paper 1, Question 6Paper 1, Question 7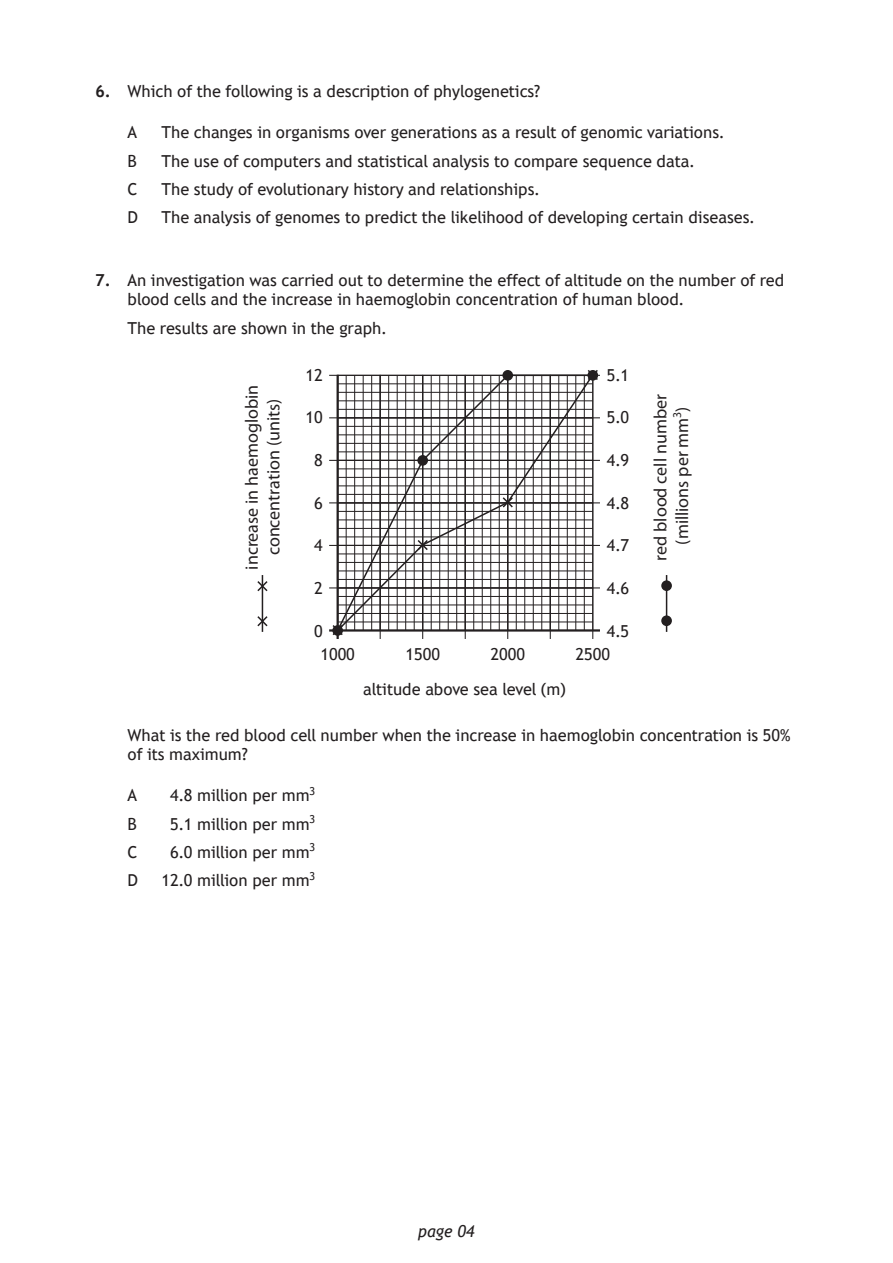
Selectable page text
6. Which of the following is a description of phylogenetics?

   A  The changes in organisms over generations as a result of genomic variations.

   B  The use of computers and statistical analysis to compare sequence data.
   C  The study of evolutionary history and relationships.

   D  The analysis of genomes to predict the likelihood of developing certain diseases.

7. An investigation was carried out to determine the effect of altitude on the number of red
   blood cells and the increase in haemoglobin concentration of human blood.
   The results are shown in the graph.

                   12                          5.1

                   10                          5.0

                    8                          4.9

                    6                          4.8

                    4                          4.7

                    2                          4.6

                    0                          4.5

                        altitude above sea level (m)

                             page 04
             nibolgomeah
             ni
             esaercni
               )stinu(
               noitartnecnoc
                                                   rebmun
                                                   llec
                                                   doolb
                                                   der
                                                     )3mm
                                                     rep
                                                     snoillim(
                    1000    1500    2000    2500
   What is the red blood cell number when the increase in haemoglobin concentration is 50%
   of its maximum?
   A   4.8 million per mm³
   B   5.1 million per mm³
   C   6.0 million per mm³
   D  12.0 million per mm³
PDF page 5
Paper 1, Question 8Paper 1, Question 9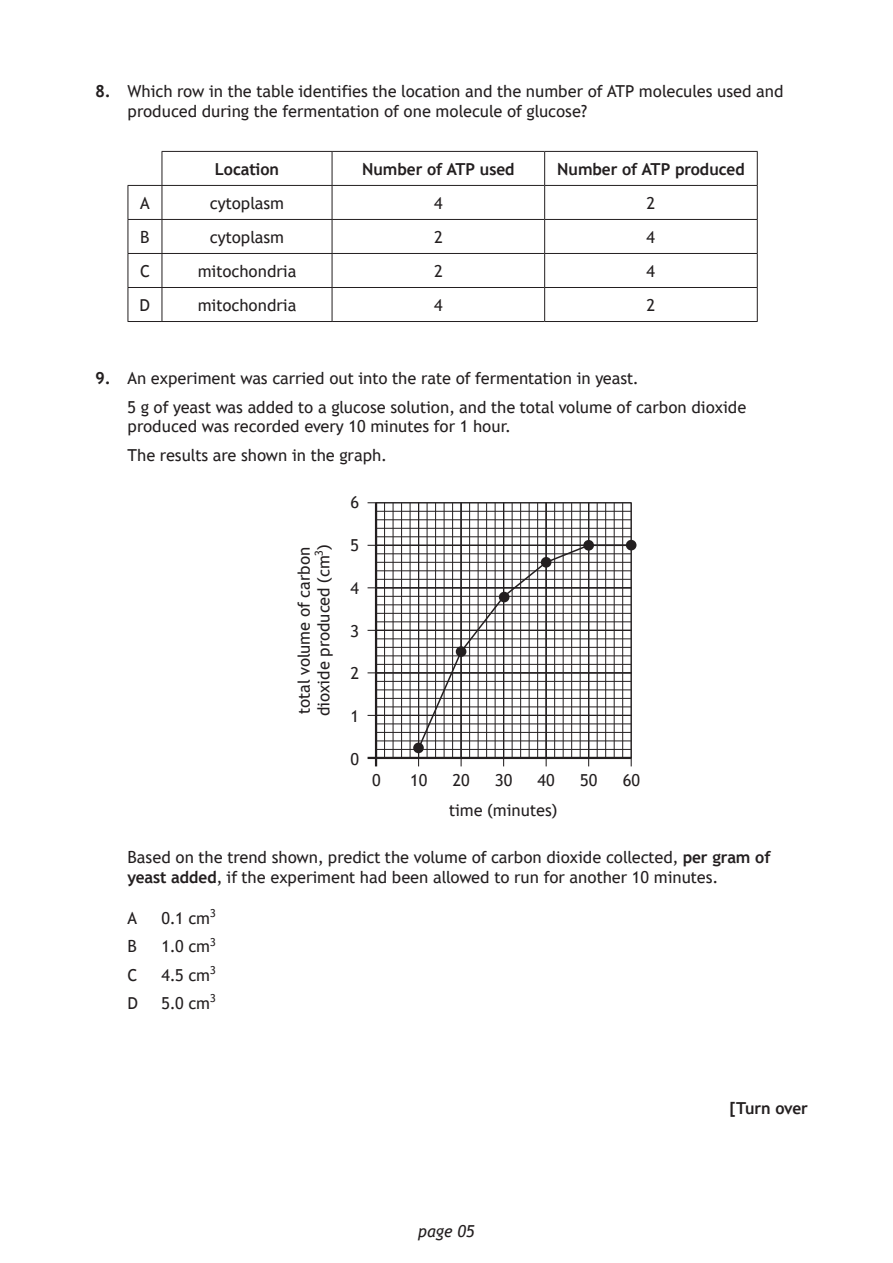
Selectable page text
8. Which row in the table identifies the location and the number of ATP molecules used and
   produced during the fermentation of one molecule of glucose?

           Location     Number of ATP used Number of ATP produced

    A     cytoplasm            4                  2

    B     cytoplasm            2                  4

    C    mitochondria          2                  4
    D    mitochondria          4                  2

9. An experiment was carried out into the rate of fermentation in yeast.

   5 g of yeast was added to a glucose solution, and the total volume of carbon dioxide
   produced was recorded every 10 minutes for 1 hour.
   The results are shown in the graph.

                         0   10  20  30 40  50  60
                                time (minutes)

                             page 05
                  nobrac
                  fo
                  emulov
                  latot
                    )3mc(
                    decudorp
                    edixoid
                       6
                       5
                       4
                       3
                       2
                       1
                       0
   Based on the trend shown, predict the volume of carbon dioxide collected, per gram of
   yeast added, if the experiment had been allowed to run for another 10 minutes.
   A  0.1 cm³
   B  1.0 cm³
   C  4.5 cm³
   D  5.0 cm³
                                                          [Turn over
PDF page 6
Paper 1, Question 10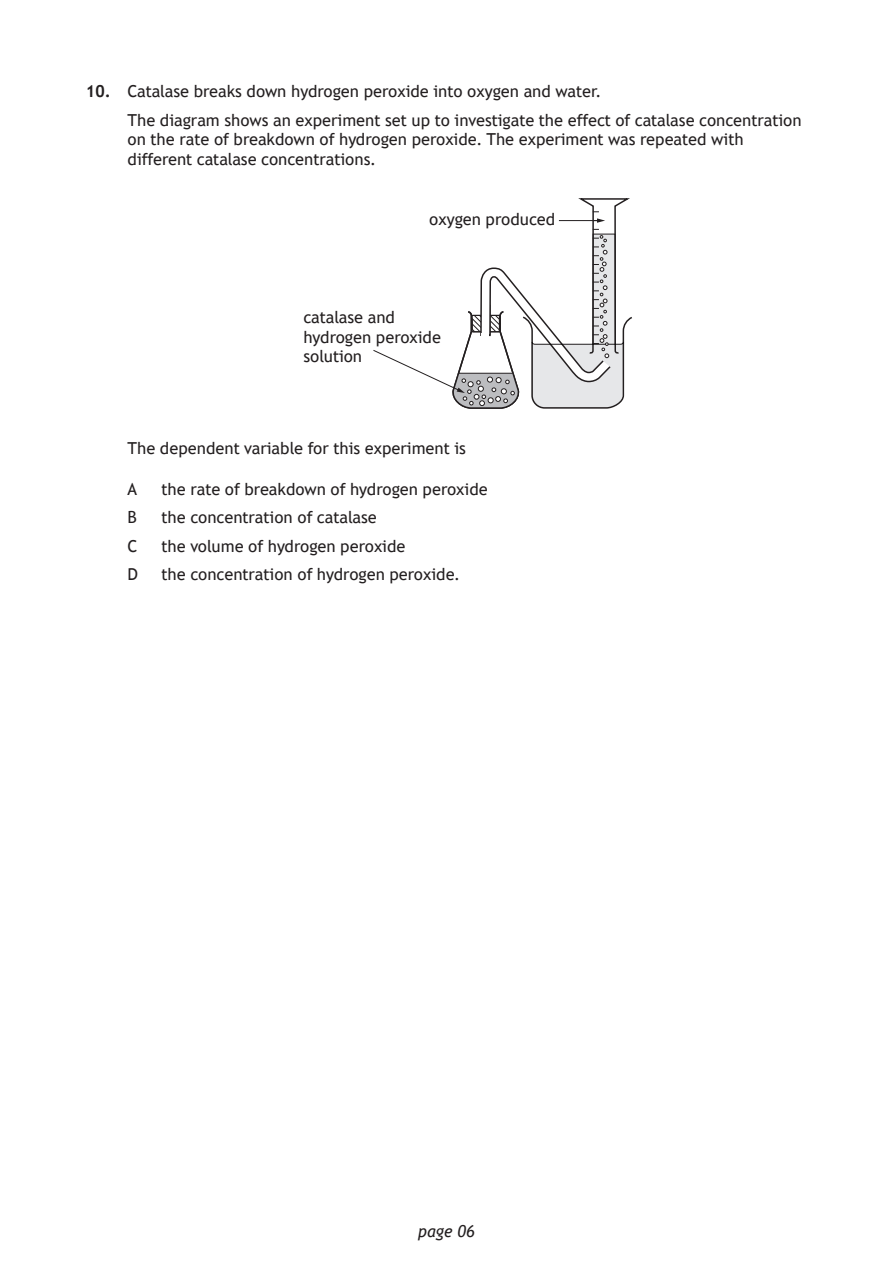
Selectable page text
10. Catalase breaks down hydrogen peroxide into oxygen and water.

    The diagram shows an experiment set up to investigate the effect of catalase concentration
    on the rate of breakdown of hydrogen peroxide. The experiment was repeated with
    different catalase concentrations.

                               oxygen produced

                    catalase and
                    hydrogen peroxide
                    solution

    The dependent variable for this experiment is

    A  the rate of breakdown of hydrogen peroxide
    B  the concentration of catalase

    C  the volume of hydrogen peroxide
    D  the concentration of hydrogen peroxide.

                              page 06
PDF page 7
Paper 1, Question 11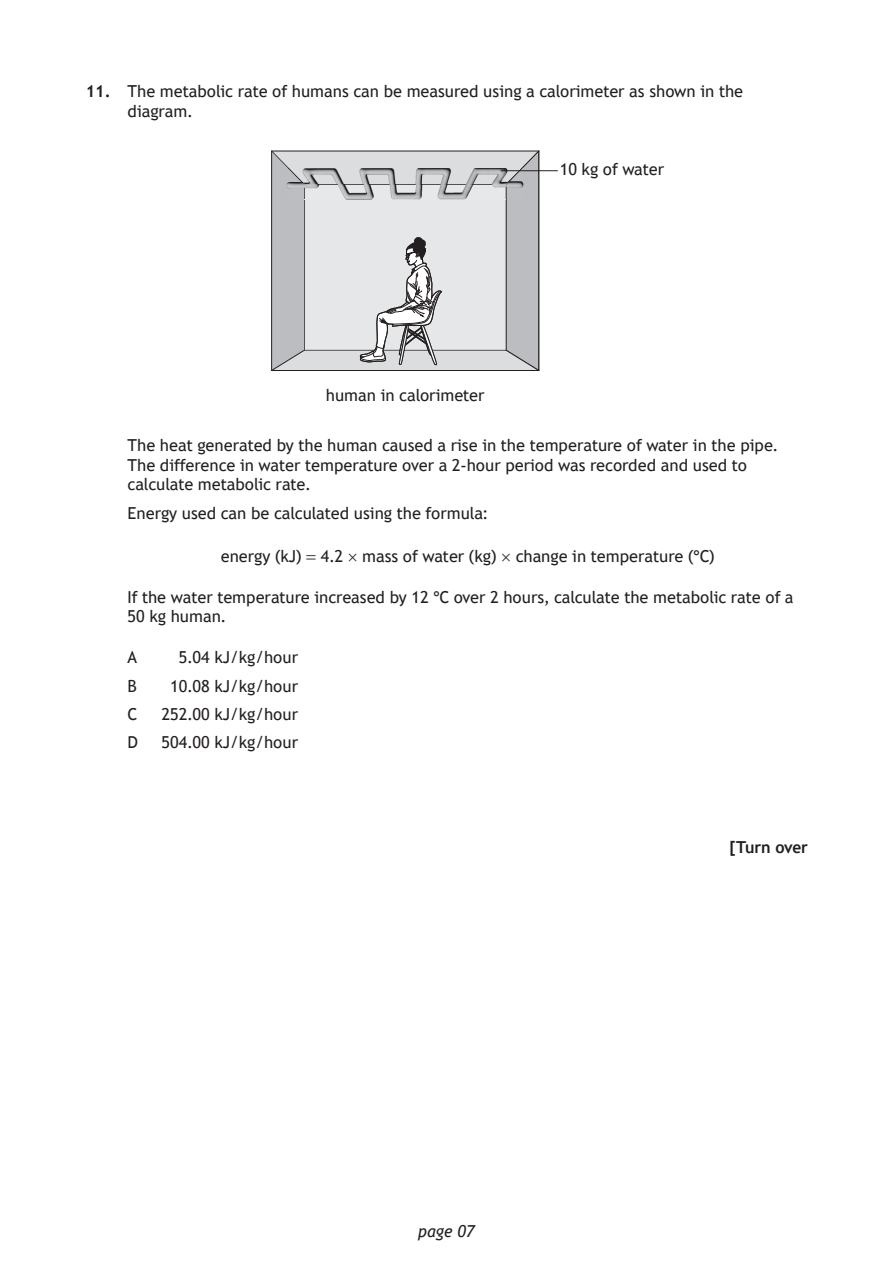
Selectable page text
11. The metabolic rate of humans can be measured using a calorimeter as shown in the
    diagram.

                                           10 kg of water

                      human in calorimeter

    The heat generated by the human caused a rise in the temperature of water in the pipe.
    The difference in water temperature over a 2‑hour period was recorded and used to

    calculate metabolic rate.
    Energy used can be calculated using the formula:

            energy (kJ) = 4.2 × mass of water (kg) × change in temperature (°C)

    If the water temperature increased by 12 °C over 2 hours, calculate the metabolic rate of a
    50 kg human.

    A   5.04 kJ/kg/hour

    B   10.08 kJ/kg/hour
    C  252.00 kJ/kg/hour

    D  504.00 kJ/kg/hour

                                                           [Turn over

                              page 07
PDF page 8
Paper 1, Question 12Paper 1, Question 13Paper 1, Question 14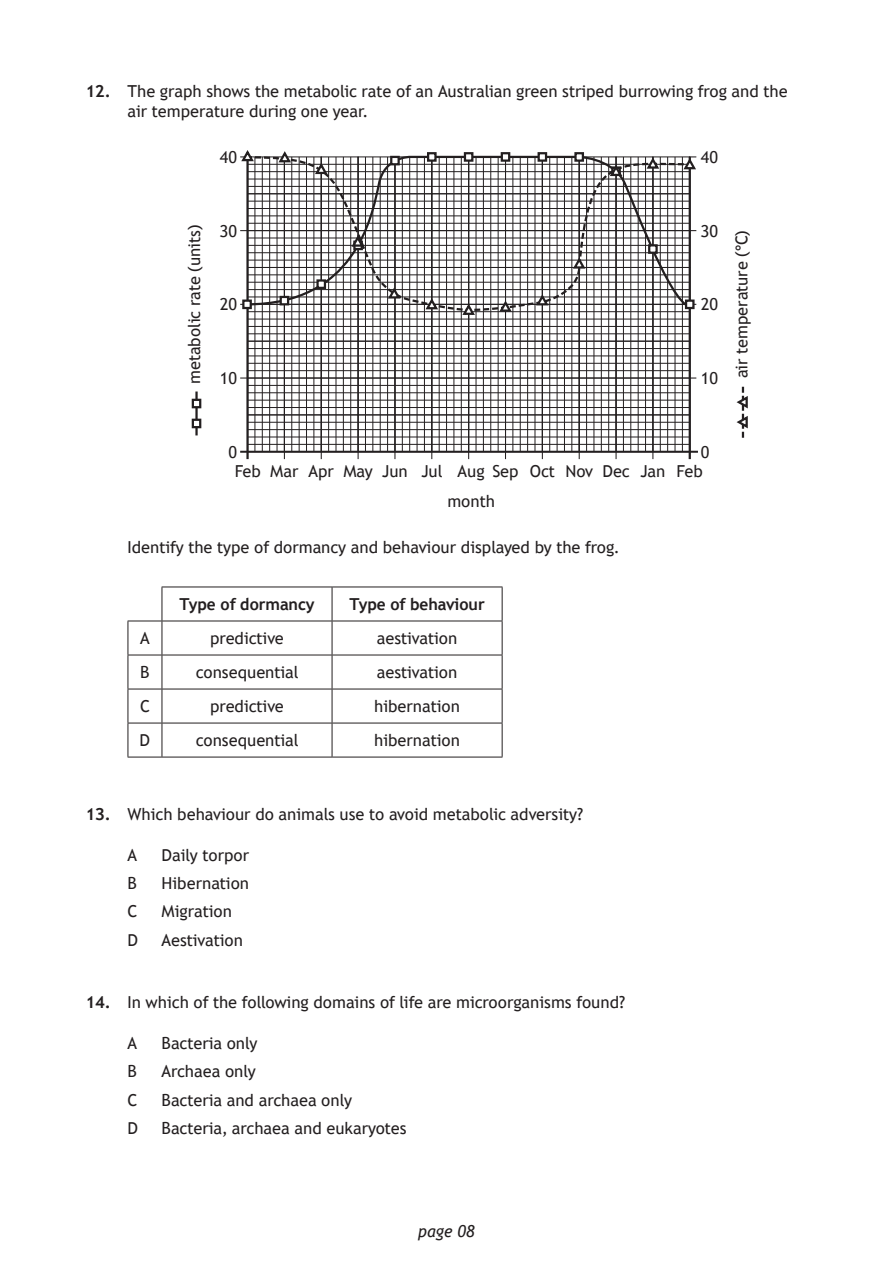
Selectable page text
12. The graph shows the metabolic rate of an Australian green striped burrowing frog and the
    air temperature during one year.

            40

            30

            20

            10

             0
              Feb Mar Apr May Jun Jul Aug Sep Oct Nov Dec Jan Feb
                                 month

                              page 08
         )stinu(
         etar
         cilobatem
                                                        40
                                                        30
                                                        20
                                                        10
                                                        0
                                                            )C°(
                                                            erutarepmet
                                                            ria
    Identify the type of dormancy and behaviour displayed by the frog.
         Type of dormancy Type of behaviour
     A     predictive      aestivation
     B    consequential    aestivation
     C     predictive     hibernation
     D    consequential   hibernation
13. Which behaviour do animals use to avoid metabolic adversity?
    A  Daily torpor
    B  Hibernation
    C  Migration
    D  Aestivation
14. In which of the following domains of life are microorganisms found?
    A  Bacteria only
    B  Archaea only
    C  Bacteria and archaea only
    D  Bacteria, archaea and eukaryotes
PDF page 9
Paper 1, Question 15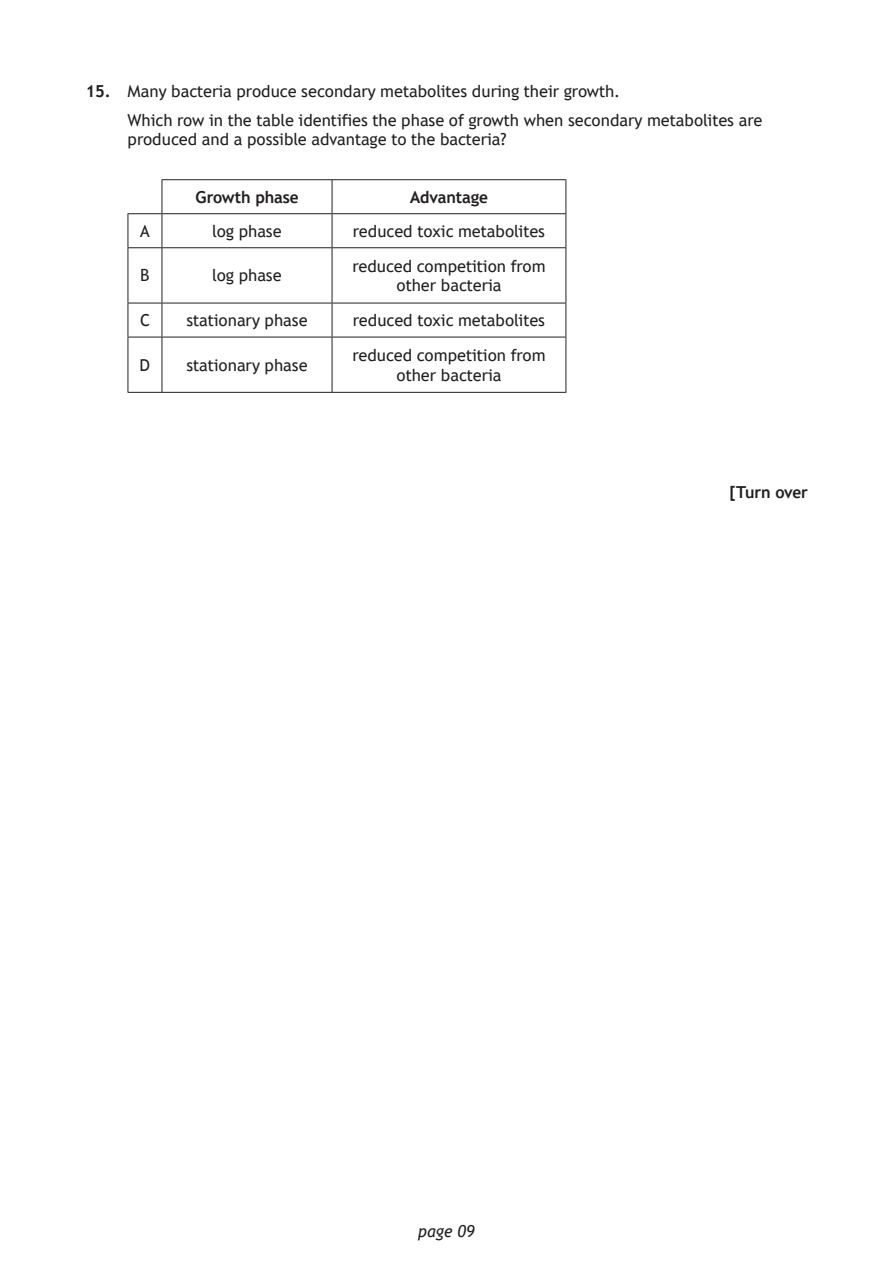
Selectable page text
15. Many bacteria produce secondary metabolites during their growth.

    Which row in the table identifies the phase of growth when secondary metabolites are
    produced and a possible advantage to the bacteria?

          Growth phase        Advantage

     A      log phase   reduced toxic metabolites
                        reduced competition from
     B      log phase
                            other bacteria
     C   stationary phase reduced toxic metabolites

                        reduced competition from
     D   stationary phase
                            other bacteria

                                                           [Turn over

                              page 09
PDF page 10
Paper 1, Question 16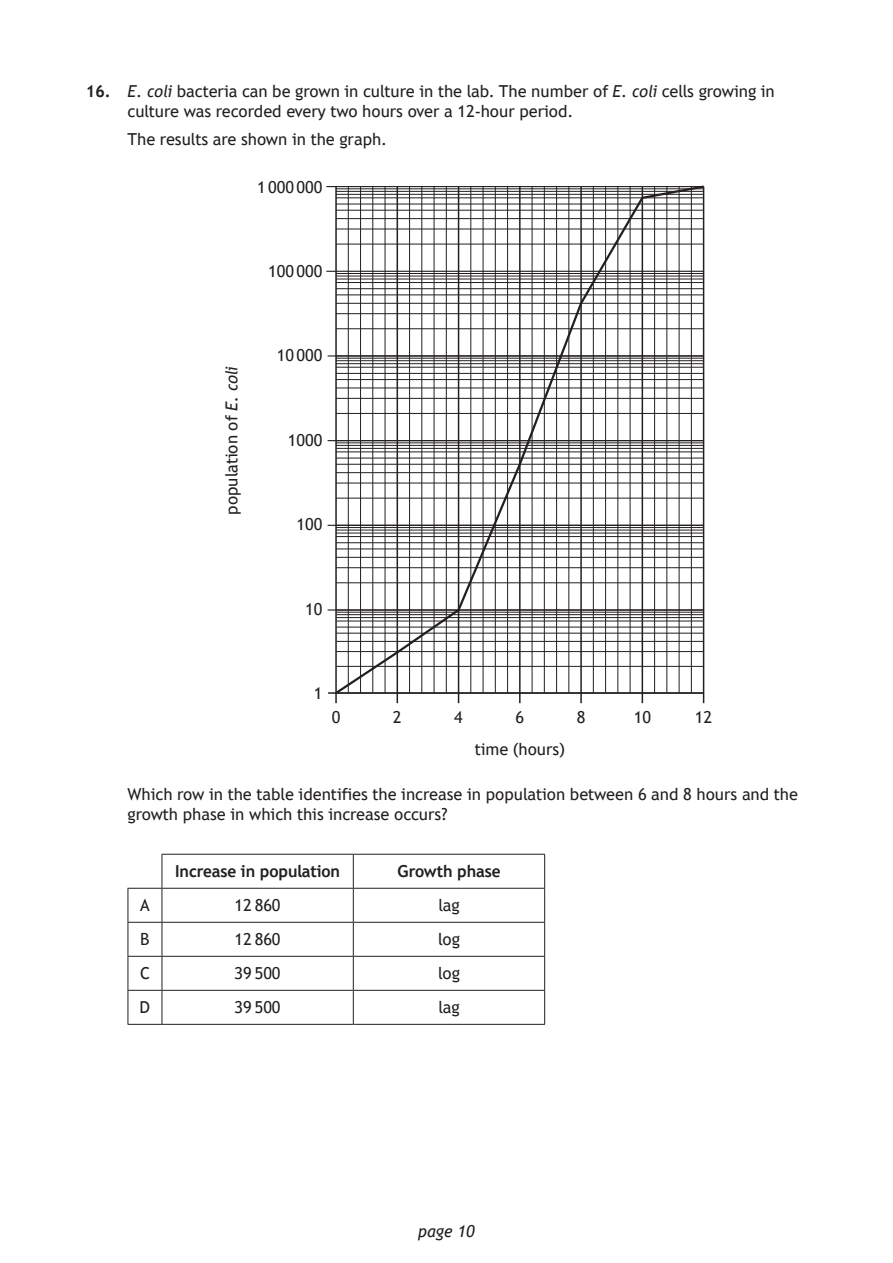
Selectable page text
16. E. coli bacteria can be grown in culture in the lab. The number of E. coli cells growing in
    culture was recorded every two hours over a 12‑hour period.

    The results are shown in the graph.

                1 000 000

                 100 000

                 10 000

                  1000

                   100

                    10

                     1

                              page 10
             iloc
             .E
             fo
             noitalupop
                      0     2     4    6     8    10    12
                                    time (hours)
    Which row in the table identifies the increase in population between 6 and 8 hours and the
    growth phase in which this increase occurs?
        Increase in population Growth phase
     A        12 860            lag
     B        12 860            log
     C        39 500            log
     D        39 500            lag
PDF page 11
Paper 1, Question 17Paper 1, Question 18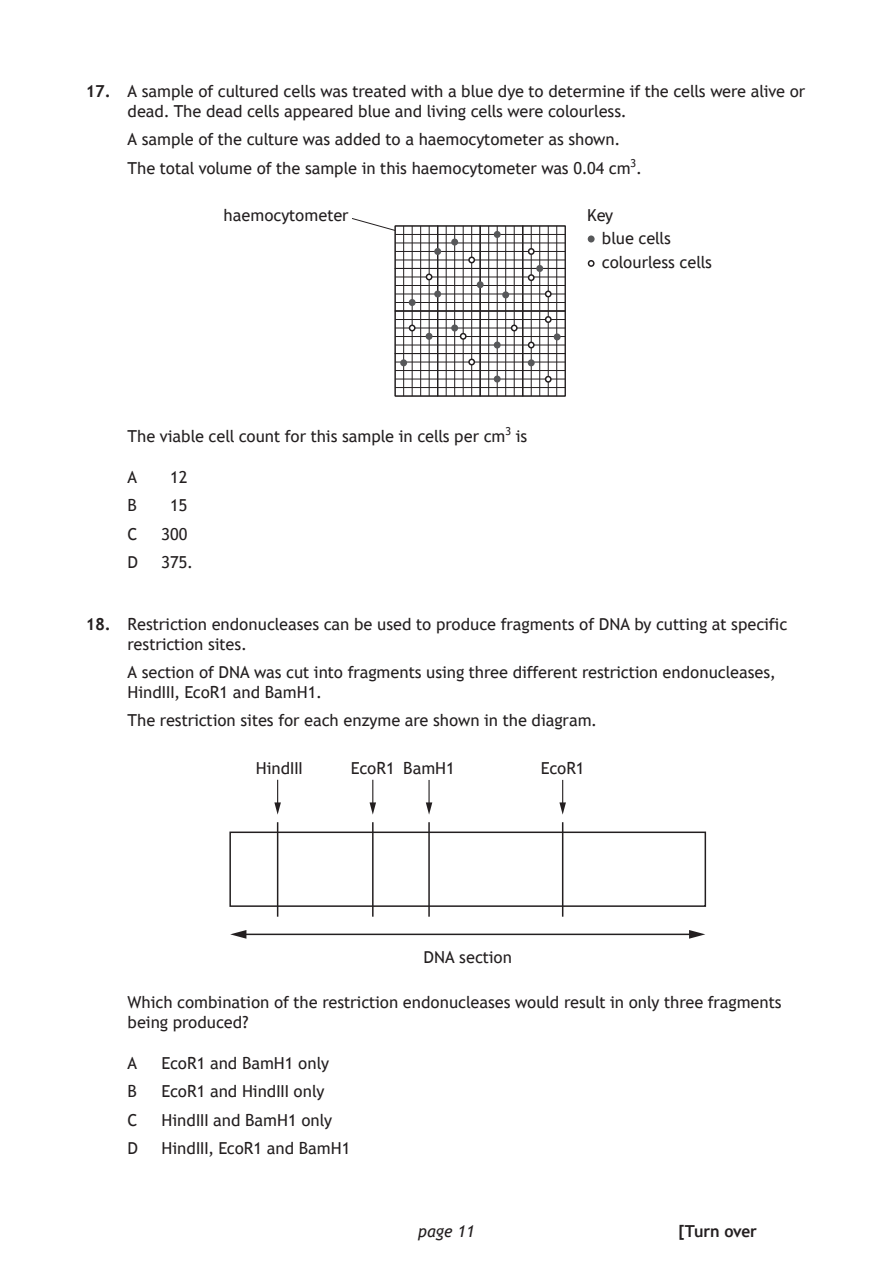
Selectable page text
17. A sample of cultured cells was treated with a blue dye to determine if the cells were alive or
    dead. The dead cells appeared blue and living cells were colourless.

    A sample of the culture was added to a haemocytometer as shown.
    The total volume of the sample in this haemocytometer was 0.04 cm³.

             haemocytometer                   Key
                                               blue cells
                                               colourless cells

    The viable cell count for this sample in cells per cm³ is

    A   12

    B   15
    C  300
    D  375.

18. Restriction endonucleases can be used to produce fragments of DNA by cutting at specific
    restriction sites.
    A section of DNA was cut into fragments using three different restriction endonucleases,
    HindIII, EcoR1 and BamH1.

    The restriction sites for each enzyme are shown in the diagram.

                HindIII EcoR1 BamH1       EcoR1

                               DNA section

    Which combination of the restriction endonucleases would result in only three fragments
    being produced?

    A  EcoR1 and BamH1 only

    B  EcoR1 and HindIII only
    C  HindIII and BamH1 only

    D  HindIII, EcoR1 and BamH1

                              page 11                 [Turn over
PDF page 12
Paper 1, Question 19Paper 1, Question 20Paper 1, Question 21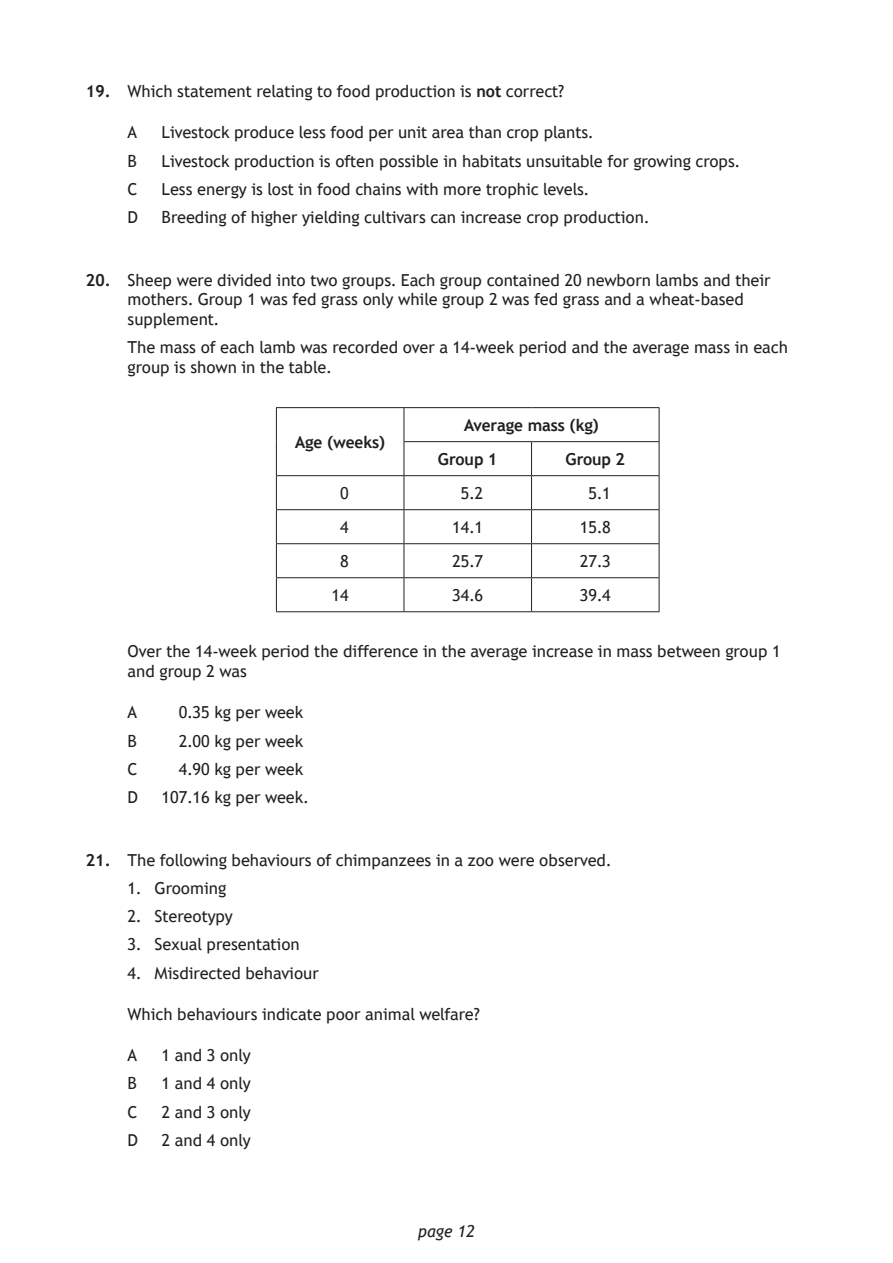
Selectable page text
19. Which statement relating to food production is not correct?

    A  Livestock produce less food per unit area than crop plants.

    B  Livestock production is often possible in habitats unsuitable for growing crops.
    C  Less energy is lost in food chains with more trophic levels.

    D  Breeding of higher yielding cultivars can increase crop production.

20. Sheep were divided into two groups. Each group contained 20 newborn lambs and their
    mothers. Group 1 was fed grass only while group 2 was fed grass and a wheat‑based
    supplement.
    The mass of each lamb was recorded over a 14‑week period and the average mass in each

    group is shown in the table.

                                   Average mass (kg)
                   Age (weeks)
                                Group 1     Group 2

                       0          5.2         5.1

                       4          14.1       15.8
                       8          25.7       27.3

                      14          34.6       39.4

    Over the 14‑week period the difference in the average increase in mass between group 1
    and group 2 was

    A   0.35 kg per week

    B   2.00 kg per week
    C   4.90 kg per week

    D  107.16 kg per week.

21. The following behaviours of chimpanzees in a zoo were observed.
    1. Grooming

    2. Stereotypy
    3. Sexual presentation

    4. Misdirected behaviour

    Which behaviours indicate poor animal welfare?

    A  1 and 3 only
    B  1 and 4 only

    C  2 and 3 only
    D  2 and 4 only

                              page 12
PDF page 13
Paper 1, Question 22Paper 1, Question 23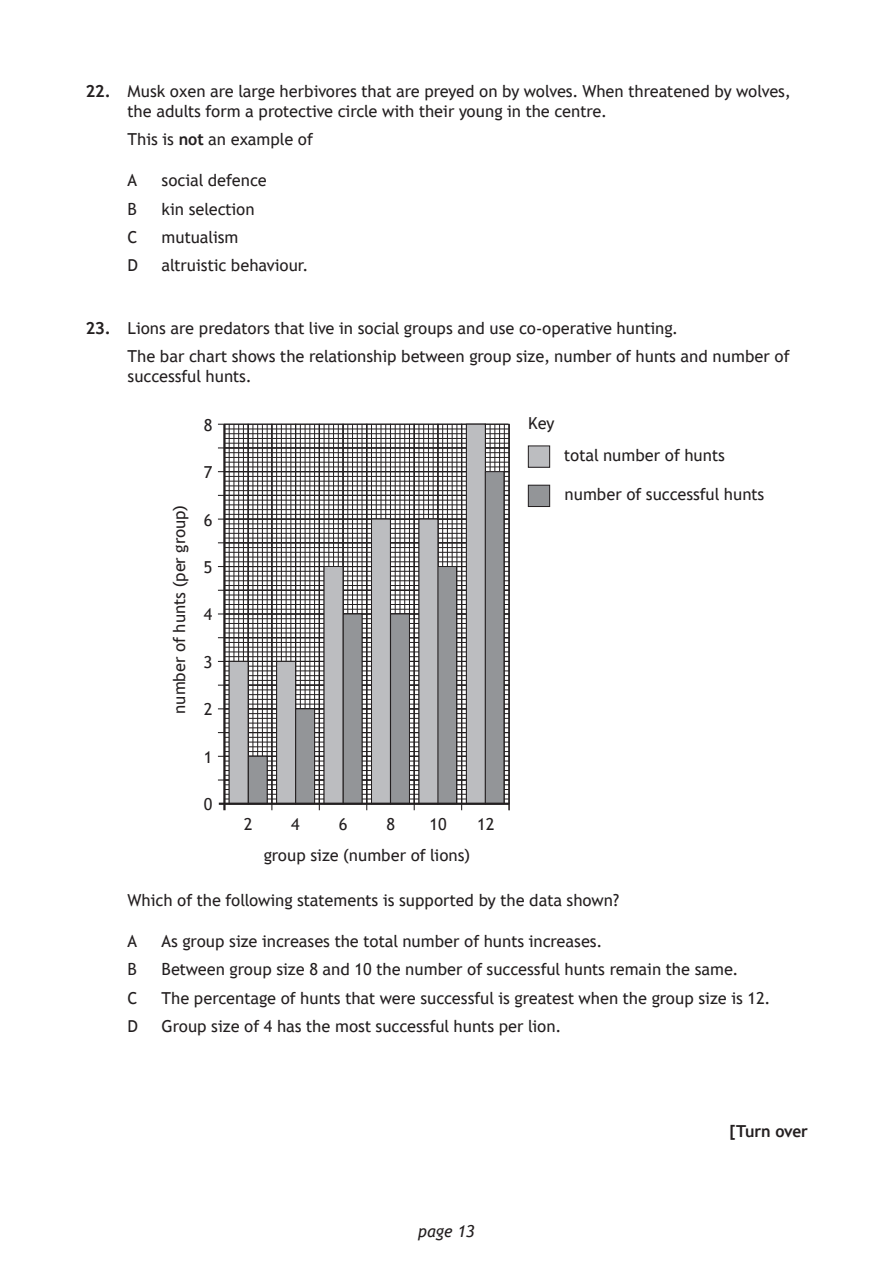
Selectable page text
22. Musk oxen are large herbivores that are preyed on by wolves. When threatened by wolves,
    the adults form a protective circle with their young in the centre.

    This is not an example of

    A  social defence
    B  kin selection

    C  mutualism
    D  altruistic behaviour.

23. Lions are predators that live in social groups and use co‑operative hunting.

    The bar chart shows the relationship between group size, number of hunts and number of
    successful hunts.

                group size (number of lions)

                              page 13
        )puorg
        rep(
        stnuh
        fo
        rebmun
           8                             Key
                                            total number of hunts
           7
                                            number of successful hunts
           6
           5
           4
           3
           2
           1
           0
              2    4   6    8   10  12
    Which of the following statements is supported by the data shown?
    A  As group size increases the total number of hunts increases.
    B  Between group size 8 and 10 the number of successful hunts remain the same.
    C  The percentage of hunts that were successful is greatest when the group size is 12.
    D  Group size of 4 has the most successful hunts per lion.
                                                           [Turn over
PDF page 14
Paper 1, Question 24Paper 1, Question 25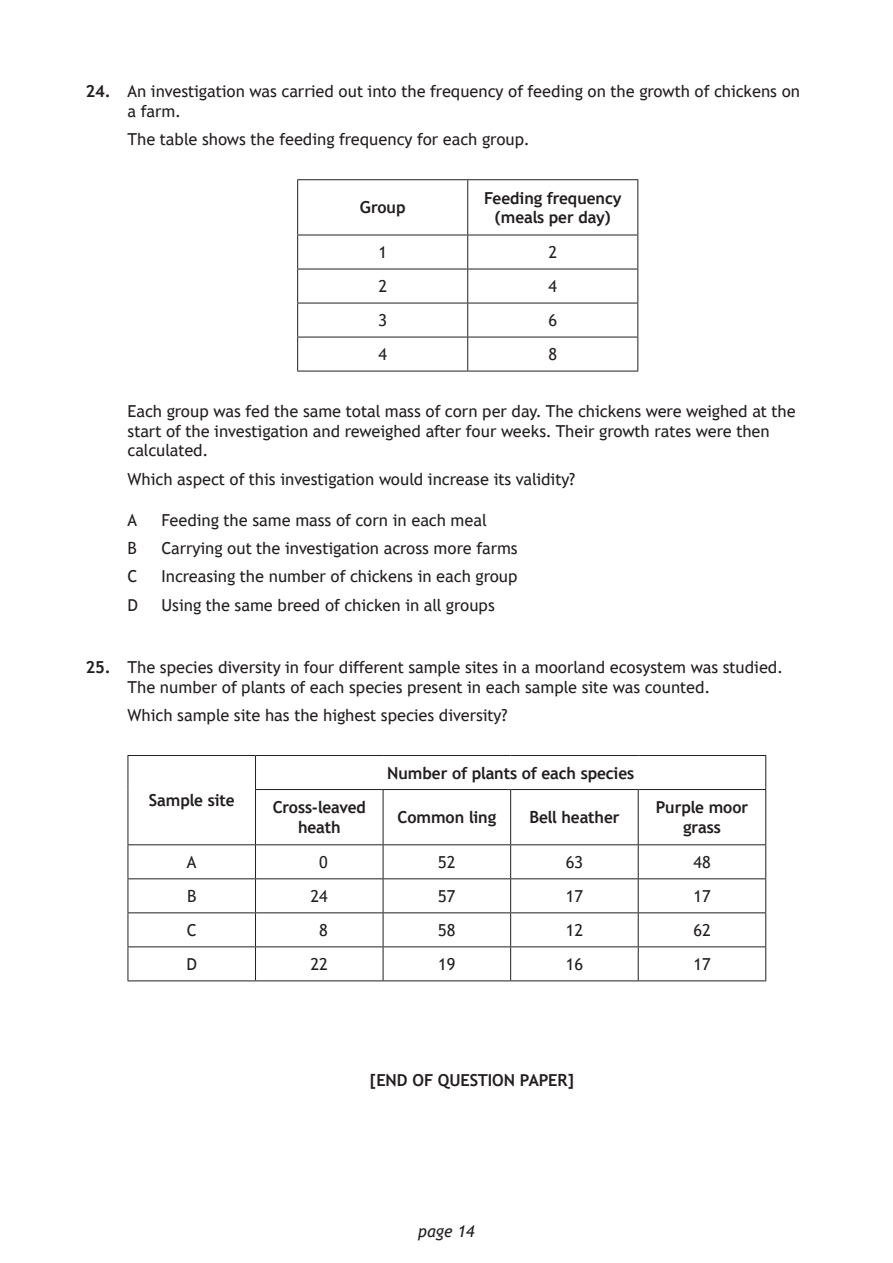
Selectable page text
24. An investigation was carried out into the frequency of feeding on the growth of chickens on
    a farm.

    The table shows the feeding frequency for each group.

                                     Feeding frequency
                         Group
                                     (meals per day)
                           1              2
                           2              4

                           3              6

                           4              8

    Each group was fed the same total mass of corn per day. The chickens were weighed at the
    start of the investigation and reweighed after four weeks. Their growth rates were then
    calculated.
    Which aspect of this investigation would increase its validity?

    A  Feeding the same mass of corn in each meal

    B  Carrying out the investigation across more farms
    C  Increasing the number of chickens in each group

    D  Using the same breed of chicken in all groups

25. The species diversity in four different sample sites in a moorland ecosystem was studied.
    The number of plants of each species present in each sample site was counted.
    Which sample site has the highest species diversity?

                            Number of plants of each species

      Sample site
                 Cross‑leaved                       Purple moor
                             Common ling Bell heather
                   heath                               grass
         A           0          52          63          48
         B           24         57          17          17
         C           8          58          12          62

         D           22         19          16          17

                          [END OF QUESTION PAPER]

                              page 14
PDF page 15

Selectable page text
SPACE FOR ROUGH WORK

      page 15
PDF page 16

Selectable page text
SPACE FOR ROUGH WORK

      page 16