2022 Higher Biology - Paper 1 questions
Source: Scottish Qualifications Authority (SQA) / Qualifications Scotland. This is a StemInteract HTML companion, not an official HTML edition. Selectable text is supplied alongside original page images. Use the images or original PDF for equations, powers, fractions, vector notation, tables and diagrams; text extraction cannot fully preserve mathematical layout.
Jump to a question
PDF page 1
Selectable page text
H
National
Qualications
2022
X807/76/12 Biology
Paper 1 — Multiple choice
THURSDAY, 19 MAY
9:00 AM – 9:40 AM
Total marks — 25
Attempt ALL questions.
You may use a calculator.
Instructions for the completion of Paper 1 are given on page 02 of your answer booklet
X807/76/02.
Record your answers on the answer grid on page 03 of your answer booklet.
Space for rough work is provided at the end of this booklet.
Before leaving the examination room you must give your answer booklet to the Invigilator; if you
do not, you may lose all the marks for this paper.
©
*X8077612*
A/SAPDF page 2
Paper 1, Question 1Paper 1, Question 2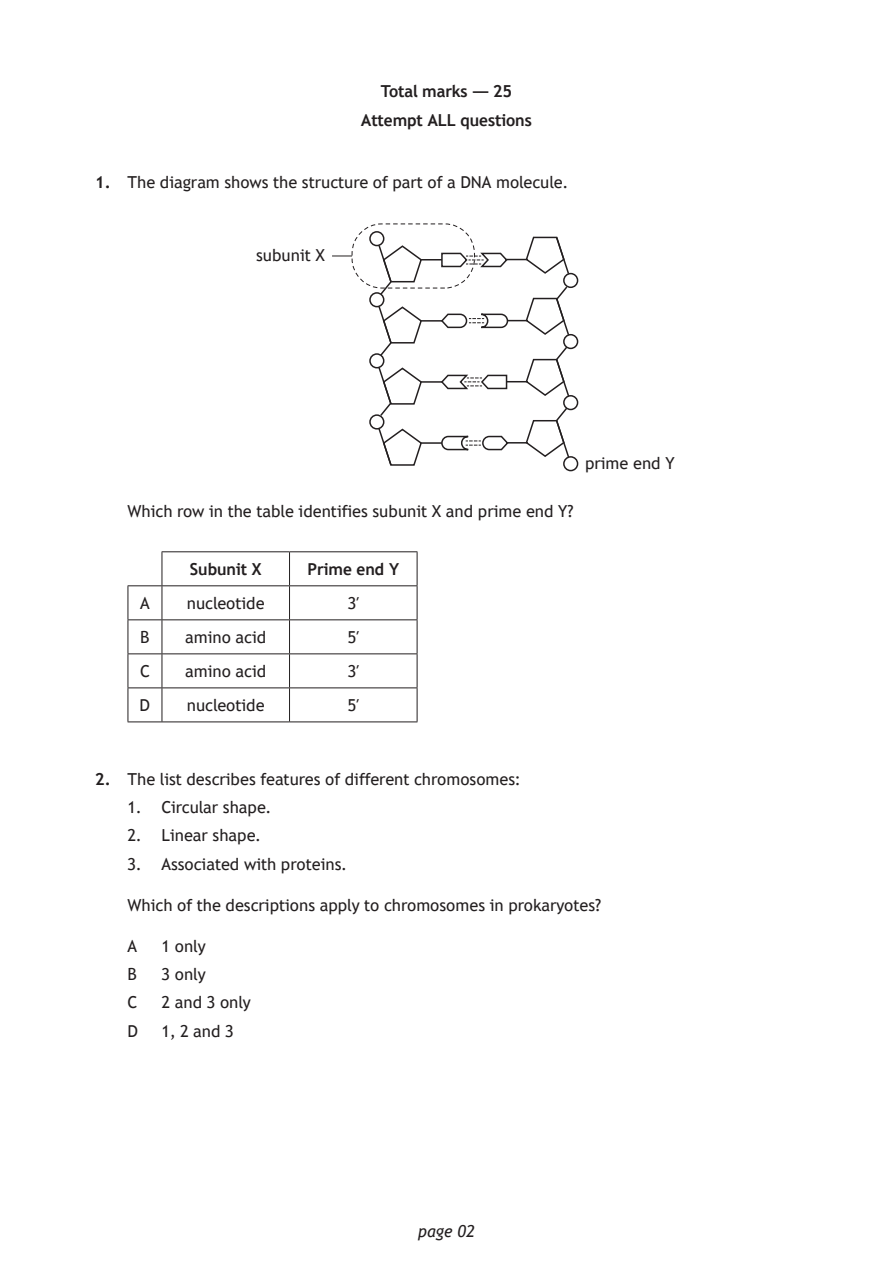
Selectable page text
Total marks — 25

                        Attempt ALL questions

1. The diagram shows the structure of part of a DNA molecule.

               subunit X

                                             prime end Y

   Which row in the table identifies subunit X and prime end Y?

        Subunit X  Prime end Y

    A   nucleotide     3′
    B   amino acid     5′

    C   amino acid     3′

    D   nucleotide     5′

2. The list describes features of different chromosomes:
   1. Circular shape.
   2. Linear shape.

   3. Associated with proteins.

   Which of the descriptions apply to chromosomes in prokaryotes?

   A  1 only

   B  3 only
   C  2 and 3 only

   D  1, 2 and 3

                             page 02
PDF page 3
Paper 1, Question 3Paper 1, Question 4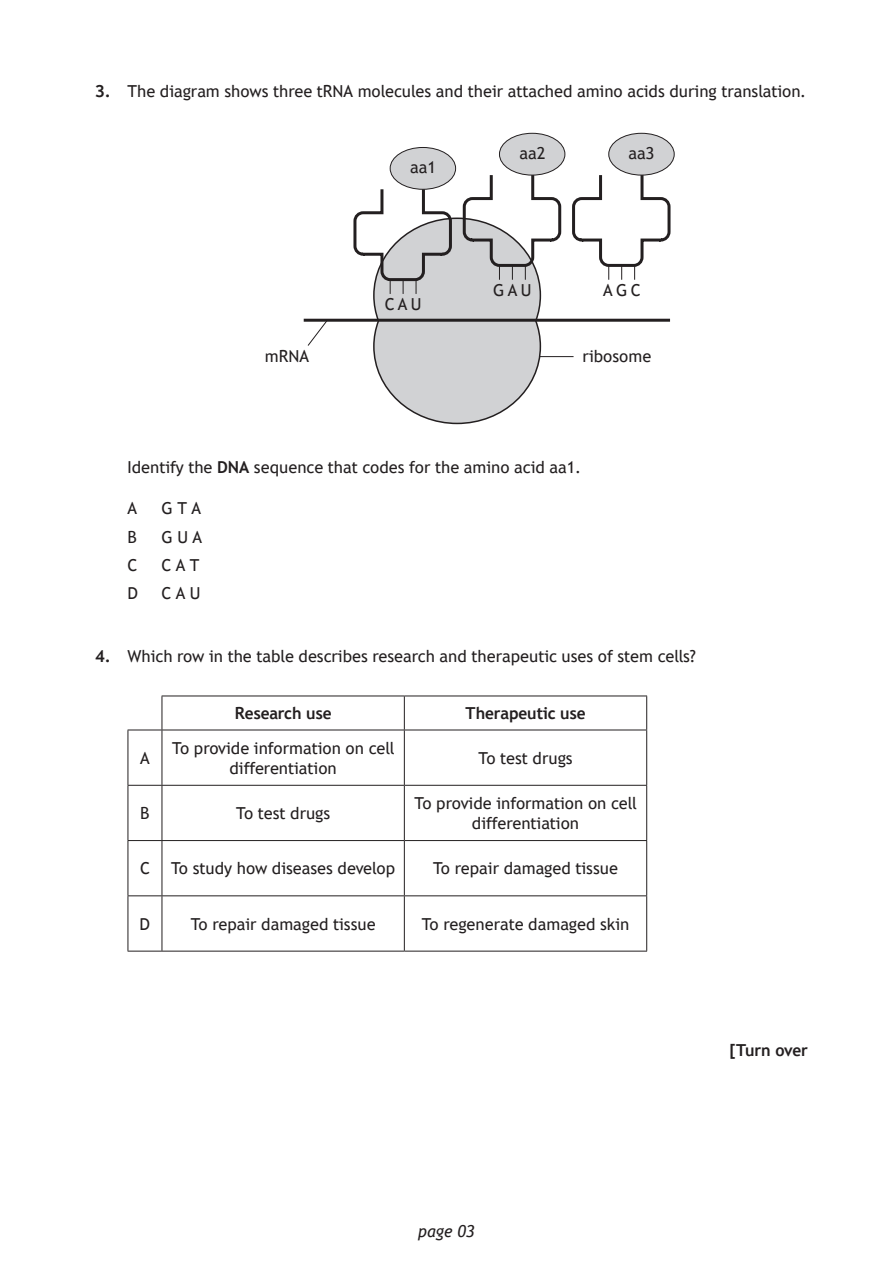
Selectable page text
3. The diagram shows three tRNA molecules and their attached amino acids during translation.

                                       aa2       aa3
                             aa1

                                    GAU       AGC
                          CAU

               mRNA                          ribosome

   Identify the DNA sequence that codes for the amino acid aa1.

   A  G T A
   B  G U A

   C  C A T
   D  C A U

4. Which row in the table describes research and therapeutic uses of stem cells?

             Research use         Therapeutic use

       To provide information on cell
    A                              To test drugs
            differentiation
                             To provide information on cell
    B        To test drugs
                                  differentiation
    C  To study how diseases develop To repair damaged tissue

    D    To repair damaged tissue To regenerate damaged skin

                                                          [Turn over

                             page 03
PDF page 4
Paper 1, Question 5Paper 1, Question 6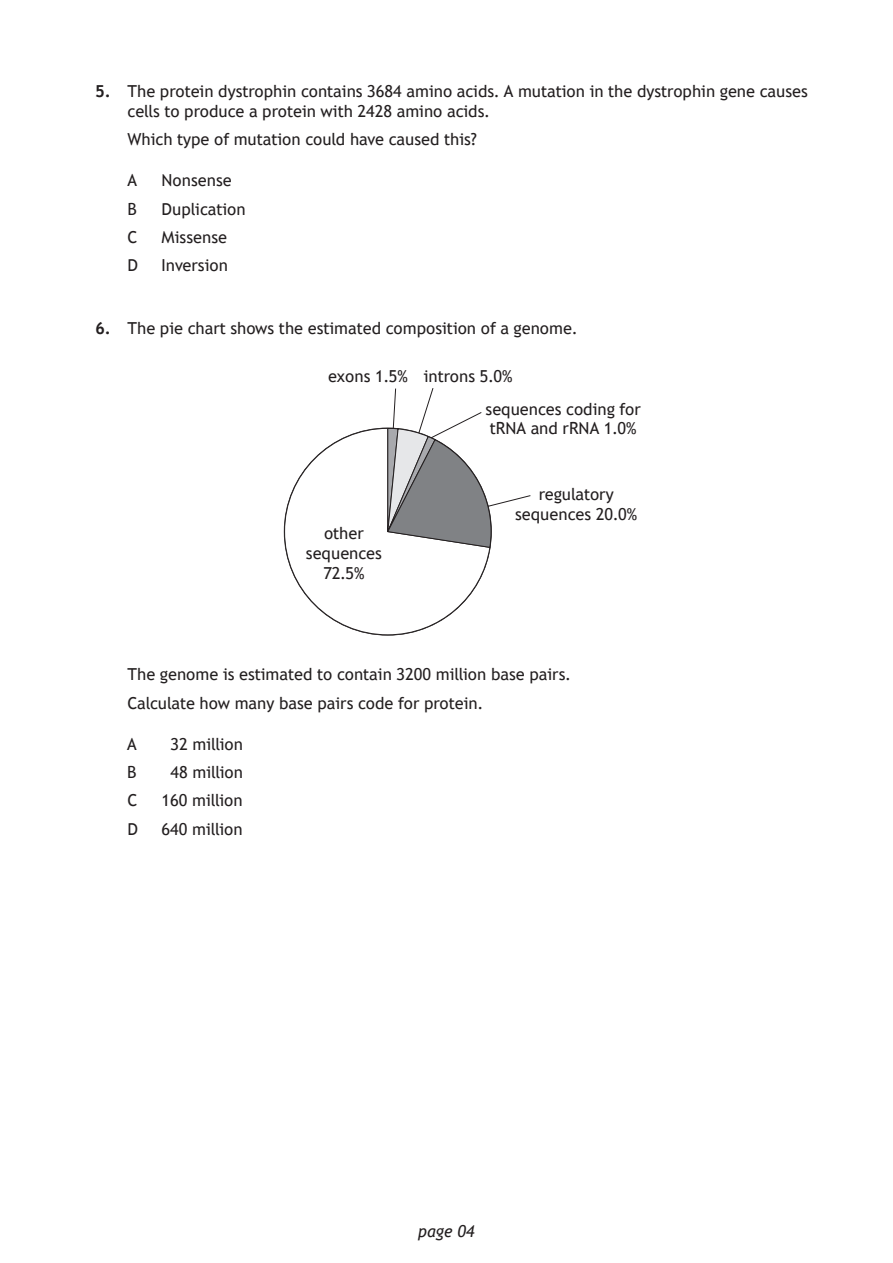
Selectable page text
5. The protein dystrophin contains 3684 amino acids. A mutation in the dystrophin gene causes
   cells to produce a protein with 2428 amino acids.

   Which type of mutation could have caused this?

   A  Nonsense
   B  Duplication

   C  Missense
   D  Inversion

6. The pie chart shows the estimated composition of a genome.

                     exons 1.5% introns 5.0%

                                    sequences coding for
                                    tRNA and rRNA 1.0%

                                         regulatory
                                      sequences 20.0%
                     other
                   sequences
                     72.5%

   The genome is estimated to contain 3200 million base pairs.

   Calculate how many base pairs code for protein.

   A   32 million
   B   48 million

   C  160 million
   D  640 million

                             page 04
PDF page 5
Paper 1, Question 7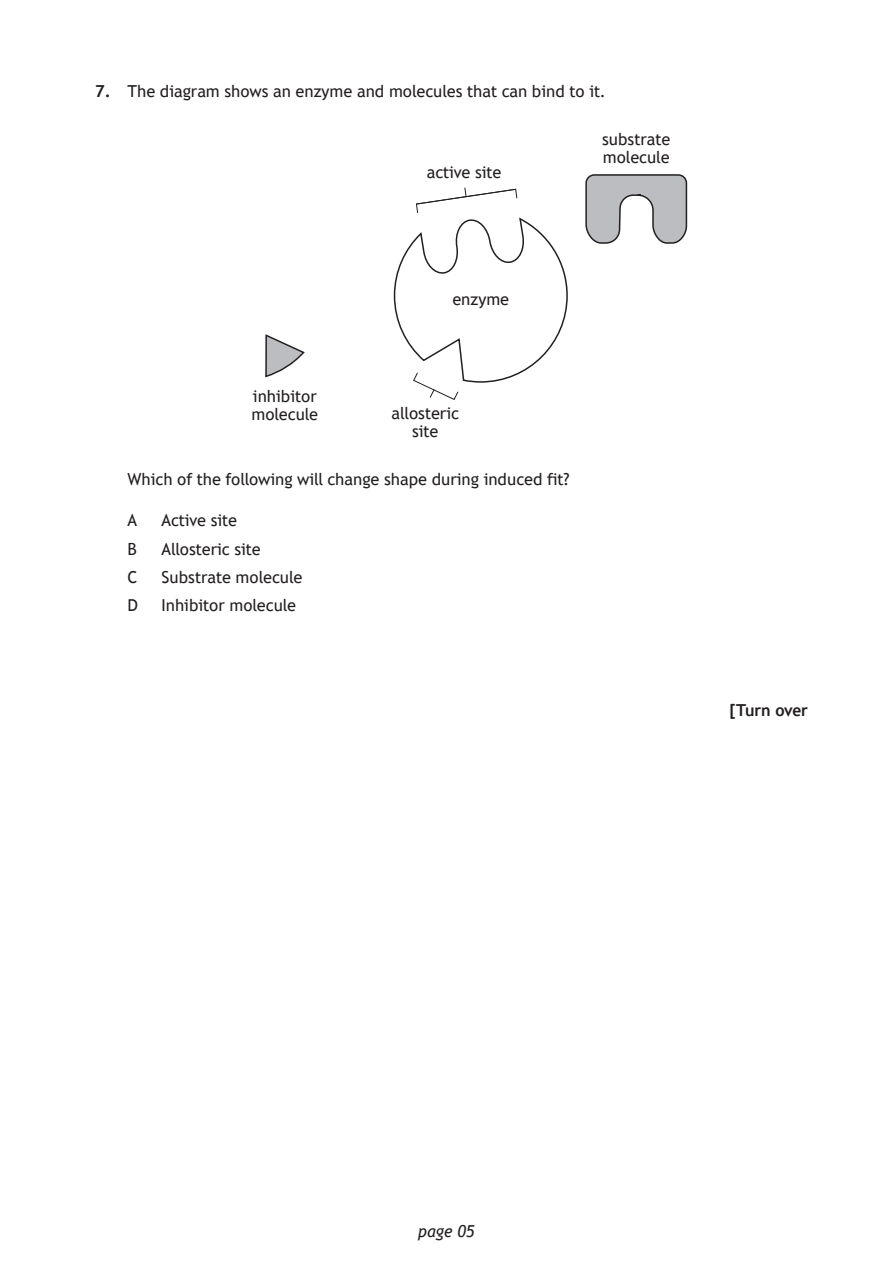
Selectable page text
7. The diagram shows an enzyme and molecules that can bind to it.

                                              substrate
                                              molecule
                              active site

                                 enzyme

              inhibitor
              molecule     allosteric
                             site

   Which of the following will change shape during induced fit?

   A  Active site

   B  Allosteric site
   C  Substrate molecule

   D  Inhibitor molecule

                                                          [Turn over

                             page 05
PDF page 6
Paper 1, Question 8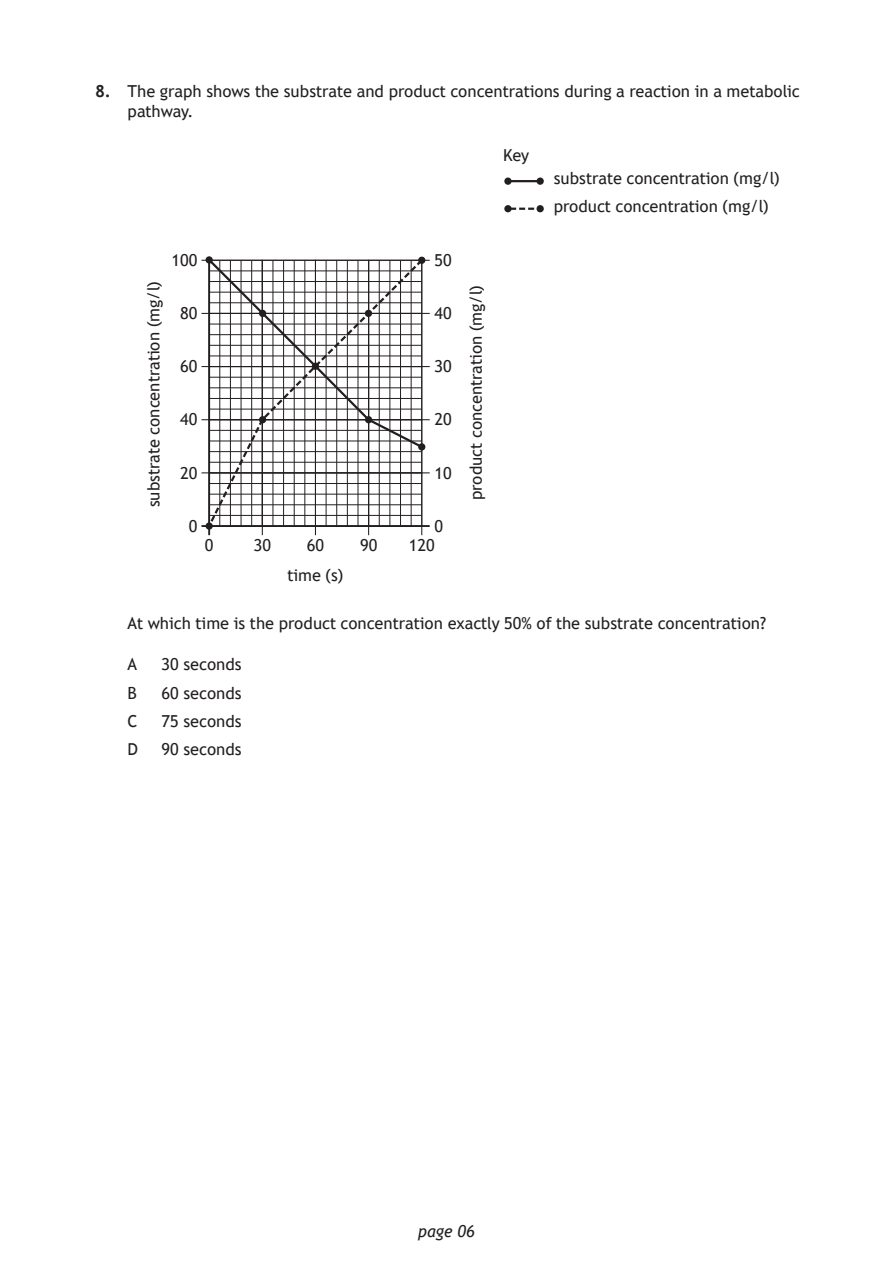
Selectable page text
8. The graph shows the substrate and product concentrations during a reaction in a metabolic
   pathway.

                               50

                               40

                               30

                               20

                               10

                               0
          0   30   60   90   120
                 time (s)

                             page 06
     )l/gm(
     noitartnecnoc
     etartsbus
                                  )l/gm(
                                  noitartnecnoc
                                  tcudorp
                                     Key
                                          substrate concentration (mg/l)
                                          product concentration (mg/l)
       100
        80
        60
        40
        20
        0
   At which time is the product concentration exactly 50% of the substrate concentration?
   A  30 seconds
   B  60 seconds
   C  75 seconds
   D  90 seconds
PDF page 7
Paper 1, Question 9Paper 1, Question 10Paper 1, Question 11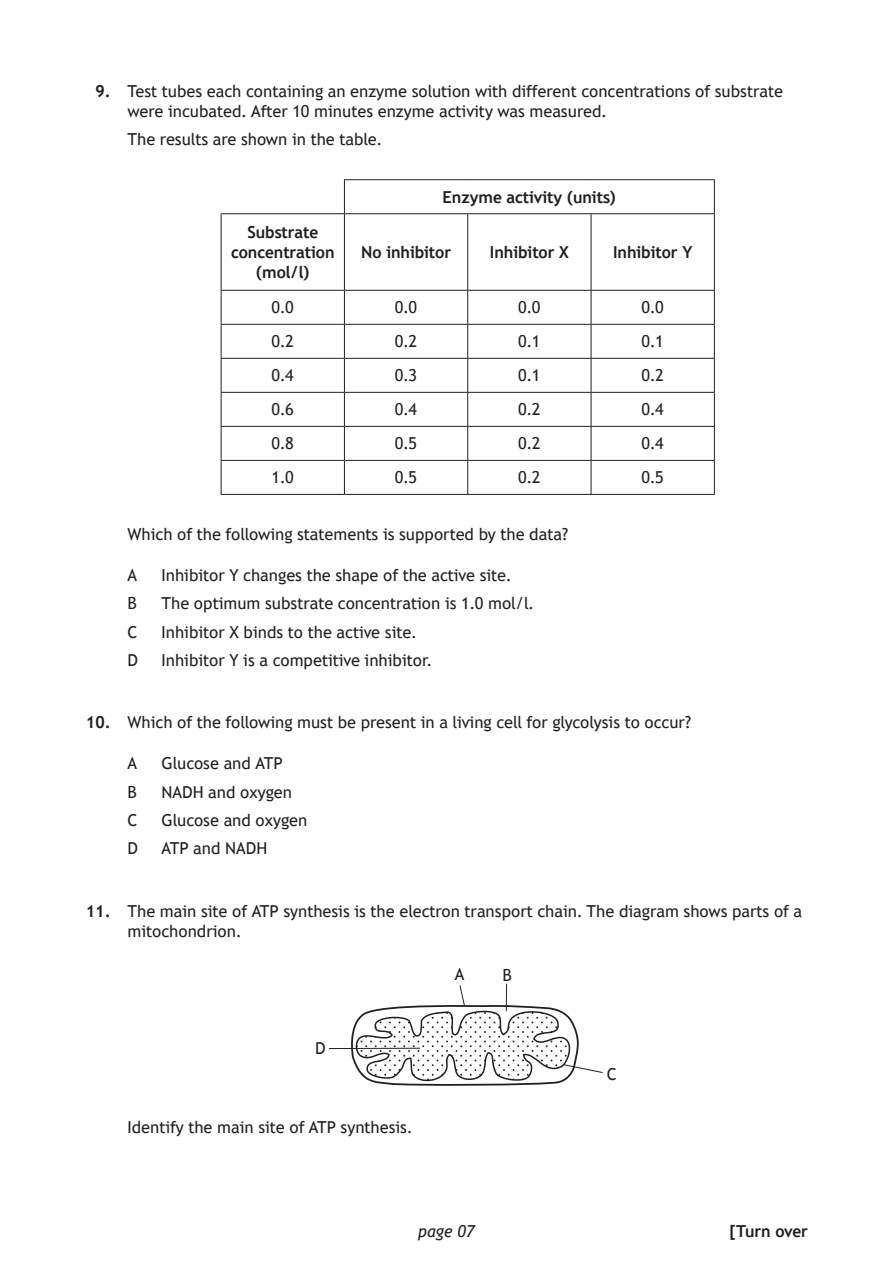
Selectable page text
9. Test tubes each containing an enzyme solution with different concentrations of substrate
    were incubated. After 10 minutes enzyme activity was measured.

    The results are shown in the table.

                                 Enzyme activity (units)

               Substrate
             concentration No inhibitor Inhibitor X Inhibitor Y
                (mol/l)
                 0.0        0.0         0.0        0.0

                 0.2        0.2         0.1        0.1

                 0.4        0.3         0.1        0.2

                 0.6        0.4         0.2        0.4
                 0.8        0.5         0.2        0.4

                 1.0        0.5         0.2        0.5

    Which of the following statements is supported by the data?

    A  Inhibitor Y changes the shape of the active site.

    B  The optimum substrate concentration is 1.0 mol/l.
    C  Inhibitor X binds to the active site.

    D  Inhibitor Y is a competitive inhibitor.

10. Which of the following must be present in a living cell for glycolysis to occur?

    A  Glucose and ATP
    B  NADH and oxygen

    C  Glucose and oxygen
    D  ATP and NADH

11. The main site of ATP synthesis is the electron transport chain. The diagram shows parts of a
    mitochondrion.

                                  A   B

                     D

                                                C

    Identify the main site of ATP synthesis.

                              page 07                      [Turn over
PDF page 8
Paper 1, Question 12Paper 1, Question 13Paper 1, Question 14
Selectable page text
12. An experiment was carried out to investigate the effect of different respiratory substrates
    on the rate of respiration in yeast (Saccharomyces cerevisiae).

    Resazurin dye was added to five test tubes containing this species of yeast, each with a
    different respiratory substrate. As yeast cells carry out respiration the dye changes colour.
    This colour change was measured using a colorimeter.

    Which feature of the experimental design allowed a valid conclusion to be drawn?

    A  The same species of yeast was used.
    B  Five different respiratory substrates were used.

    C  Respiration rate was measured using a colorimeter.
    D  Resazurin dye was used.

13. Which of the following statements about micro-organisms is correct?

    A  All micro-organisms require amino acids in their growth medium.

    B  Micro-organisms use a variety of metabolic substrates.
    C  Micro-organisms include bacteria and archaea only.

    D  Light can be used as an energy source by all micro-organisms grown in culture.

14. An experiment was carried out to determine how different types of sugar solution affect the
    growth rate of the bacteria Escherichia coli (E. coli).

    Three flasks were set up each containing 25 cm³ of either glucose, lactose, or fructose and
    10 cm³ of E. coli suspension. The flasks were incubated at 30 °C and viable cell counts were
    recorded every 20 minutes.
    Identify the independent variable in this experiment.

    A  Time

    B  Growth rate of E. coli
    C  Type of sugar solution
    D  Viable cell count

                              page 08
PDF page 9
Paper 1, Question 15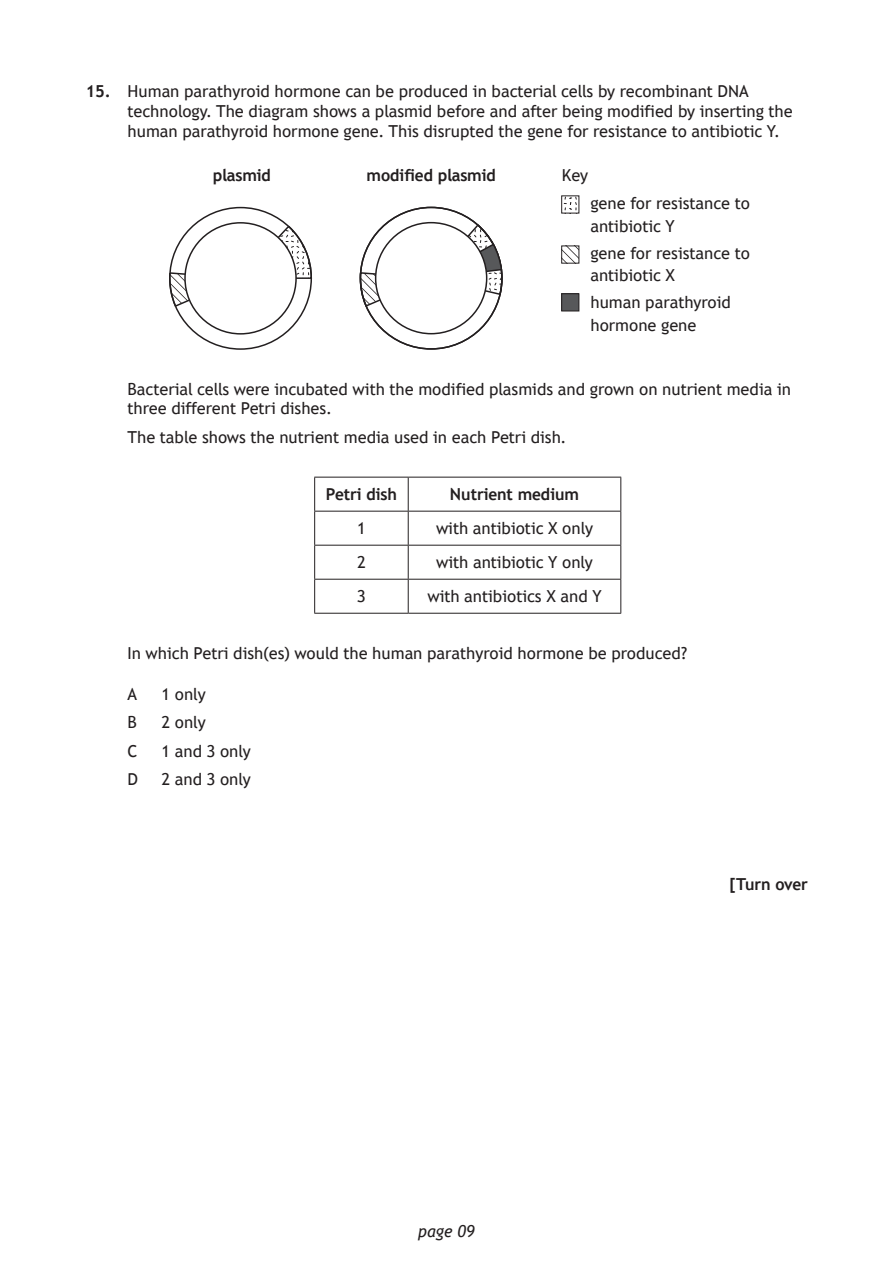
Selectable page text
15. Human parathyroid hormone can be produced in bacterial cells by recombinant DNA
    technology. The diagram shows a plasmid before and after being modified by inserting the
    human parathyroid hormone gene. This disrupted the gene for resistance to antibiotic Y.

            plasmid       modified plasmid  Key
                                              gene for resistance to
                                              antibiotic Y

                                              gene for resistance to
                                              antibiotic X
                                              human parathyroid
                                              hormone gene

    Bacterial cells were incubated with the modified plasmids and grown on nutrient media in
    three different Petri dishes.
    The table shows the nutrient media used in each Petri dish.

                      Petri dish Nutrient medium

                         1      with antibiotic X only

                         2      with antibiotic Y only
                         3     with antibiotics X and Y

    In which Petri dish(es) would the human parathyroid hormone be produced?

    A  1 only

    B  2 only
    C  1 and 3 only

    D  2 and 3 only

                                                           [Turn over

                              page 09
PDF page 10
Paper 1, Question 16Paper 1, Question 17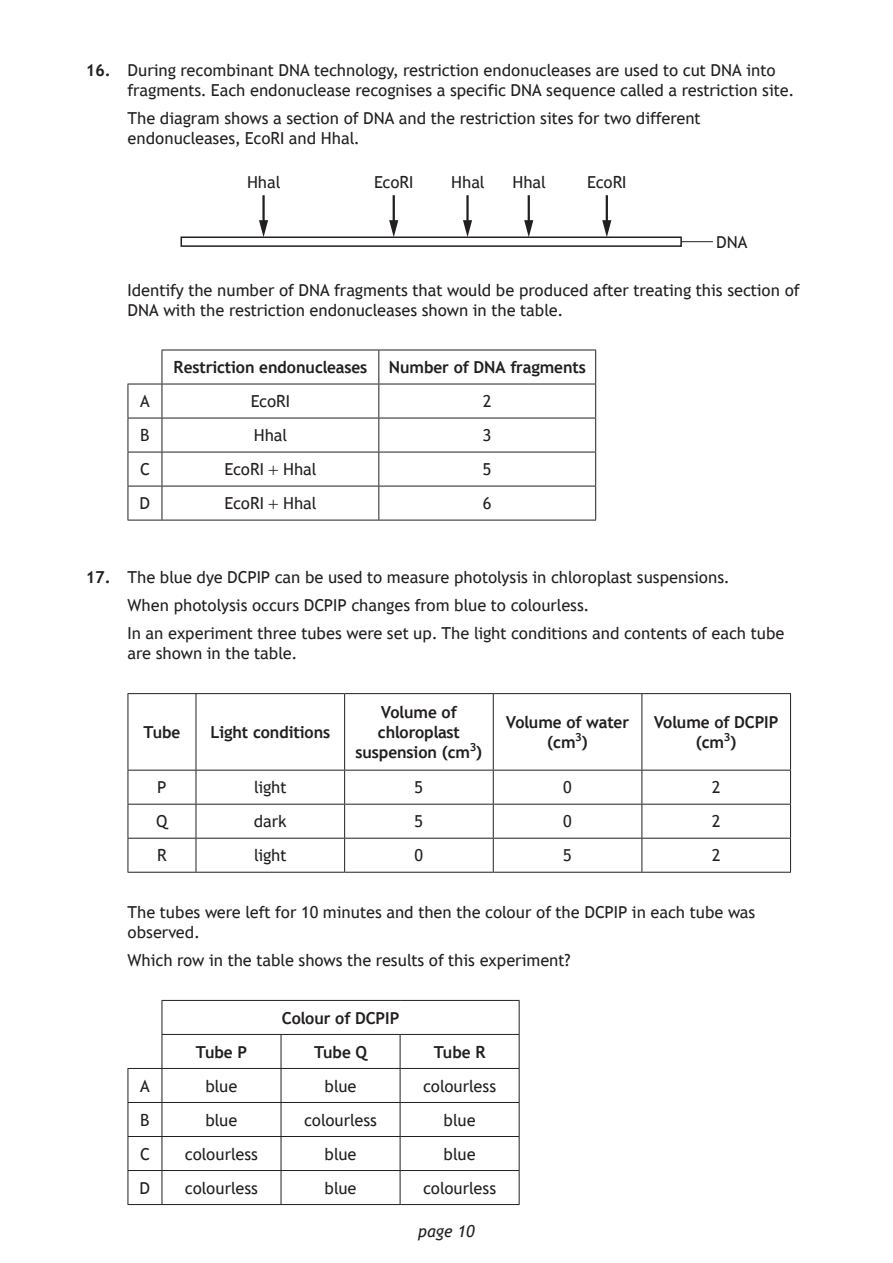
Selectable page text
16. During recombinant DNA technology, restriction endonucleases are used to cut DNA into
    fragments. Each endonuclease recognises a specific DNA sequence called a restriction site.

    The diagram shows a section of DNA and the restriction sites for two different
    endonucleases, EcoRI and Hhal.

               Hhal       EcoRI  Hhal  Hhal   EcoRI

                                                          DNA

    Identify the number of DNA fragments that would be produced after treating this section of
    DNA with the restriction endonucleases shown in the table.

        Restriction endonucleases Number of DNA fragments

     A         EcoRI                2

     B         Hhal                 3

     C       EcoRI + Hhal           5
     D       EcoRI + Hhal           6

17. The blue dye DCPIP can be used to measure photolysis in chloroplast suspensions.

    When photolysis occurs DCPIP changes from blue to colourless.
    In an experiment three tubes were set up. The light conditions and contents of each tube
    are shown in the table.

                           Volume of
                                       Volume of water Volume of DCPIP
     Tube  Light conditions chloroplast
                                          (cm³)         (cm³)
                         suspension (cm³)
      P        light          5             0            2
      Q        dark           5             0            2

      R        light          0             5            2

    The tubes were left for 10 minutes and then the colour of the DCPIP in each tube was
    observed.

    Which row in the table shows the results of this experiment?

                  Colour of DCPIP

          Tube P     Tube Q     Tube R
     A     blue       blue     colourless

     B     blue     colourless   blue

     C   colourless   blue       blue

     D   colourless   blue     colourless

                              page 10
PDF page 11
Paper 1, Question 18Paper 1, Question 19
Selectable page text
18. The following statements describe events occurring during photosynthesis:

    1. Carbon dioxide combines with RuBP.
    2. ATP synthase generates ATP from ADP and Pi.

    3. Hydrogen binds with the coenzyme NADP.
    4. 3PG is phosphorylated by ATP.

    Which of the statements identify events that occur in carbon fixation (Calvin cycle)?

    A  1 and 2 only

    B  1 and 4 only
    C  2 and 3 only

    D  3 and 4 only

19. Which of the following statements about carotenoids in green plants is correct?

    A  They increase absorption of green light by chlorophyll.
    B  They increase absorption of blue and red light by chlorophyll.

    C  They extend the range of wavelengths of light absorbed and pass hydrogen onto
       chlorophyll.
    D  They extend the range of wavelengths of light absorbed and pass energy onto
       chlorophyll.

                                                           [Turn over

                              page 11
PDF page 12
Paper 1, Question 20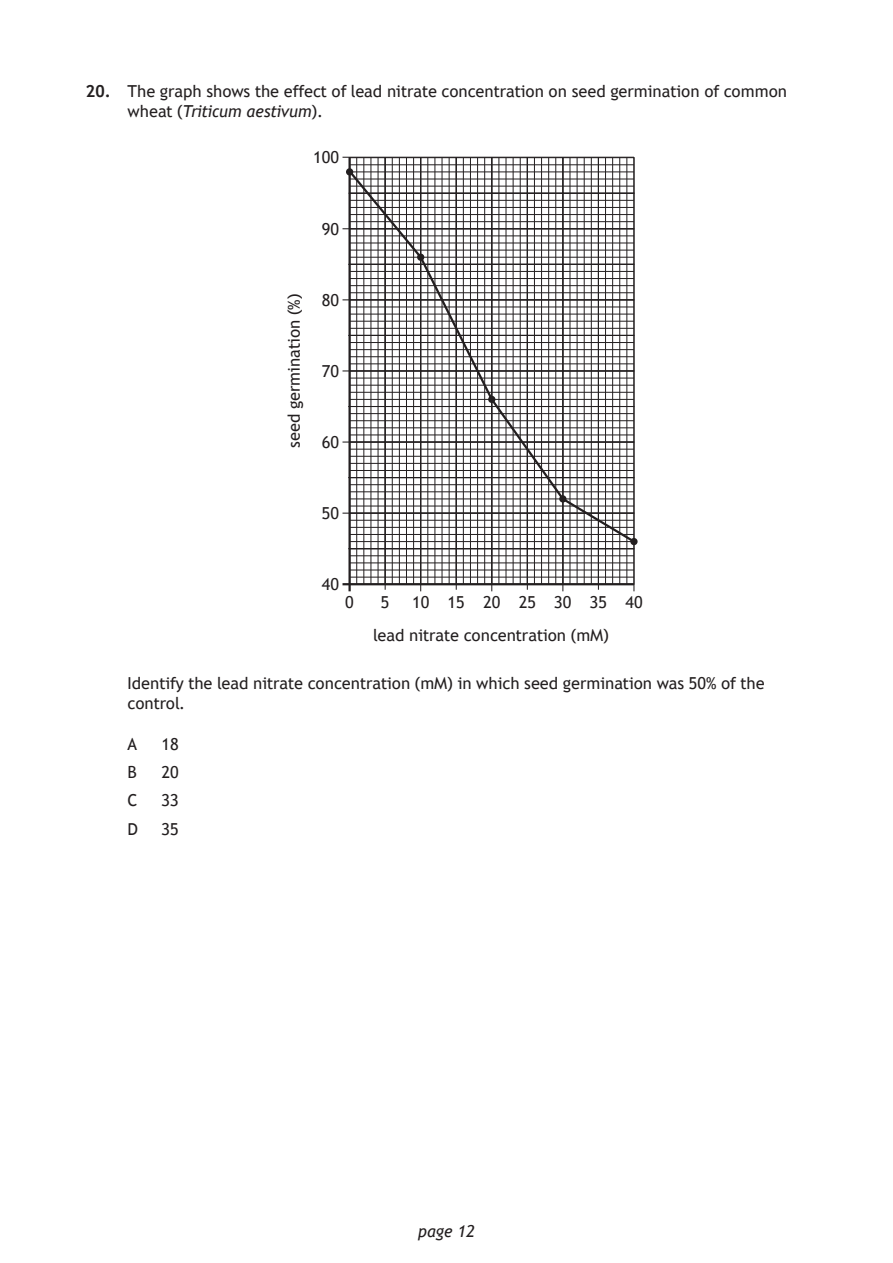
Selectable page text
20. The graph shows the effect of lead nitrate concentration on seed germination of common
    wheat (Triticum aestivum).

                        0  5  10 15 20  25 30 35  40

                              page 12
                  )%(
                  noitanimreg
                  dees
                     100
                      90
                      80
                      70
                      60
                      50
                      40
                          lead nitrate concentration (mM)
    Identify the lead nitrate concentration (mM) in which seed germination was 50% of the
    control.
    A  18
    B  20
    C  33
    D  35
PDF page 13
Paper 1, Question 21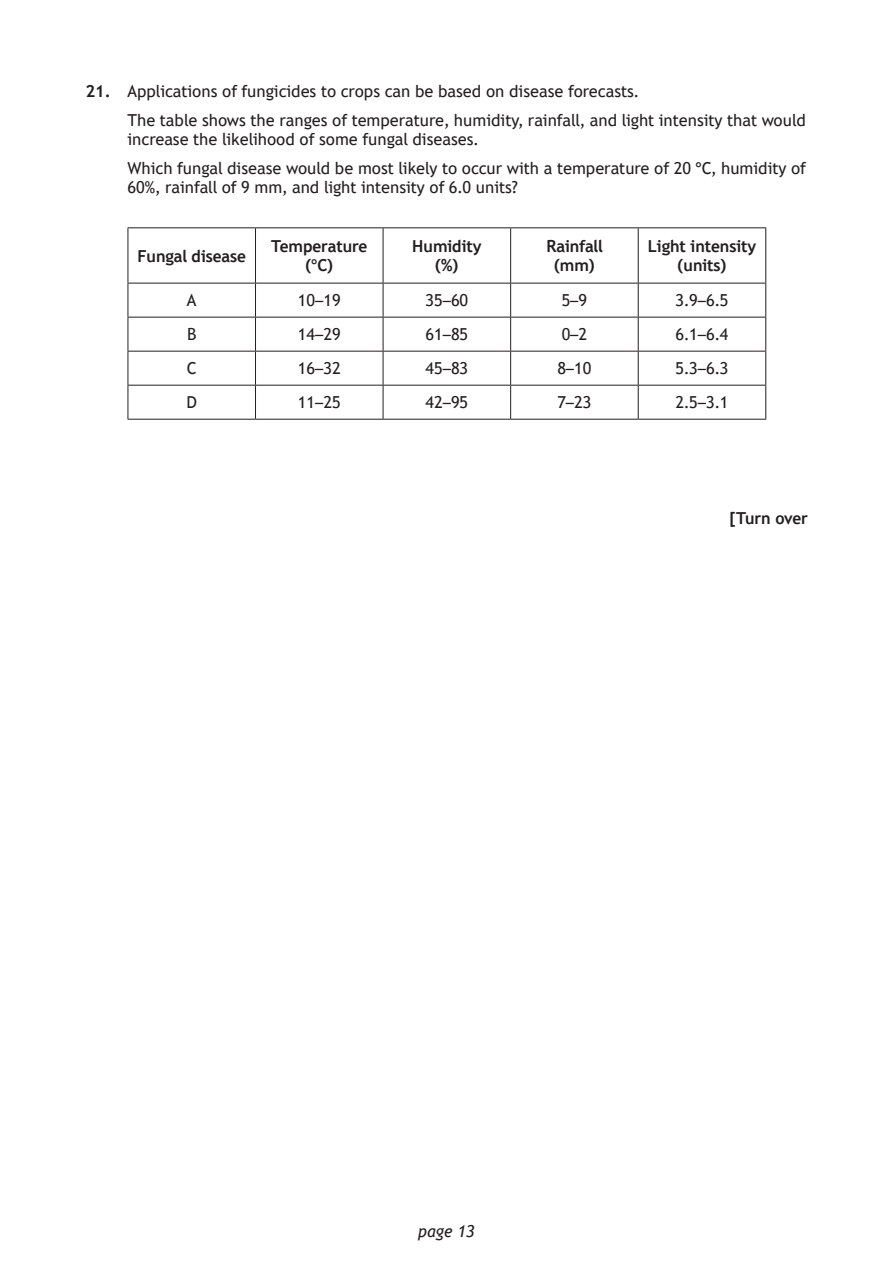
Selectable page text
21. Applications of fungicides to crops can be based on disease forecasts.

    The table shows the ranges of temperature, humidity, rainfall, and light intensity that would
    increase the likelihood of some fungal diseases.
    Which fungal disease would be most likely to occur with a temperature of 20 °C, humidity of
    60%, rainfall of 9 mm, and light intensity of 6.0 units?

                 Temperature  Humidity    Rainfall  Light intensity
     Fungal disease
                    (°C)        (%)        (mm)       (units)
         A         10–19       35–60        5–9       3.9–6.5

         B         14–29       61–85        0–2       6.1–6.4

         C         16–32       45–83       8–10       5.3–6.3
         D         11–25       42–95       7–23       2.5–3.1

                                                           [Turn over

                              page 13
PDF page 14
Paper 1, Question 22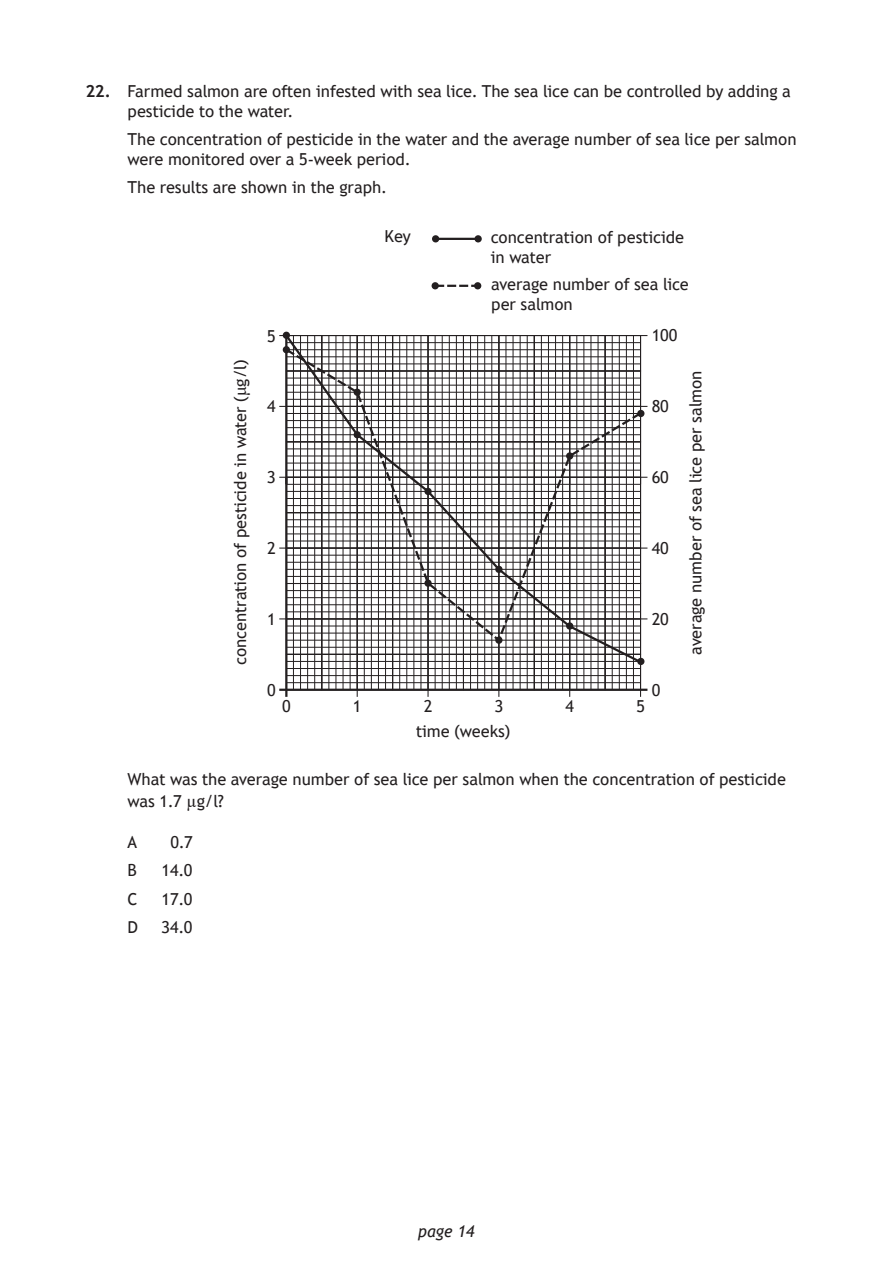
Selectable page text
22. Farmed salmon are often infested with sea lice. The sea lice can be controlled by adding a
    pesticide to the water.

    The concentration of pesticide in the water and the average number of sea lice per salmon
    were monitored over a 5-week period.
    The results are shown in the graph.

                                     concentration of pesticide
                                     in water
                                     average number of sea lice
                                     per salmon

                  0     1      2      3     4      5

                              page 14
             )l/gμ(
             retaw
             ni
             edicitsep
             fo
             noitartnecnoc
                                                       nomlas
                                                       rep
                                                       ecil
                                                       aes
                                                       fo
                                                       rebmun
                                                       egareva
                           Key
                 5                                  100
                 4                                  80
                 3                                  60
                 2                                  40
                 1                                  20
                 0                                  0
                              time (weeks)
    What was the average number of sea lice per salmon when the concentration of pesticide
    was 1.7 µg/l?
    A   0.7
    B  14.0
    C  17.0
    D  34.0
PDF page 15
Paper 1, Question 23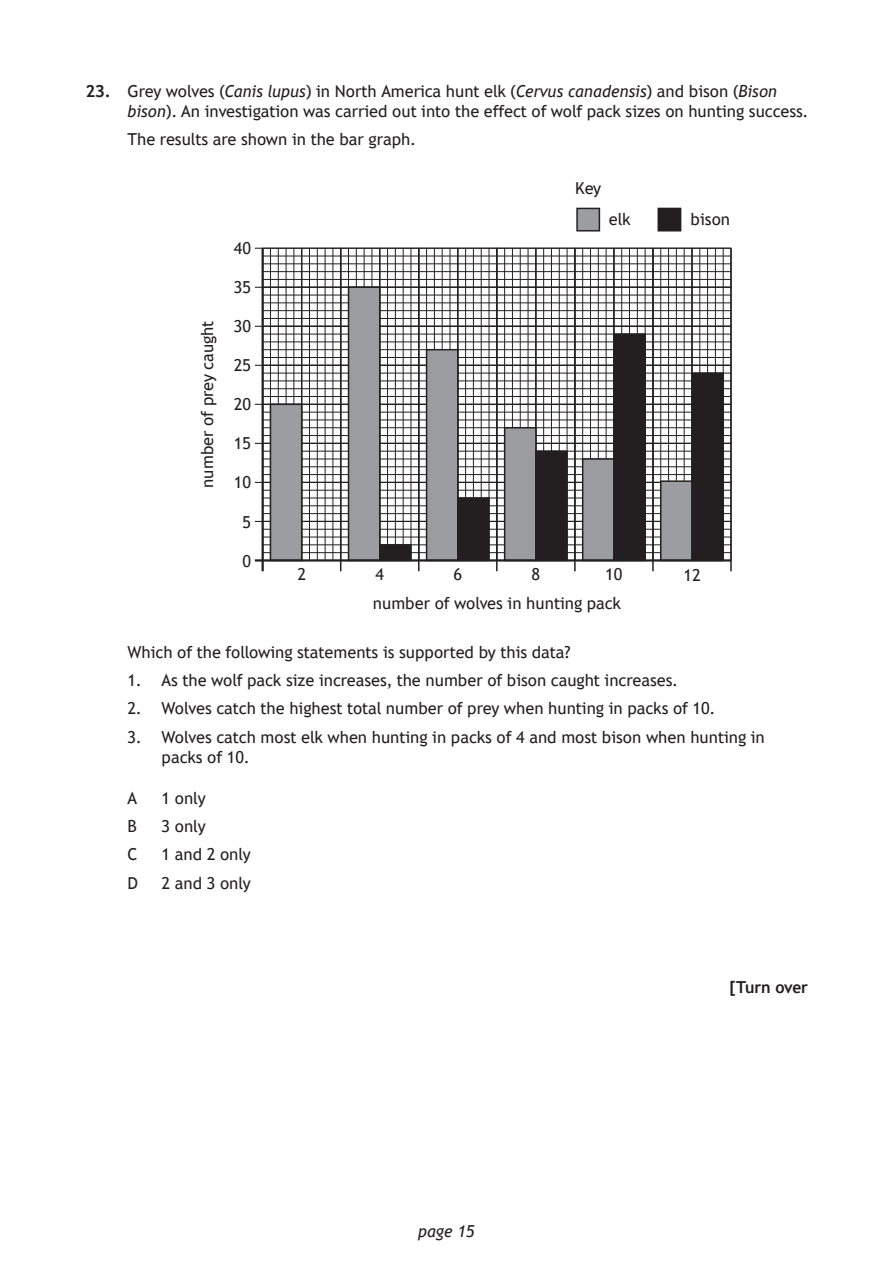
Selectable page text
23. Grey wolves (Canis lupus) in North America hunt elk (Cervus canadensis) and bison (Bison
    bison). An investigation was carried out into the effect of wolf pack sizes on hunting success.

    The results are shown in the bar graph.

                                             Key

                                                elk     bison

                   2       4      6      8      10     12

                          number of wolves in hunting pack

                              page 15
          thguac
          yerp
          fo
          rebmun
             40
             35
             30
             25
             20
             15
             10
              5
              0
    Which of the following statements is supported by this data?
    1. As the wolf pack size increases, the number of bison caught increases.
    2. Wolves catch the highest total number of prey when hunting in packs of 10.
    3. Wolves catch most elk when hunting in packs of 4 and most bison when hunting in
       packs of 10.
    A  1 only
    B  3 only
    C  1 and 2 only
    D  2 and 3 only
                                                           [Turn over
PDF page 16
Paper 1, Question 24Paper 1, Question 25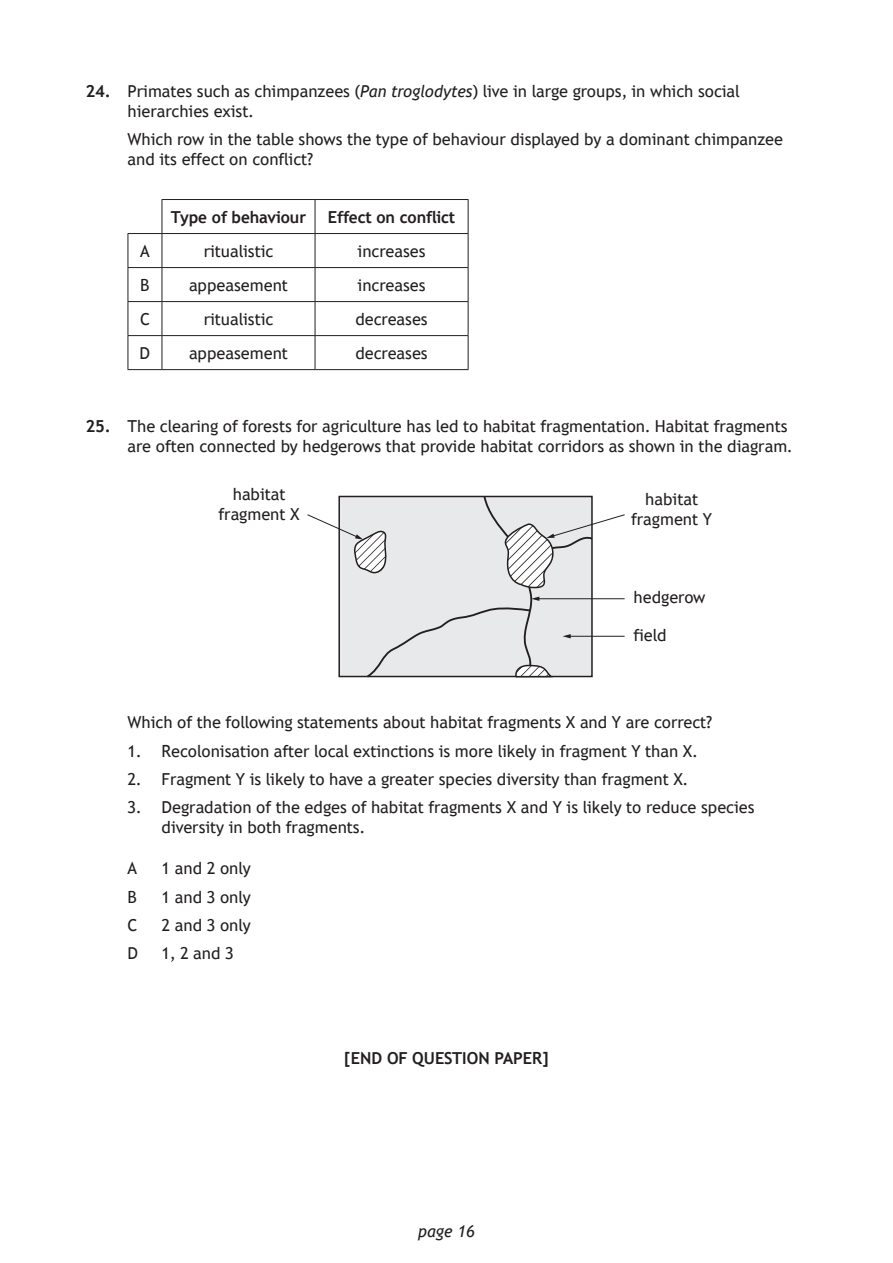
Selectable page text
24. Primates such as chimpanzees (Pan troglodytes) live in large groups, in which social
    hierarchies exist.

    Which row in the table shows the type of behaviour displayed by a dominant chimpanzee
    and its effect on conflict?

        Type of behaviour Effect on conflict

     A     ritualistic   increases
     B   appeasement     increases

     C     ritualistic   decreases

     D   appeasement     decreases

25. The clearing of forests for agriculture has led to habitat fragmentation. Habitat fragments
    are often connected by hedgerows that provide habitat corridors as shown in the diagram.

             habitat
                                                   habitat
            fragment X
                                                  fragment Y

                                                  hedgerow

                                                  field

    Which of the following statements about habitat fragments X and Y are correct?
    1. Recolonisation after local extinctions is more likely in fragment Y than X.

    2. Fragment Y is likely to have a greater species diversity than fragment X.
    3. Degradation of the edges of habitat fragments X and Y is likely to reduce species
       diversity in both fragments.

    A  1 and 2 only

    B  1 and 3 only
    C  2 and 3 only

    D  1, 2 and 3

                        [END OF QUESTION PAPER]

                              page 16
PDF page 17

Selectable page text
SPACE FOR ROUGH WORK

      page 17
PDF page 18

Selectable page text
SPACE FOR ROUGH WORK

      page 18
PDF page 19

Selectable page text
[BLANK PAGE]

DO NOT WRITE ON THIS PAGE

       page 19
PDF page 20

Selectable page text
[BLANK PAGE]

DO NOT WRITE ON THIS PAGE

       page 20