2025 Advanced Higher Physics questions
Source: Scottish Qualifications Authority (SQA) / Qualifications Scotland. This is a StemInteract HTML companion, not an official HTML edition. Selectable text is supplied alongside original page images. Use the images or original PDF for equations, powers, fractions, vector notation, tables and diagrams; text extraction cannot fully preserve mathematical layout.
Jump to a question
PDF page 1
Selectable page text
FOR OFFICIAL USE
AH
National
Qualications
Mark
2025
X857/77/01 Physics
THURSDAY, 15 MAY
9:00 AM – 12:00 NOON
*X8577701*
Fill in these boxes and read what is printed below.
Full name of centre Town
Forename(s) Surname Number of seat
Date of birth
Day Month Year Scottish candidate number
Total marks — 155
Attempt ALL questions.
Reference may be made to the Physics relationships sheet X857/77/11 and the data sheet on
page 02.
Write your answers clearly in the spaces provided in this booklet. Additional space for answers
and rough work is provided at the end of this booklet. If you use this space you must clearly
identify the question number you are attempting. Any rough work must be written in this
booklet. You should score through your rough work when you have written your final copy.
Care should be taken to give an appropriate number of significant figures in the final answers to
calculations.
Use blue or black ink.
Before leaving the examination room you must give this booklet to the Invigilator; if you do not,
you may lose all the marks for this paper.
©
*X857770101*
A/PBPDF page 2
Selectable page text
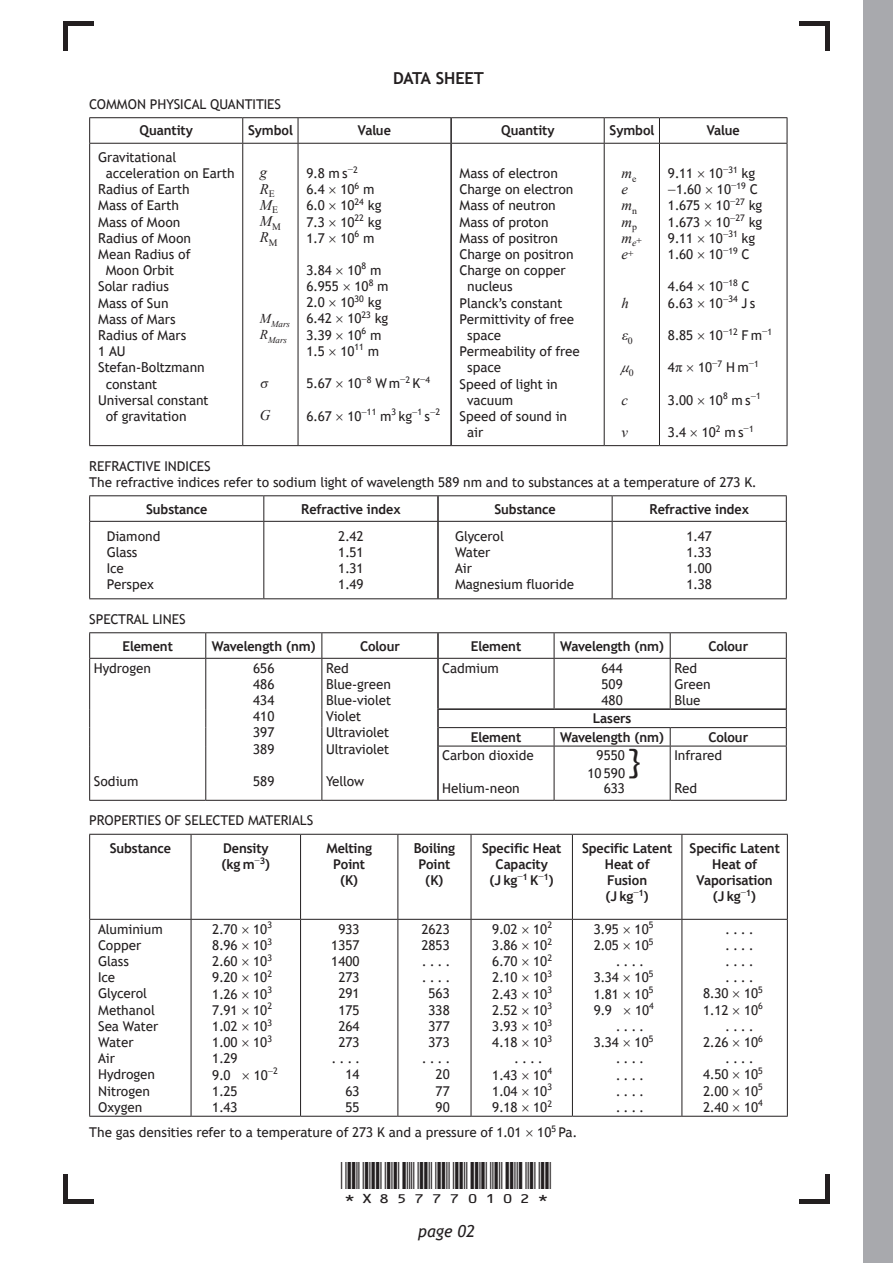
DATA SHEET
COMMON PHYSICAL QUANTITIES
     Quantity  Symbol    Value        Quantity  Symbol   Value

 Gravitational
  acceleration on Earth g 9.8 m s⁻² Mass of electron mₑ 9.11 × 10⁻³¹ kg
 Radius of Earth R_{E} 6.4 × 10⁶ m Charge on electron e −1.60 × 10⁻¹⁹ C
 Mass of Earth  M_{E} 6.0 × 10²⁴ kg Mass of neutron mₙ 1.675 × 10⁻²⁷ kg
 Mass of Moon   M_{M} 7.3 × 10²² kg Mass of proton mₚ 1.673 × 10⁻²⁷ kg
 Radius of Moon R_{M} 1.7 × 10⁶ m Mass of positron mₑ⁺ 9.11 × 10⁻³¹ kg
 Mean Radius of                   Charge on positron e⁺ 1.60 × 10⁻¹⁹ C
  Moon Orbit        3.84 × 10⁸ m  Charge on copper
 Solar radius       6.955 × 10⁸ m  nucleus           4.64 × 10⁻¹⁸ C
 Mass of Sun        2.0 × 10³⁰ kg Planck’s constant h 6.63 × 10⁻³⁴ J s
 Mass of Mars   M_{M}ₐᵣₛ 6.42 × 10²³ kg Permittivity of free
 Radius of Mars R_{M}ₐᵣₛ 3.39 × 10⁶ m space      ε₀  8.85 × 10⁻¹² F m⁻¹
 1 AU               1.5 × 10¹¹ m  Permeability of free
 Stefan-Boltzmann                  space         μ₀  4π × 10⁻⁷ H m⁻¹
  constant      σ   5.67 × 10⁻⁸ W m⁻² K⁻⁴ Speed of light in
 Universal constant                vacuum        c   3.00 × 10⁸ m s⁻¹
  of gravitation G  6.67 × 10⁻¹¹ m³ kg⁻¹ s⁻² Speed of sound in
                                   air           v   3.4 × 10² m s⁻¹
REFRACTIVE INDICES
The refractive indices refer to sodium light of wavelength 589 nm and to substances at a temperature of 273 K.
     Substance      Refractive index Substance      Refractive index
  Diamond              2.42       Glycerol             1.47
  Glass                1.51       Water                1.33
  Ice                  1.31       Air                  1.00
  Perspex              1.49       Magnesium fluoride   1.38
SPECTRAL LINES
   Element Wavelength (nm) Colour  Element  Wavelength (nm) Colour
 Hydrogen      656    Red        Cadmium       644    Red
               486    Blue-green               509    Green
               434    Blue-violet              480    Blue
               410    Violet                   Lasers
               397    Ultraviolet
                                   Element  Wavelength (nm) Colour
               389    Ultraviolet
                                 Carbon dioxide 9550} Infrared
                                              10 590
 Sodium        589    Yellow
                                 Helium-neon    633   Red
PROPERTIES OF SELECTED MATERIALS
  Substance  Density  Melting Boiling Specific Heat Specific Latent Specific Latent
            (kg m⁻³)   Point  Point   Capacity  Heat of  Heat of
                       (K)     (K)   (J kg⁻¹ K⁻¹) Fusion Vaporisation
                                                (J kg⁻¹)  (J kg⁻¹)
 Aluminium  2.70 × 10³ 933     2623  9.02 × 10² 3.95 × 10⁵ . . . .
 Copper     8.96 × 10³ 1357    2853  3.86 × 10² 2.05 × 10⁵ . . . .
 Glass      2.60 × 10³ 1400    . . . . 6.70 × 10² . . . .  . . . .
 Ice        9.20 × 10² 273     . . . . 2.10 × 10³ 3.34 × 10⁵ . . . .
 Glycerol   1.26 × 10³ 291     563   2.43 × 10³ 1.81 × 10⁵ 8.30 × 10⁵
 Methanol   7.91 × 10² 175     338   2.52 × 10³ 9.9 × 10⁴ 1.12 × 10⁶
 Sea Water  1.02 × 10³ 264     377   3.93 × 10³  . . . .   . . . .
 Water      1.00 × 10³ 273     373   4.18 × 10³ 3.34 × 10⁵ 2.26 × 10⁶
 Air        1.29       . . . . . . . . . . . .   . . . .   . . . .
 Hydrogen   9.0 × 10⁻²  14      20   1.43 × 10⁴  . . . . 4.50 × 10⁵
 Nitrogen   1.25        63      77   1.04 × 10³  . . . . 2.00 × 10⁵
 Oxygen     1.43        55      90   9.18 × 10²  . . . . 2.40 × 10⁴
The gas densities refer to a temperature of 273 K and a pressure of 1.01 × 10⁵ Pa.
                       *X857770102*
                              page 02
PDF page 3

Selectable page text
[Turn over for next question

DO NOT WRITE ON THIS PAGE

*X857770103*

       page 03
PDF page 4
Question 1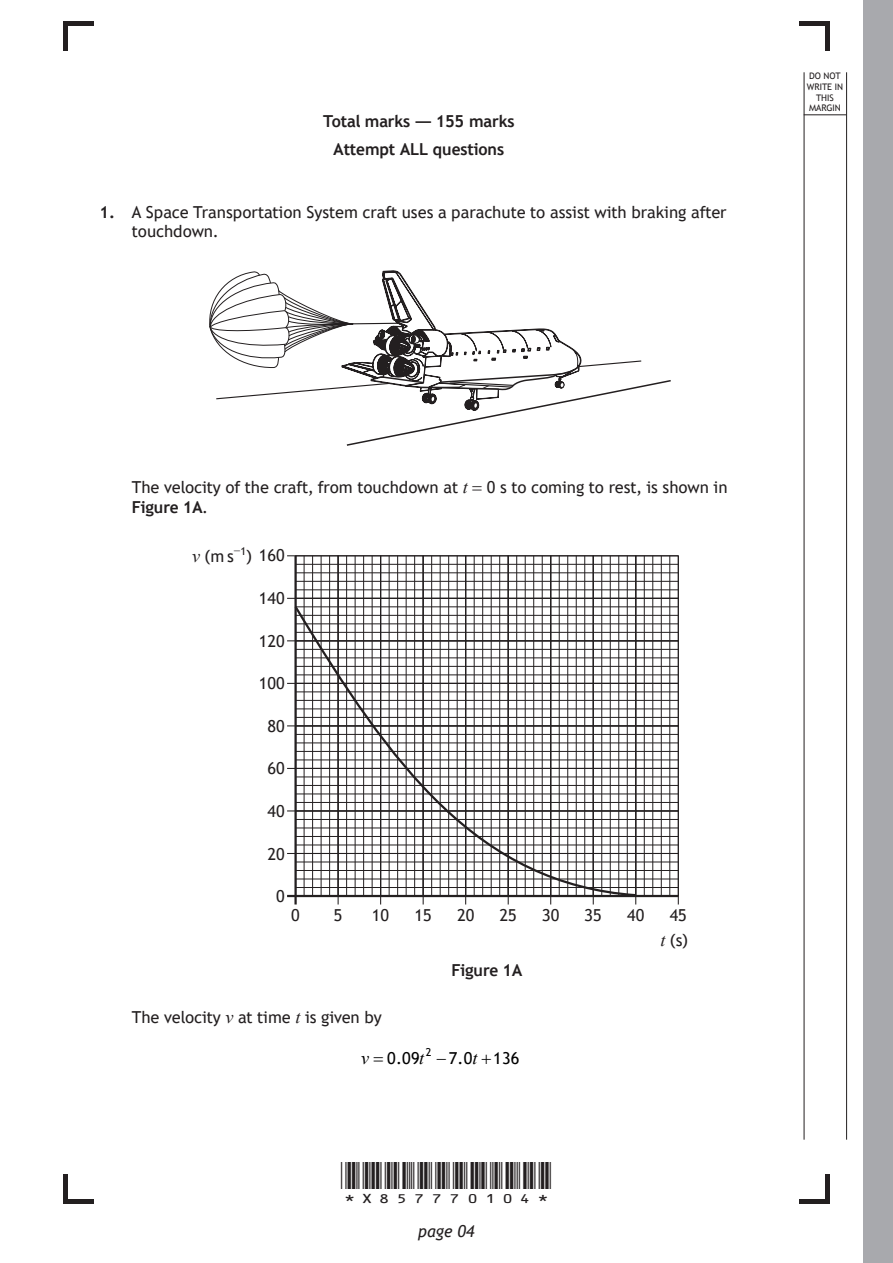
Selectable page text
DO NOT
                                                                 WRITE IN
                                                                  THIS
                                                                 MARGIN
                     Total marks — 155 marks
                      Attempt ALL questions

1. A Space Transportation System craft uses a parachute to assist with braking after
   touchdown.

   The velocity of the craft, from touchdown at t = 0 s to coming to rest, is shown in
   Figure 1A.

         v (m s⁻¹) 160

               140

               120

               100

                80

                60

                40

                20

                0
                  0   5  10  15  20  25  30  35  40  45
                                                    t (s)
                                 Figure 1A

   The velocity v at time t is given by

                        v=0.09t² −7.0t+136

                      *X857770104*

                             page 04
PDF page 5
Selectable page text
MARKS _{W}^{D}_{R}^{O}_{I} _{T}^{N}OT
                                                                   E IN
                                                                  THIS
                                                                 MARGIN
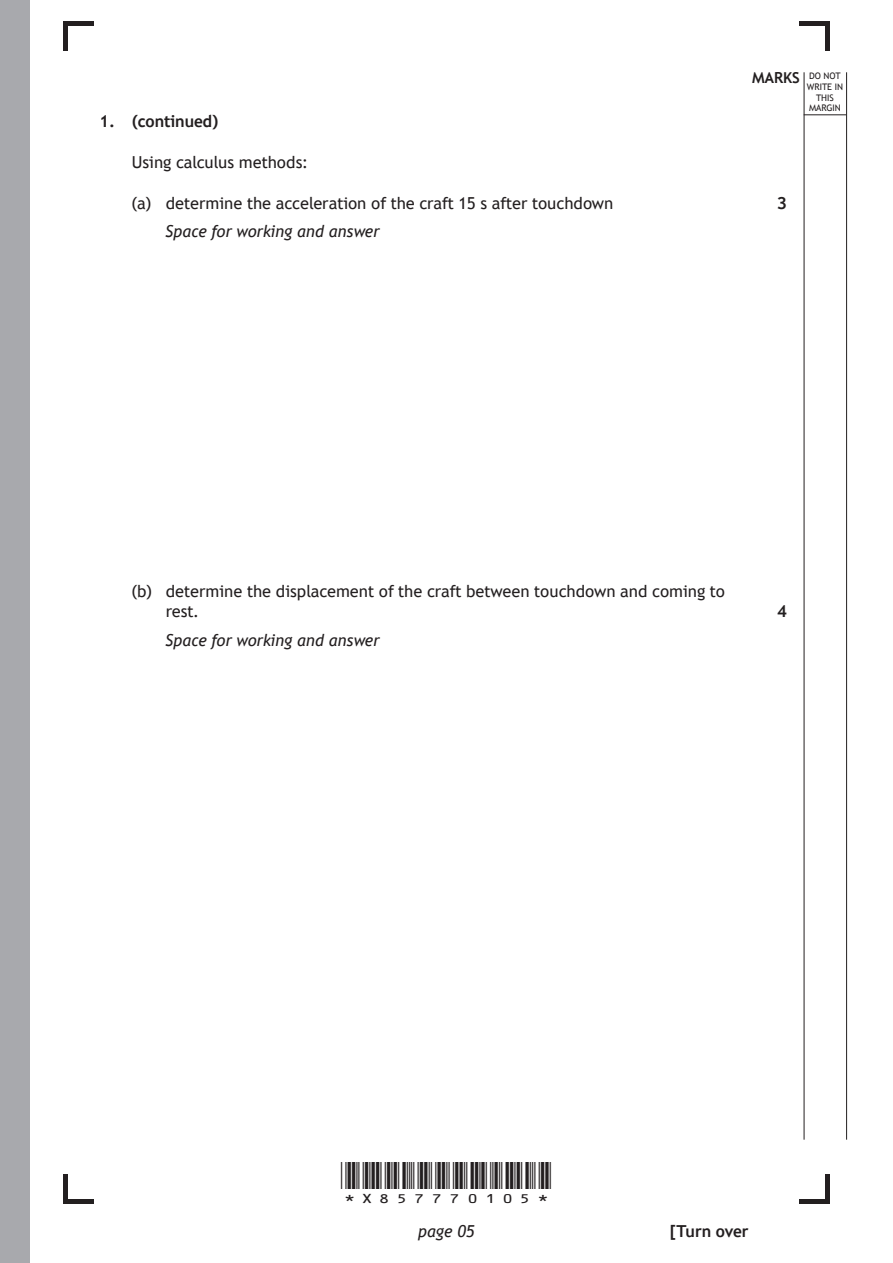
1. (continued)
   Using calculus methods:
   (a) determine the acceleration of the craft 15 s after touchdown 3

      Space for working and answer

   (b) determine the displacement of the craft between touchdown and coming to
      rest.                                                   4
      Space for working and answer

                      *X857770105*

                             page 05                 [Turn over
PDF page 6
Question 2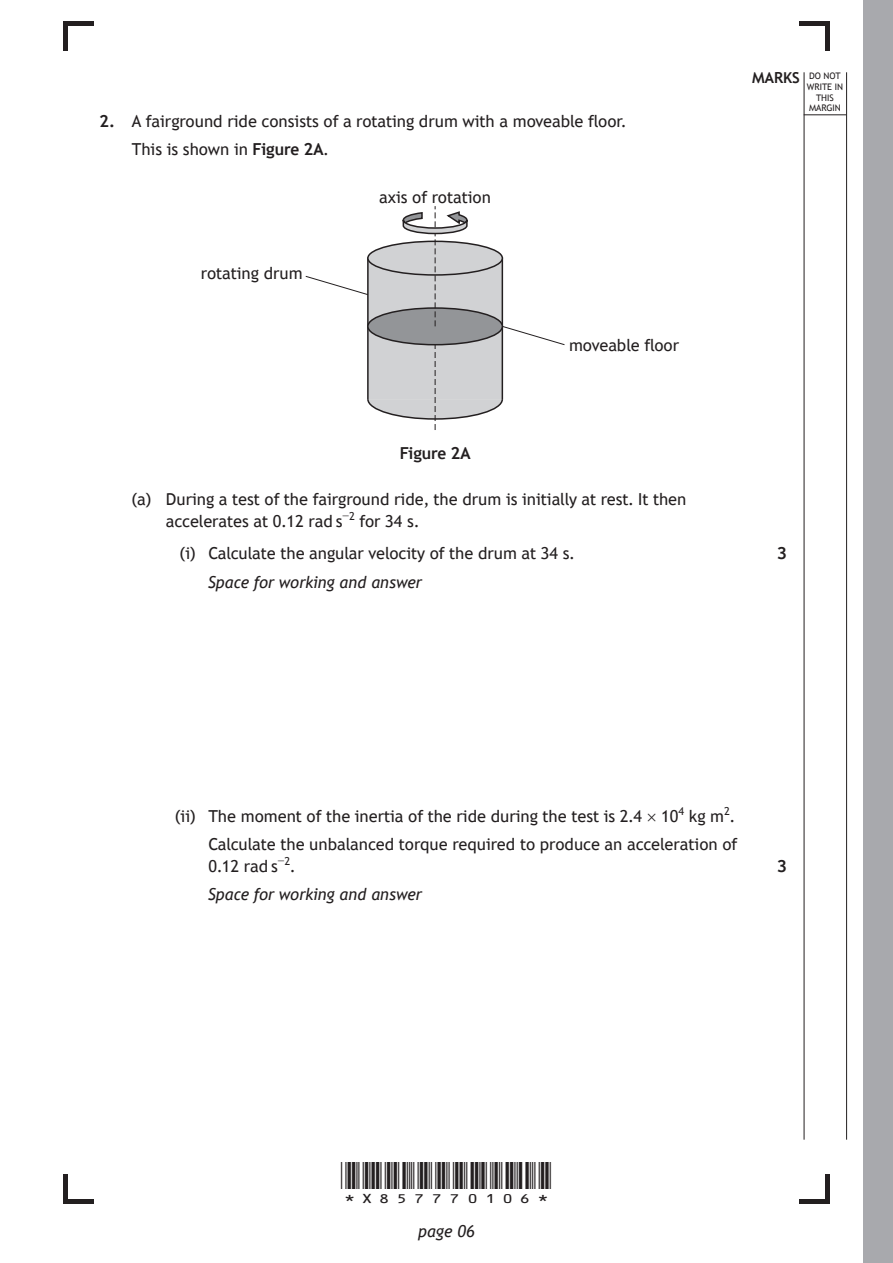
Selectable page text
MARKS _{W}^{D}_{R}^{O}_{I} _{T}^{N}OT
                                                                   E IN
                                                                  THIS
                                                                 MARGIN
2. A fairground ride consists of a rotating drum with a moveable floor.
   This is shown in Figure 2A.
                          axis of rotation

         rotating drum

                                           moveable floor

                            Figure 2A

   (a) During a test of the fairground ride, the drum is initially at rest. It then
      accelerates at 0.12 rad s⁻² for 34 s.

        (i) Calculate the angular velocity of the drum at 34 s. 3
          Space for working and answer

       (ii) The moment of the inertia of the ride during the test is 2.4 × 10⁴ kg m².

          Calculate the unbalanced torque required to produce an acceleration of
          0.12 rad s⁻².                                       3

          Space for working and answer

                      *X857770106*

                             page 06
PDF page 7
Selectable page text
MARKS _{W}^{D}_{R}^{O}_{I} _{T}^{N}OT
                                                                   E IN
                                                                  THIS
                                                                 MARGIN
2. (continued)
   (b) The ride is now operated with people standing against the inside wall of the
      drum.
      State how the unbalanced torque required to produce an acceleration of
      0.12 rad s⁻² compares with the value calculated in part (a) (ii).
      Justify your answer.                                    2

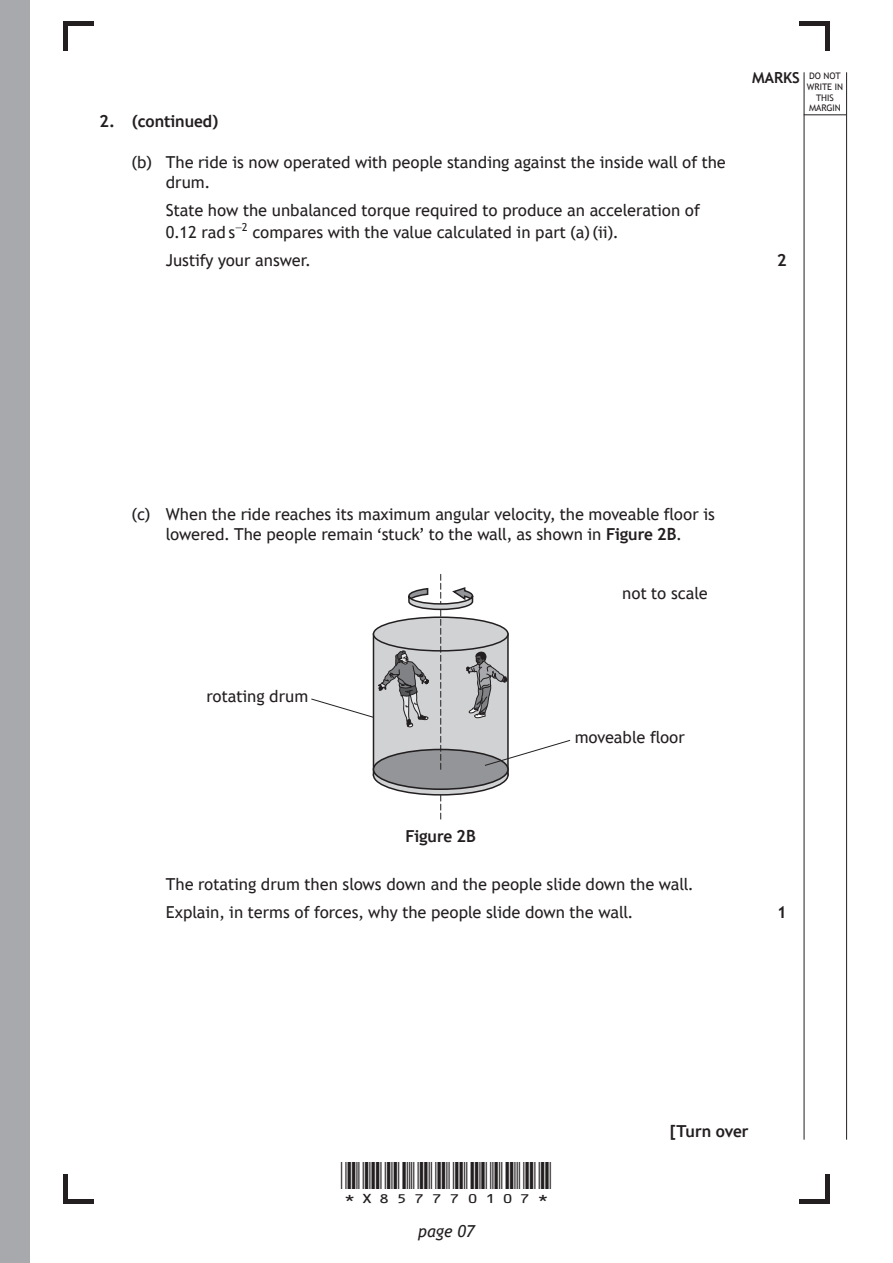
   (c) When the ride reaches its maximum angular velocity, the moveable floor is
      lowered. The people remain ‘stuck’ to the wall, as shown in Figure 2B.

                                                not to scale

          rotating drum

                                            moveable floor

                            Figure 2B

      The rotating drum then slows down and the people slide down the wall.
      Explain, in terms of forces, why the people slide down the wall. 1

                                                     [Turn over

                      *X857770107*

                             page 07
PDF page 8
Question 3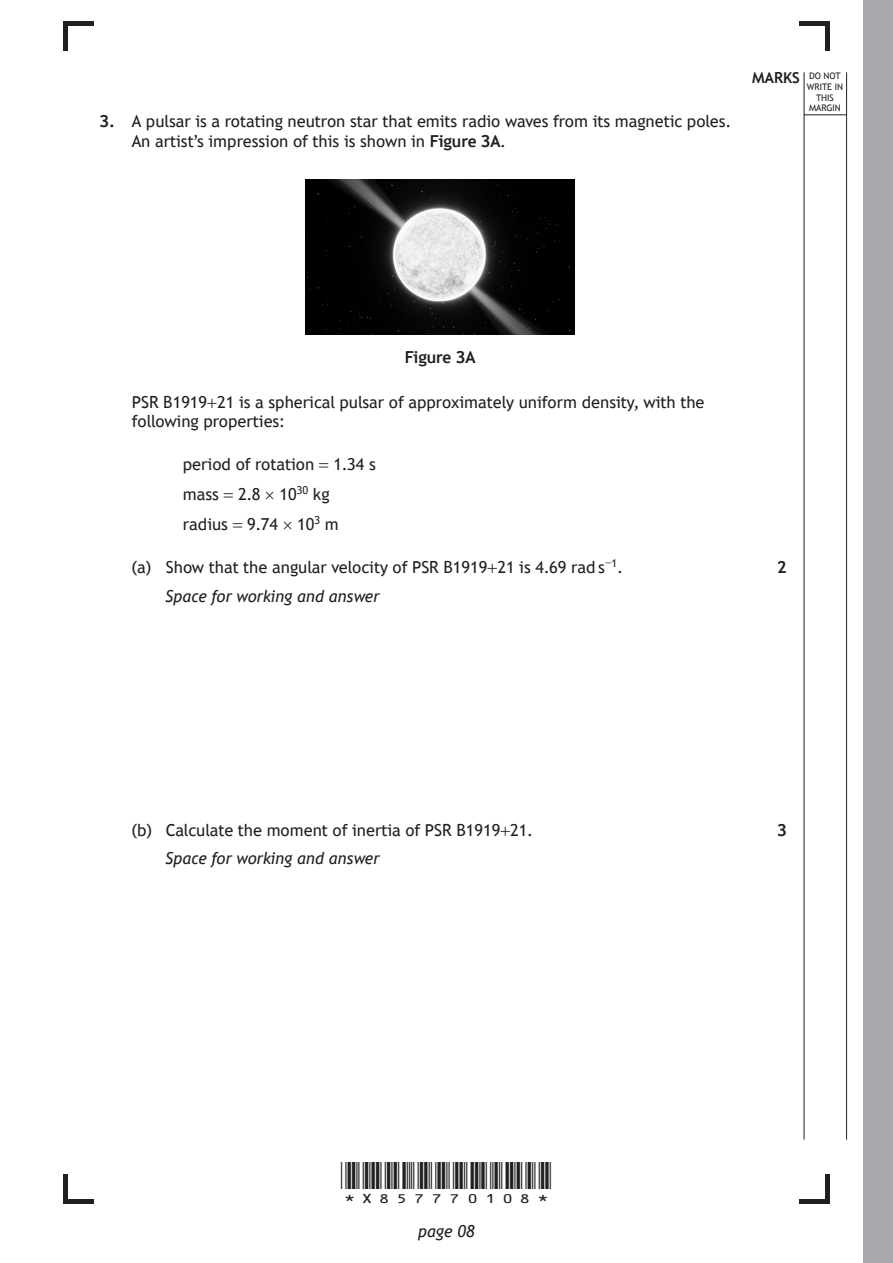
Selectable page text
MARKS _{W}^{D}_{R}^{O}_{I} _{T}^{N}OT
                                                                   E IN
                                                                  THIS
                                                                 MARGIN
3. A pulsar is a rotating neutron star that emits radio waves from its magnetic poles.
   An artist’s impression of this is shown in Figure 3A.

                            Figure 3A

   PSR B1919+21 is a spherical pulsar of approximately uniform density, with the
   following properties:

        period of rotation = 1.34 s

        mass = 2.8 × 10³⁰ kg

        radius = 9.74 × 10³ m

   (a) Show that the angular velocity of PSR B1919+21 is 4.69 rad s⁻¹. 2
      Space for working and answer

   (b) Calculate the moment of inertia of PSR B1919+21.       3

      Space for working and answer

                      *X857770108*

                             page 08
PDF page 9
Selectable page text
MARKS _{W}^{D}_{R}^{O}_{I} _{T}^{N}OT
                                                                   E IN
                                                                  THIS
                                                                 MARGIN
3. (continued)
   (c) The pulsar was formed when the core of its rotating parent star collapsed
      under its own gravity.
      When this occurred, the loss of mass from the core of the parent star was
      negligible.
        (i) State the principle of conservation of angular momentum. 1

       (ii) The core of the parent star had a moment of inertia of 2.7 × 10⁴² kg m².

          Determine the angular velocity of the core of the parent star
          immediately before it collapsed.                    3
          Space for working and answer

                                                     [Turn over

                      *X857770109*

                             page 09
PDF page 10
Selectable page text
MARKS _{W}^{D}_{R}^{O}_{I} _{T}^{N}OT
                                                                   E IN
                                                                  THIS
                                                                 MARGIN
3. (continued)
   (d) Using your knowledge of physics, comment on the similarities and differences
      in the evolution of stars into neutron stars, black holes, and white dwarfs. 3

                      *X857770110*

                             page 10
PDF page 11
Selectable page text
MARKS _{W}^{D}_{R}^{O}_{I} _{T}^{N}OT
                                                                   E IN
                                                                  THIS
                                                                 MARGIN
3. (d) (continued)

                                                     [Turn over

                      *X857770111*

                             page 11
PDF page 12
Question 4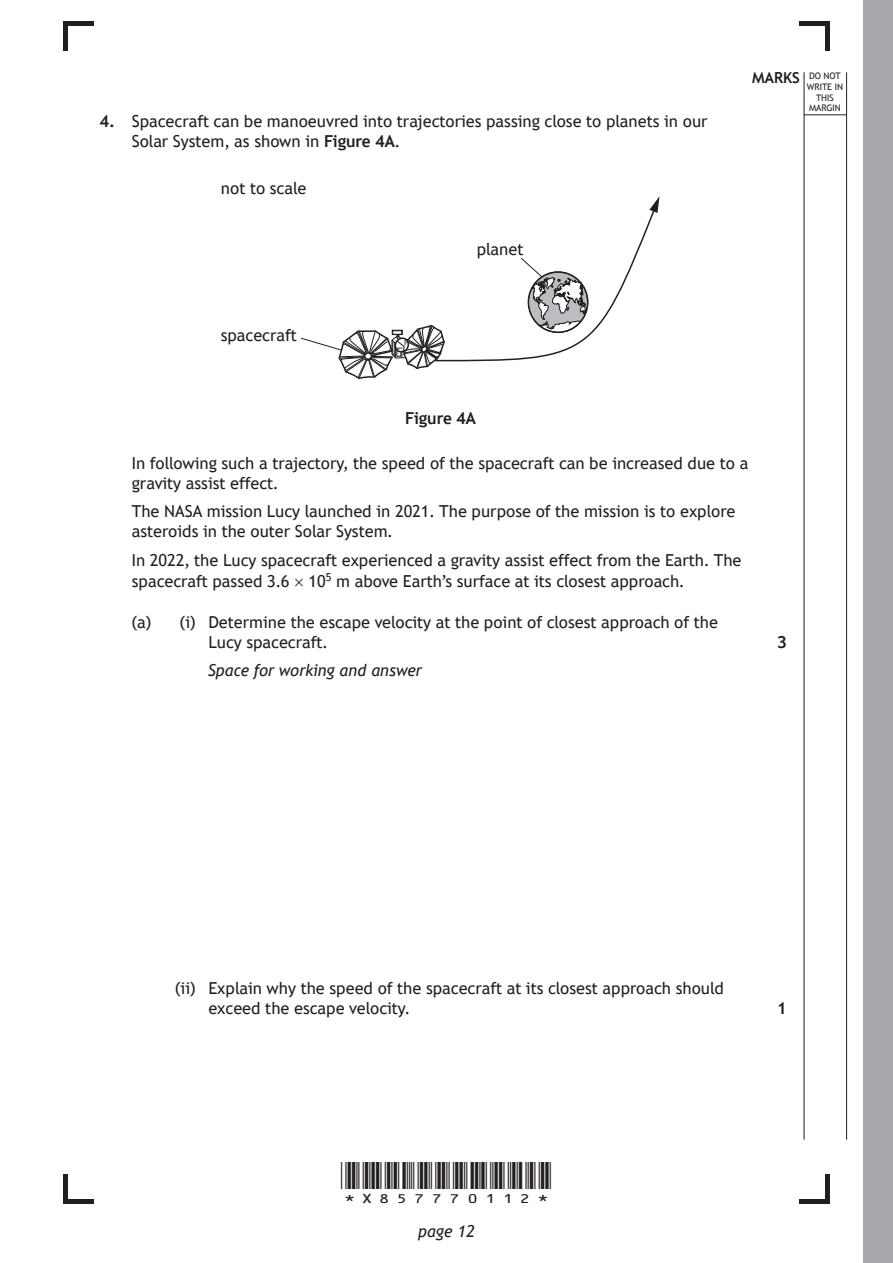
Selectable page text
MARKS _{W}^{D}_{R}^{O}_{I} _{T}^{N}OT
                                                                   E IN
                                                                  THIS
                                                                 MARGIN
4. Spacecraft can be manoeuvred into trajectories passing close to planets in our
   Solar System, as shown in Figure 4A.
           not to scale

                                   planet

           spacecraft

                            Figure 4A

   In following such a trajectory, the speed of the spacecraft can be increased due to a
   gravity assist effect.

   The NASA mission Lucy launched in 2021. The purpose of the mission is to explore
   asteroids in the outer Solar System.
   In 2022, the Lucy spacecraft experienced a gravity assist effect from the Earth. The
   spacecraft passed 3.6 × 10⁵ m above Earth’s surface at its closest approach.

   (a)  (i) Determine the escape velocity at the point of closest approach of the
          Lucy spacecraft.                                    3
          Space for working and answer

       (ii) Explain why the speed of the spacecraft at its closest approach should
          exceed the escape velocity.                         1

                      *X857770112*

                             page 12
PDF page 13
Selectable page text
MARKS _{W}^{D}_{R}^{O}_{I} _{T}^{N}OT
E IN
THIS
MARGIN
4. (continued)
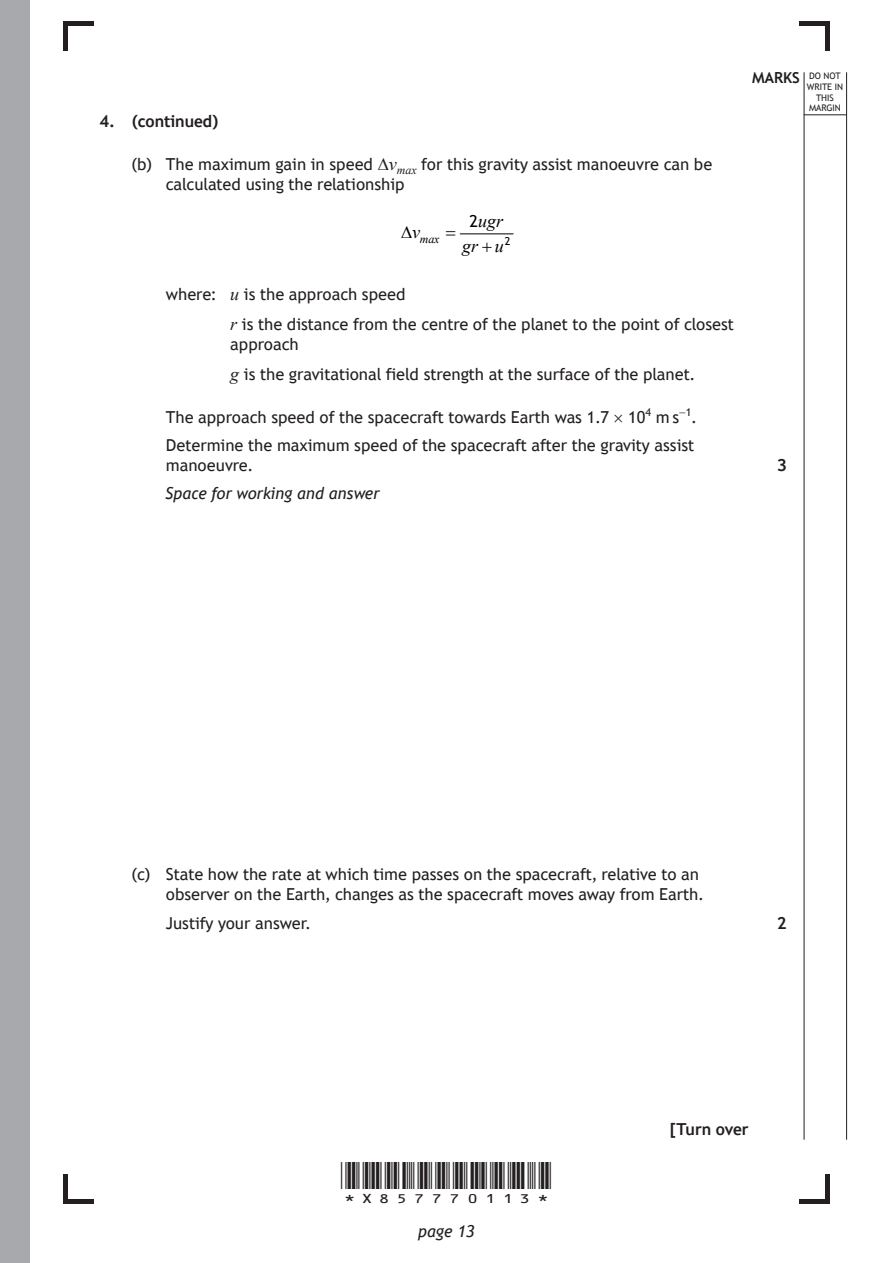
(b) The maximum gain in speed ∆vₘ for this gravity assist manoeuvre can be
calculated using the relationship^{a}^{x}
2ugr
vₘₐₓ =
gr+u²
where: u is the approach speed
r is the distance from the centre of the planet to the point of closest
approach
g is the gravitational field strength at the surface of the planet.
The approach speed of the spacecraft towards Earth was 1.7 × 10⁴ m s⁻¹.
Determine the maximum speed of the spacecraft after the gravity assist
manoeuvre. 3
Space for working and answer
(c) State how the rate at which time passes on the spacecraft, relative to an
observer on the Earth, changes as the spacecraft moves away from Earth.
Justify your answer. 2
[Turn over
*X857770113*
page 13PDF page 14
Question 5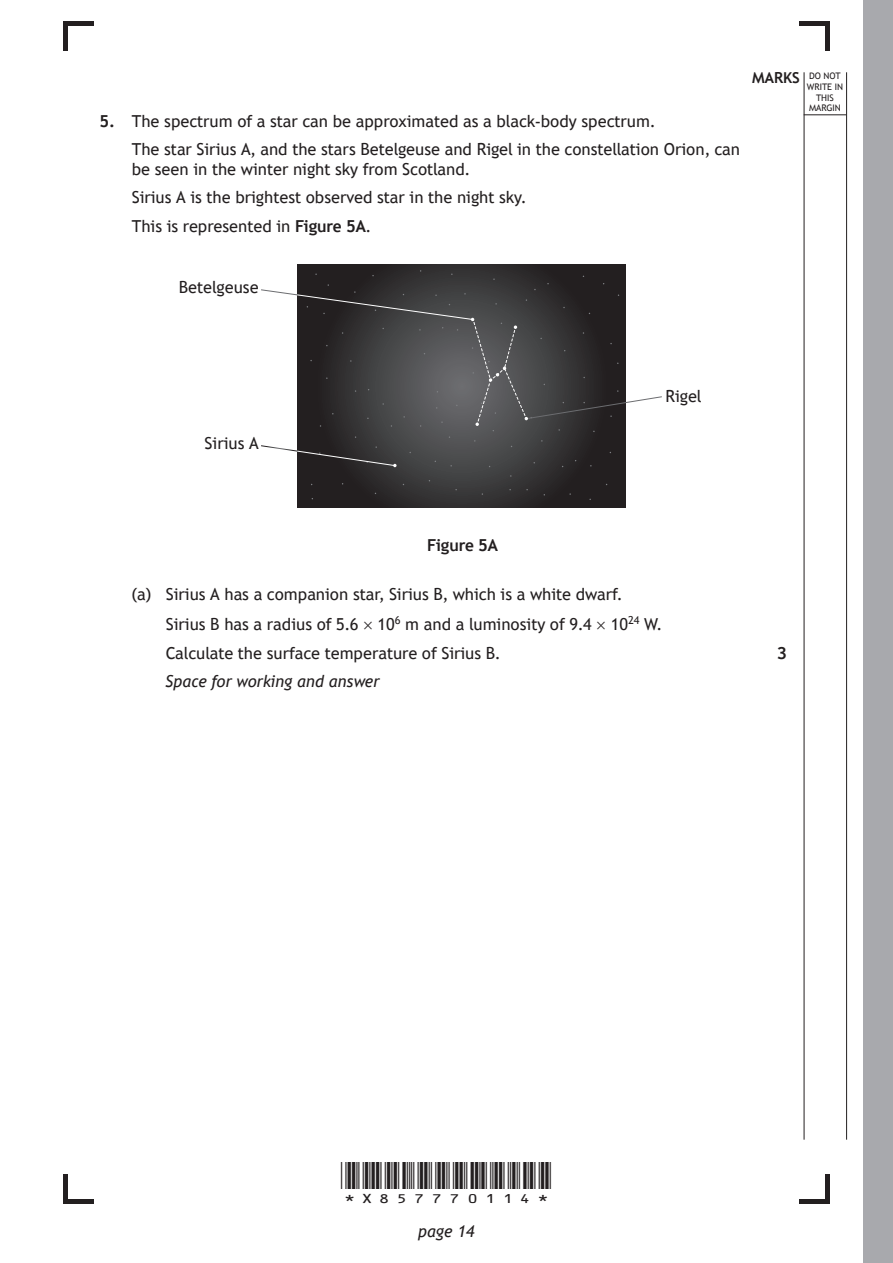
Selectable page text
MARKS _{W}^{D}_{R}^{O}_{I} _{T}^{N}OT
                                                                   E IN
                                                                  THIS
                                                                 MARGIN
5. The spectrum of a star can be approximated as a black-body spectrum.
   The star Sirius A, and the stars Betelgeuse and Rigel in the constellation Orion, can
   be seen in the winter night sky from Scotland.
   Sirius A is the brightest observed star in the night sky.
   This is represented in Figure 5A.

       Betelgeuse

                                                    Rigel

          Sirius A

                              Figure 5A

   (a) Sirius A has a companion star, Sirius B, which is a white dwarf.

      Sirius B has a radius of 5.6 × 10⁶ m and a luminosity of 9.4 × 10²⁴ W.
      Calculate the surface temperature of Sirius B.          3

      Space for working and answer

                      *X857770114*

                             page 14
PDF page 15
Selectable page text
MARKS _{W}^{D}_{R}^{O}_{I} _{T}^{N}OT
                                                                   E IN
                                                                  THIS
                                                                 MARGIN
5. (continued)
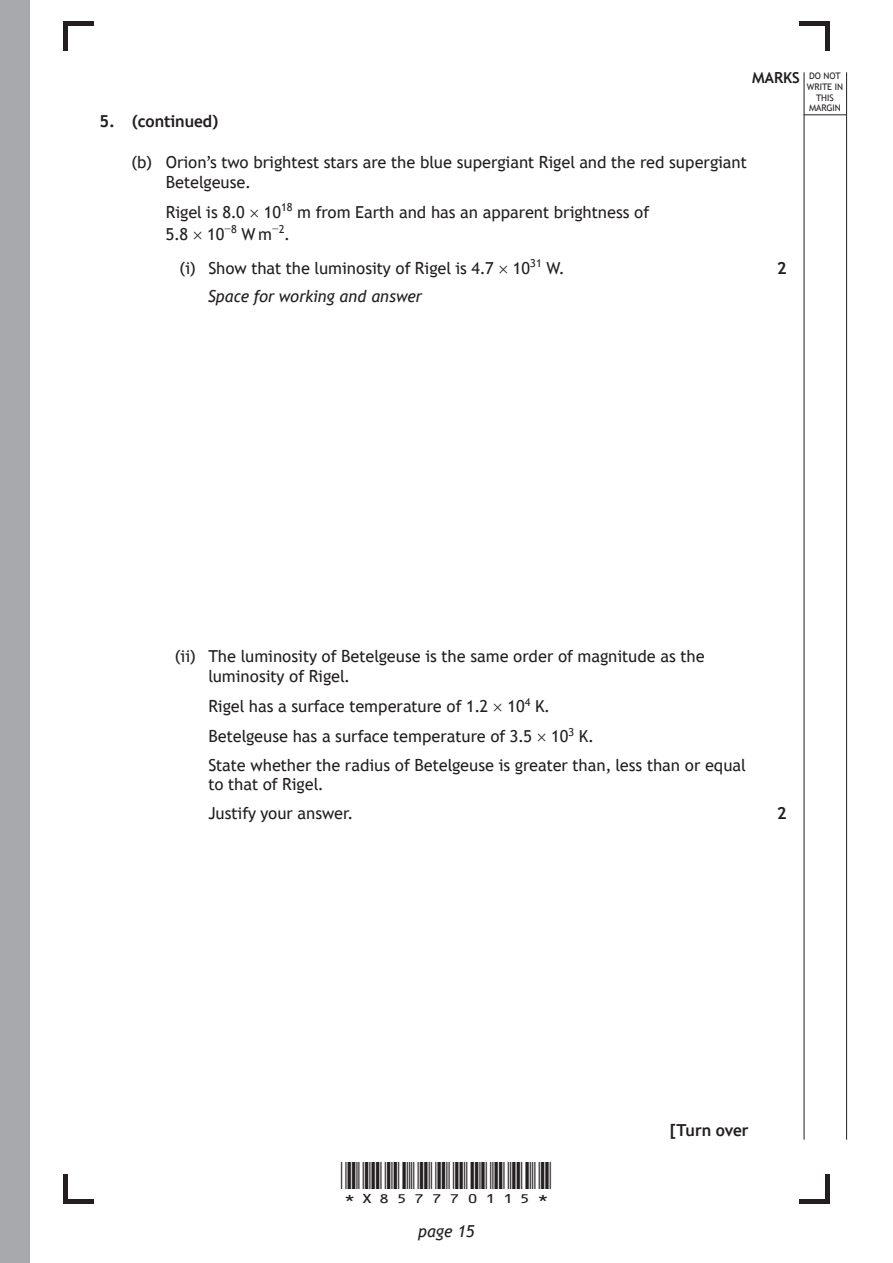
   (b) Orion’s two brightest stars are the blue supergiant Rigel and the red supergiant
      Betelgeuse.
      Rigel is 8.0 × 10¹⁸ m from Earth and has an apparent brightness of
      5.8 × 10⁻⁸ W m⁻².
        (i) Show that the luminosity of Rigel is 4.7 × 10³¹ W. 2

          Space for working and answer

       (ii) The luminosity of Betelgeuse is the same order of magnitude as the
          luminosity of Rigel.

          Rigel has a surface temperature of 1.2 × 10⁴ K.
          Betelgeuse has a surface temperature of 3.5 × 10³ K.

          State whether the radius of Betelgeuse is greater than, less than or equal
          to that of Rigel.
          Justify your answer.                                2

                                                     [Turn over

                      *X857770115*

                             page 15
PDF page 16
Selectable page text
MARKS _{W}^{D}_{R}^{O}_{I} _{T}^{N}OT
                                                                   E IN
                                                                  THIS
                                                                 MARGIN
5. (continued)
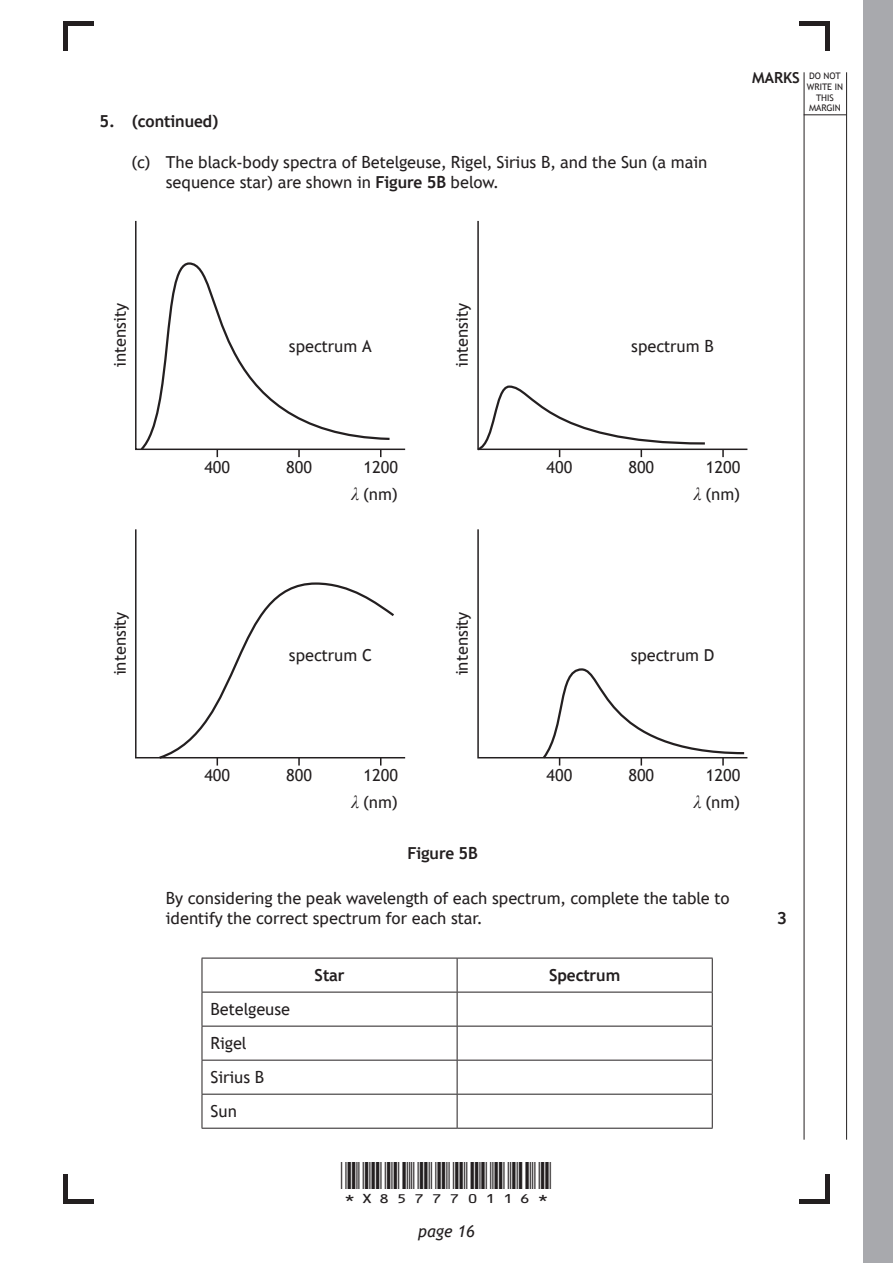
   (c) The black-body spectra of Betelgeuse, Rigel, Sirius B, and the Sun (a main
      sequence star) are shown in Figure 5B below.

                  spectrum A

          400    800

                      *X857770116*

                             page 16
 ytisnetni
                                                 spectrum B
                        1200             400     800
                       λ (nm)
                                 ytisnetni
                                                        1200
                                                       λ (nm)
                  spectrum C
          400    800
 ytisnetni
                                                 spectrum D
                        1200             400     800
                       λ (nm)
                                 ytisnetni
                                                        1200
                                                       λ (nm)
                            Figure 5B
      By considering the peak wavelength of each spectrum, complete the table to
      identify the correct spectrum for each star.            3
                    Star                 Spectrum
          Betelgeuse
          Rigel
          Sirius B
          Sun
PDF page 17
Question 6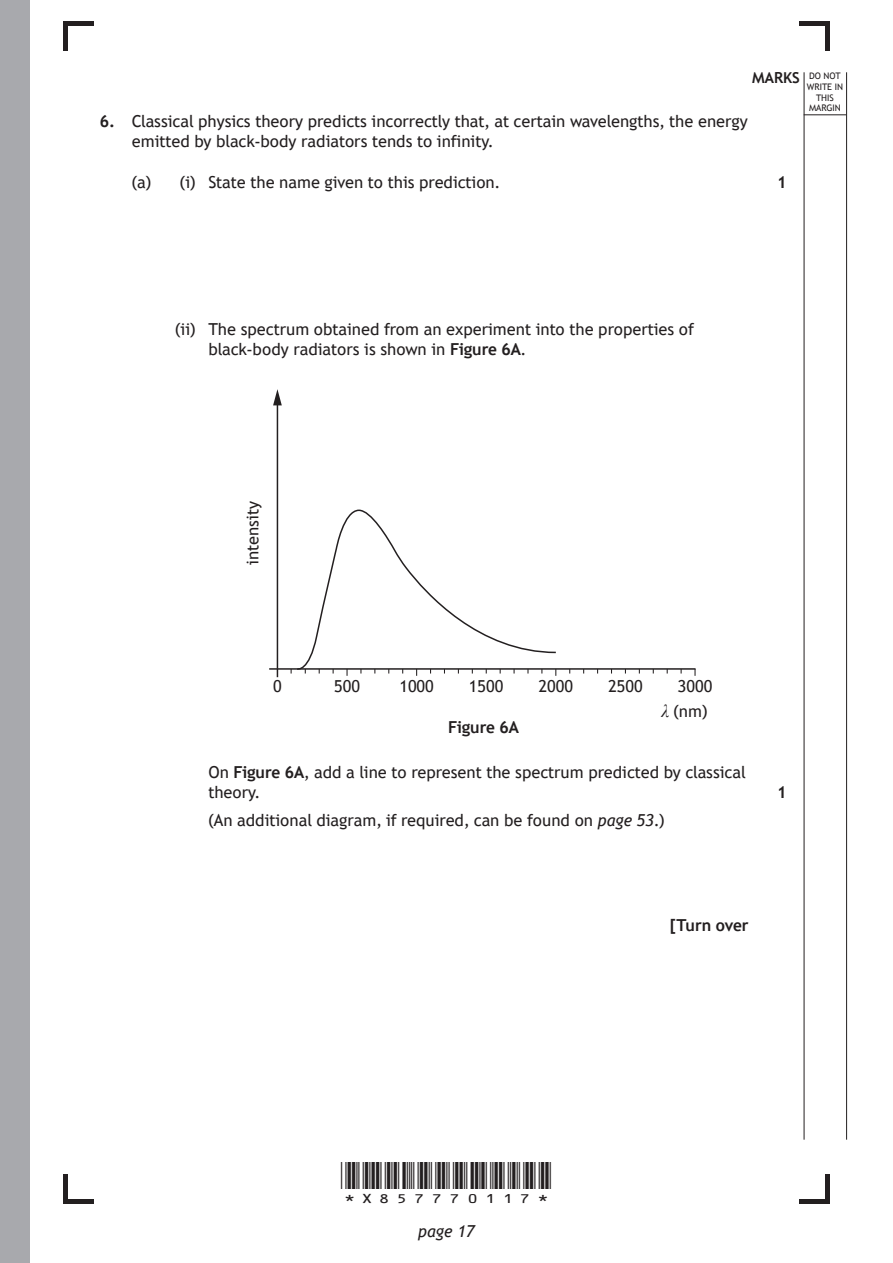
Selectable page text
MARKS _{W}^{D}_{R}^{O}_{I} _{T}^{N}OT
                                                                   E IN
                                                                  THIS
                                                                 MARGIN
6. Classical physics theory predicts incorrectly that, at certain wavelengths, the energy
   emitted by black-body radiators tends to infinity.
   (a)  (i) State the name given to this prediction.

       (ii) The spectrum obtained from an experiment into the properties of
          black-body radiators is shown in Figure 6A.

                      *X857770117*

                             page 17
              ytisnetni
                                                              1
                0     500   1000  1500   2000  2500  3000
                                                    λ (nm)
                                Figure 6A
          On Figure 6A, add a line to represent the spectrum predicted by classical
          theory.                                             1
          (An additional diagram, if required, can be found on page 53.)
                                                     [Turn over
PDF page 18
Selectable page text
6. (continued)                                              MARKS _{W}^{D}_{R}^{O}_{I} _{T}^{N}OT
                                                                   E IN
                                                                  THIS
                                                                 MARGIN
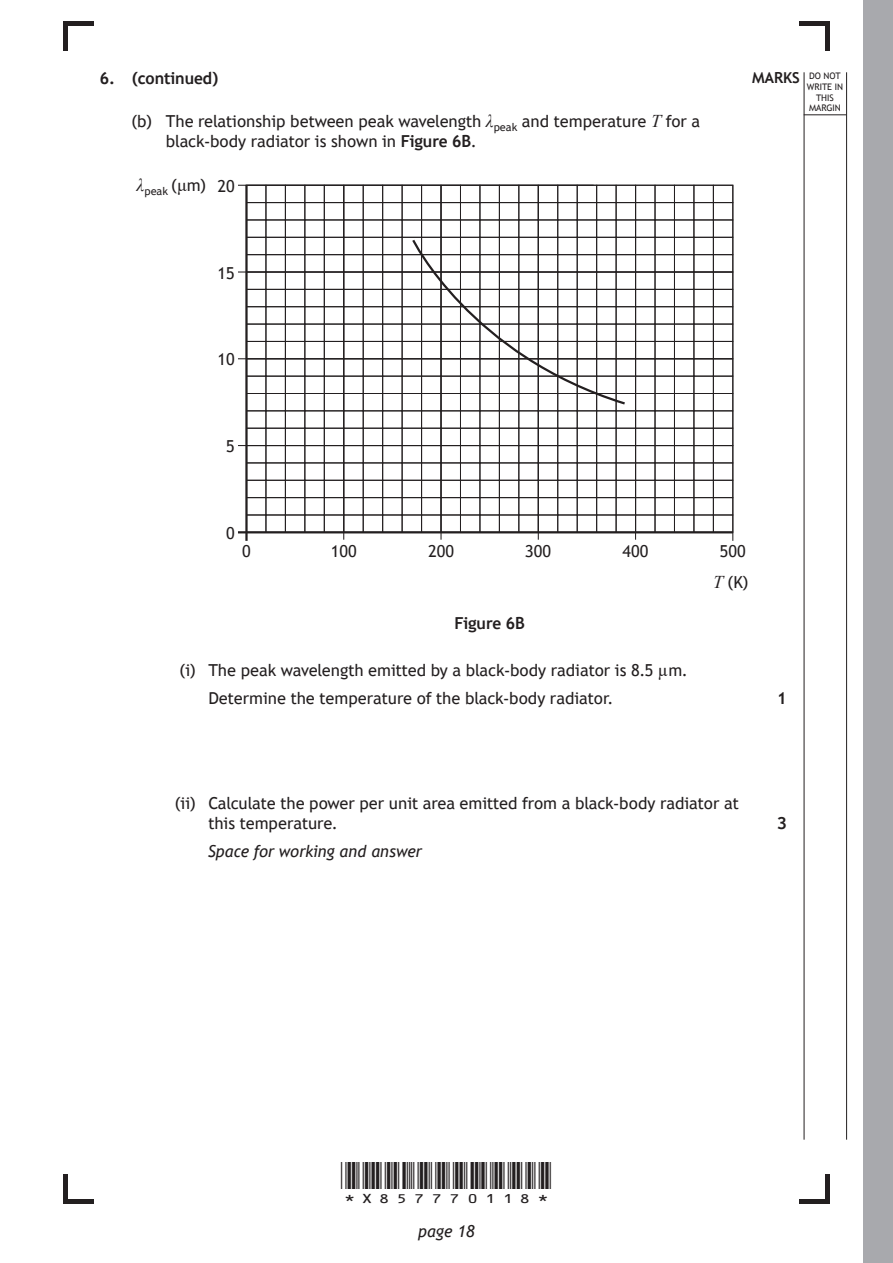
   (b) The relationship between peak wavelength λₚₑₐₖ and temperature T for a
      black-body radiator is shown in Figure 6B.
    λₚₑₐₖ(μm) 20

           15

           10

            5

            0
             0       100      200      300      400      500

                                                         T (K)

                                 Figure 6B

        (i) The peak wavelength emitted by a black-body radiator is 8.5 µm.
          Determine the temperature of the black-body radiator. 1

       (ii) Calculate the power per unit area emitted from a black-body radiator at
          this temperature.                                   3
          Space for working and answer

                      *X857770118*

                             page 18
PDF page 19
Selectable page text
MARKS _{W}^{D}_{R}^{O}_{I} _{T}^{N}OT
                                                                   E IN
                                                                  THIS
                                                                 MARGIN
6. (b) (continued)
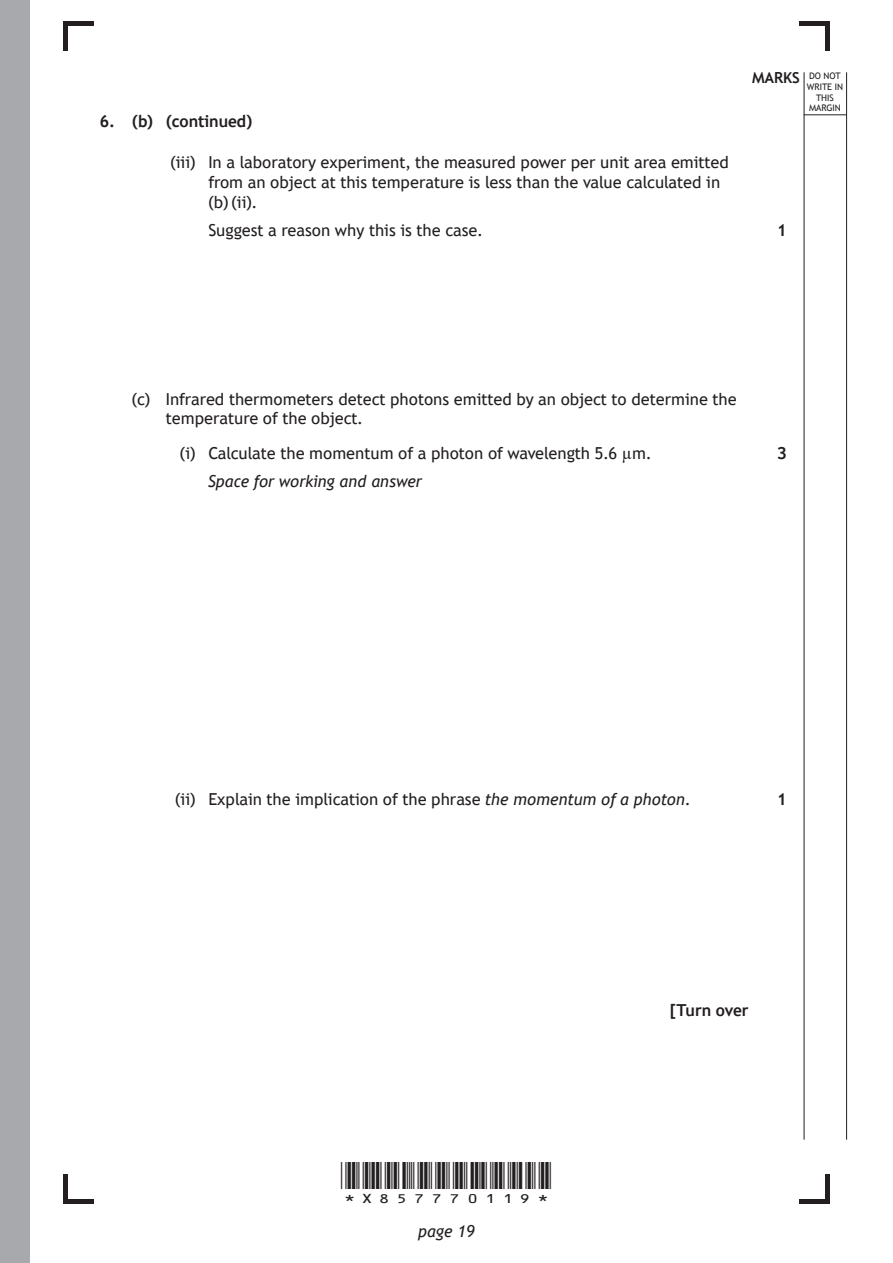
       (iii) In a laboratory experiment, the measured power per unit area emitted
          from an object at this temperature is less than the value calculated in
          (b) (ii).
          Suggest a reason why this is the case.              1

   (c) Infrared thermometers detect photons emitted by an object to determine the
      temperature of the object.

        (i) Calculate the momentum of a photon of wavelength 5.6 µm. 3
          Space for working and answer

       (ii) Explain the implication of the phrase the momentum of a photon. 1

                                                     [Turn over

                      *X857770119*

                             page 19
PDF page 20
Question 7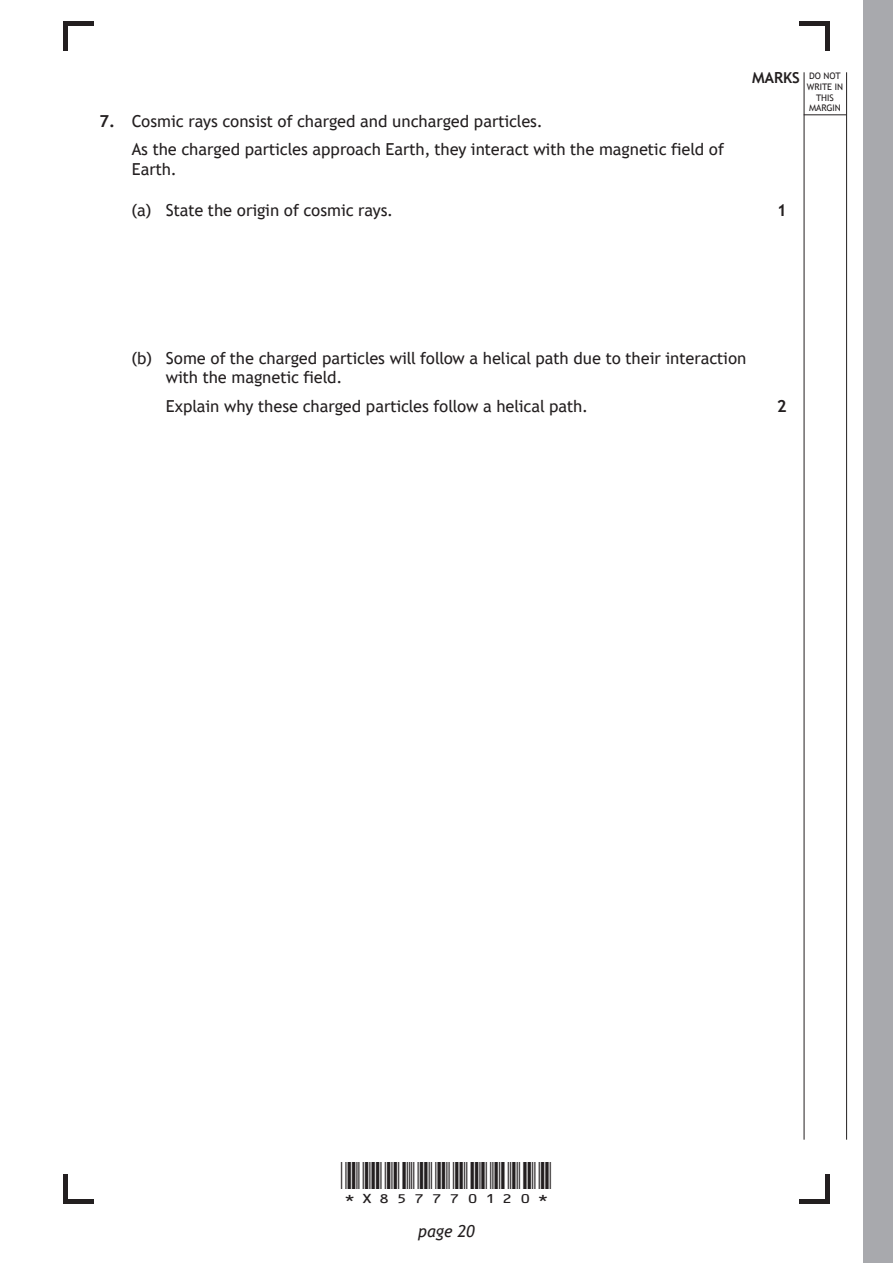
Selectable page text
MARKS _{W}^{D}_{R}^{O}_{I} _{T}^{N}OT
                                                                   E IN
                                                                  THIS
                                                                 MARGIN
7. Cosmic rays consist of charged and uncharged particles.
   As the charged particles approach Earth, they interact with the magnetic field of
   Earth.
   (a) State the origin of cosmic rays.                       1

   (b) Some of the charged particles will follow a helical path due to their interaction
      with the magnetic field.
      Explain why these charged particles follow a helical path. 2

                      *X857770120*

                             page 20
PDF page 21
Selectable page text
MARKS _{W}^{D}_{R}^{O}_{I} _{T}^{N}OT
                                                                   E IN
                                                                  THIS
                                                                 MARGIN
7. (continued)
   (c) Some of these cosmic rays will collide with the nuclei of atoms in the upper
      atmosphere of the Earth.
      These collisions create new particles, such as muons, which have short
      lifetimes.
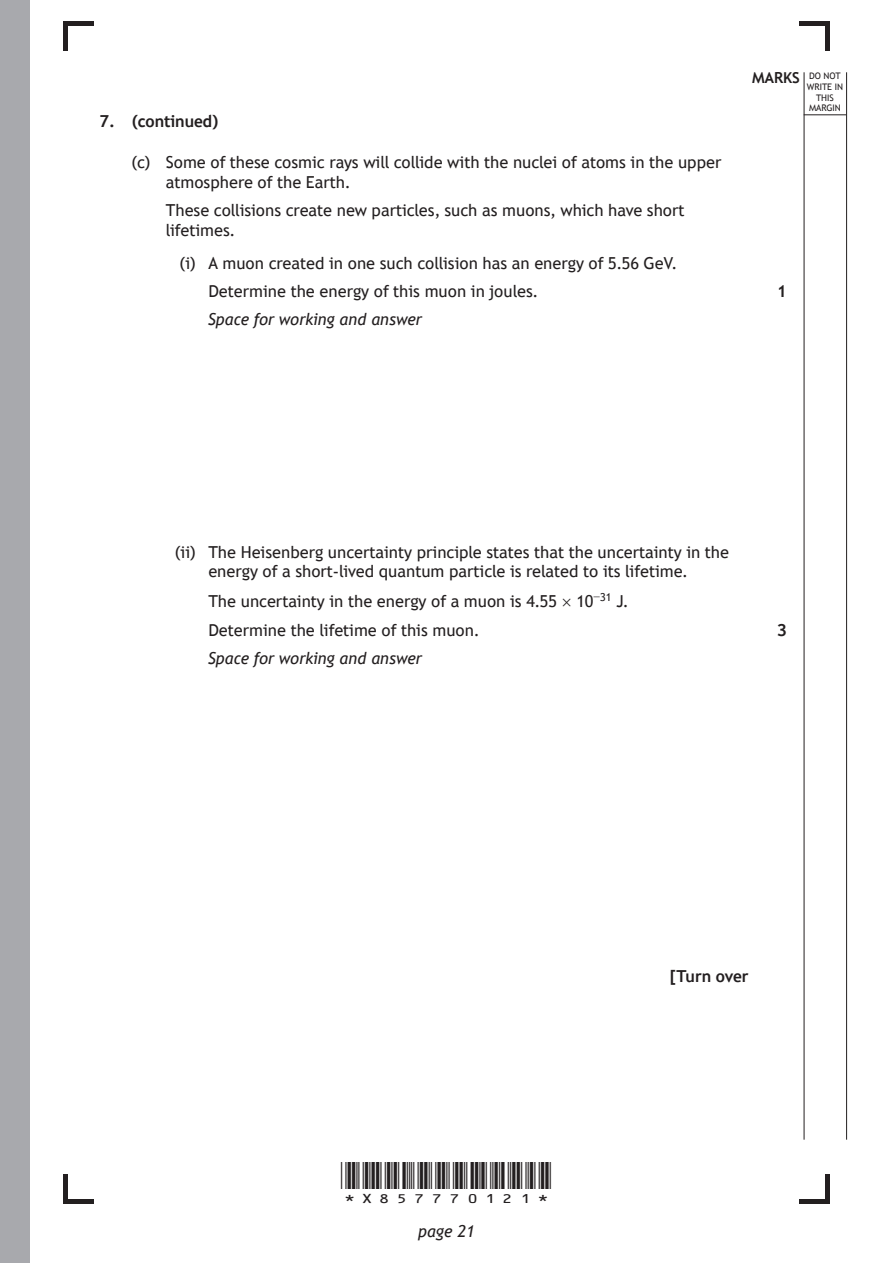
        (i) A muon created in one such collision has an energy of 5.56 GeV.

          Determine the energy of this muon in joules.        1
          Space for working and answer

       (ii) The Heisenberg uncertainty principle states that the uncertainty in the
          energy of a short-lived quantum particle is related to its lifetime.

          The uncertainty in the energy of a muon is 4.55 × 10⁻³¹ J.
          Determine the lifetime of this muon.                3
          Space for working and answer

                                                     [Turn over

                      *X857770121*

                             page 21
PDF page 22
Question 8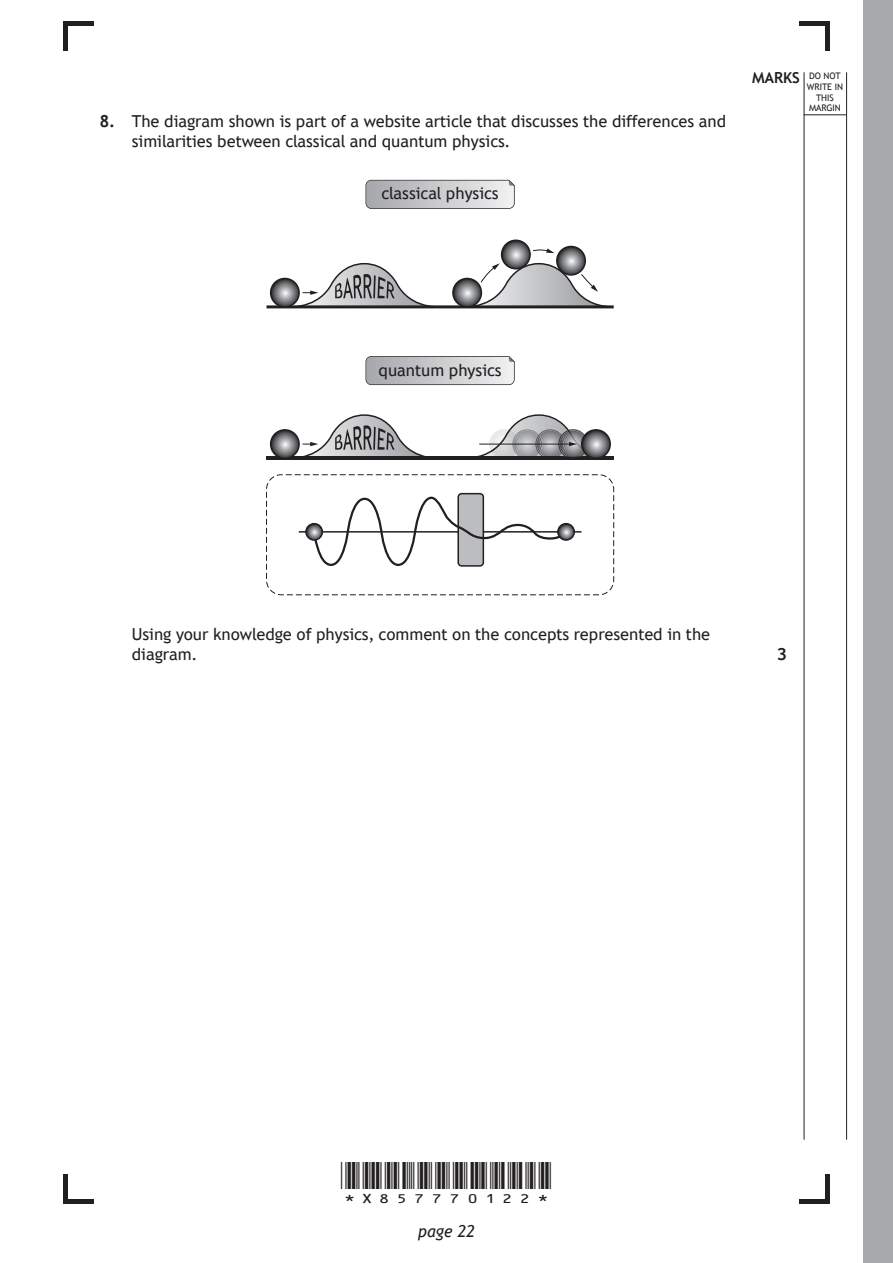
Selectable page text
MARKS _{W}^{D}_{R}^{O}_{I} _{T}^{N}OT
                                                                   E IN
                                                                  THIS
                                                                 MARGIN
8. The diagram shown is part of a website article that discusses the differences and
   similarities between classical and quantum physics.
                          classical physics

                      BARRIER

                          quantum physics

                      BARRIER

   Using your knowledge of physics, comment on the concepts represented in the
   diagram.                                                   3

                      *X857770122*

                             page 22
PDF page 23
Selectable page text
MARKS _{W}^{D}_{R}^{O}_{I} _{T}^{N}OT
                                                                   E IN
                                                                  THIS
                                                                 MARGIN
8. (continued)

                                                     [Turn over

                      *X857770123*

                             page 23
PDF page 24
Question 9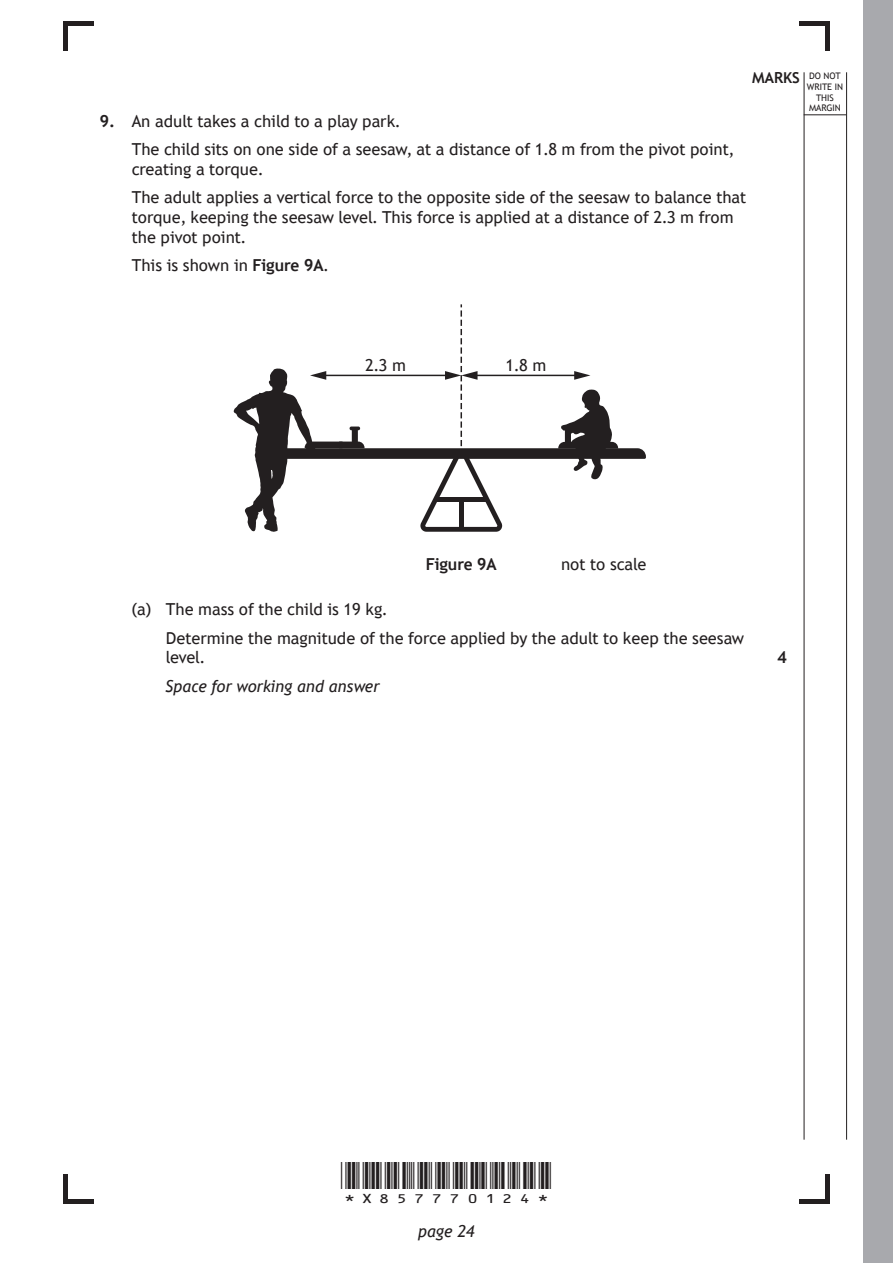
Selectable page text
MARKS _{W}^{D}_{R}^{O}_{I} _{T}^{N}OT
                                                                   E IN
                                                                  THIS
                                                                 MARGIN
9. An adult takes a child to a play park.
   The child sits on one side of a seesaw, at a distance of 1.8 m from the pivot point,
   creating a torque.
   The adult applies a vertical force to the opposite side of the seesaw to balance that
   torque, keeping the seesaw level. This force is applied at a distance of 2.3 m from
   the pivot point.
   This is shown in Figure 9A.

                         2.3 m       1.8 m

                              Figure 9A    not to scale

   (a) The mass of the child is 19 kg.
      Determine the magnitude of the force applied by the adult to keep the seesaw
      level.                                                  4

      Space for working and answer

                      *X857770124*

                             page 24
PDF page 25
Selectable page text
MARKS _{W}^{D}_{R}^{O}_{I} _{T}^{N}OT
                                                                   E IN
                                                                  THIS
                                                                 MARGIN
9. (continued)
   (b) The adult now applies a force that varies continuously with time t. This causes
      the seesaw and child to move up and down. The vertical displacement of the
      child can be approximated to simple harmonic motion (SHM).
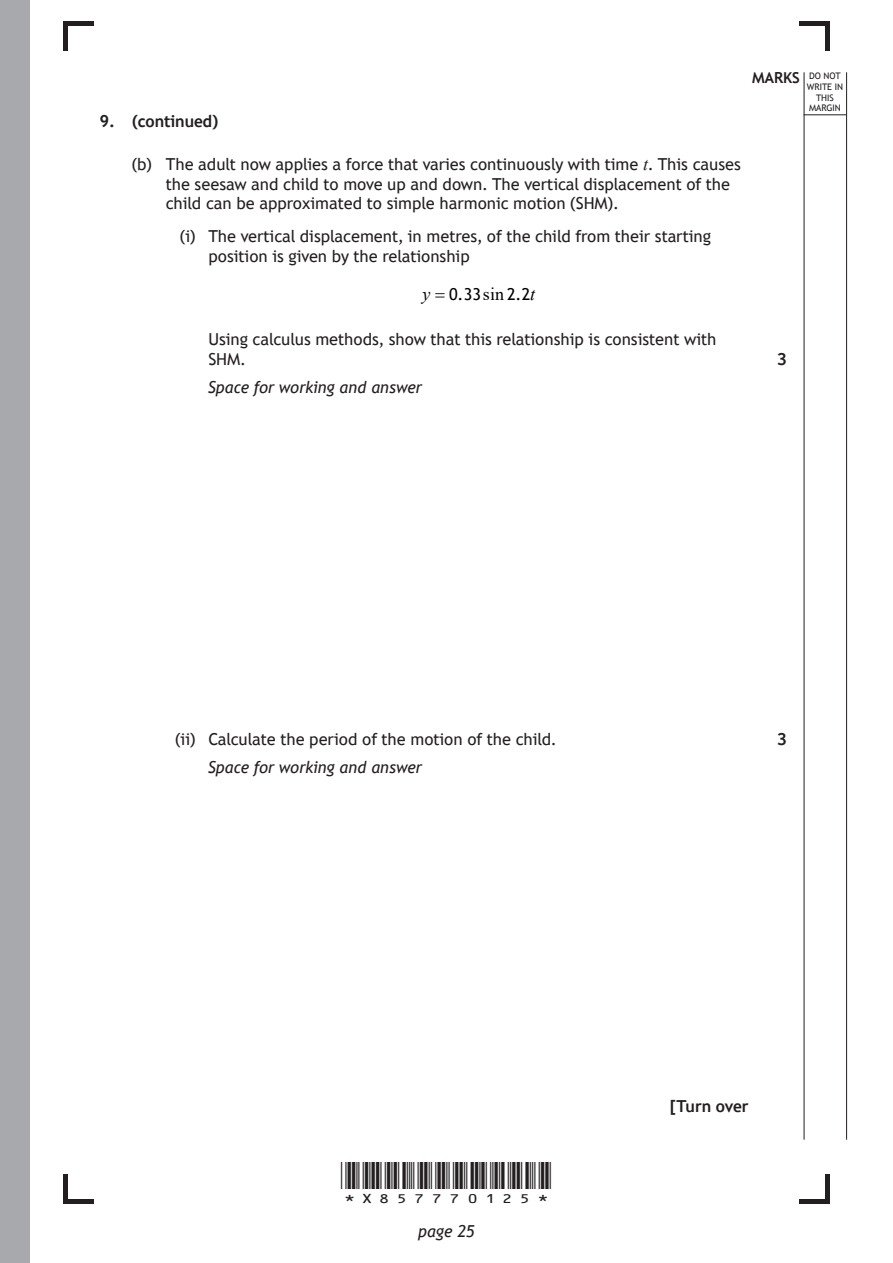
        (i) The vertical displacement, in metres, of the child from their starting
          position is given by the relationship

                              y =0.33sin2.2t

          Using calculus methods, show that this relationship is consistent with
          SHM.                                                3

          Space for working and answer

       (ii) Calculate the period of the motion of the child.  3
          Space for working and answer

                                                     [Turn over

                      *X857770125*

                             page 25
PDF page 26
Selectable page text
MARKS _{W}^{D}_{R}^{O}_{I} _{T}^{N}OT
                                                                   E IN
                                                                  THIS
                                                                 MARGIN
9. (b) (continued)
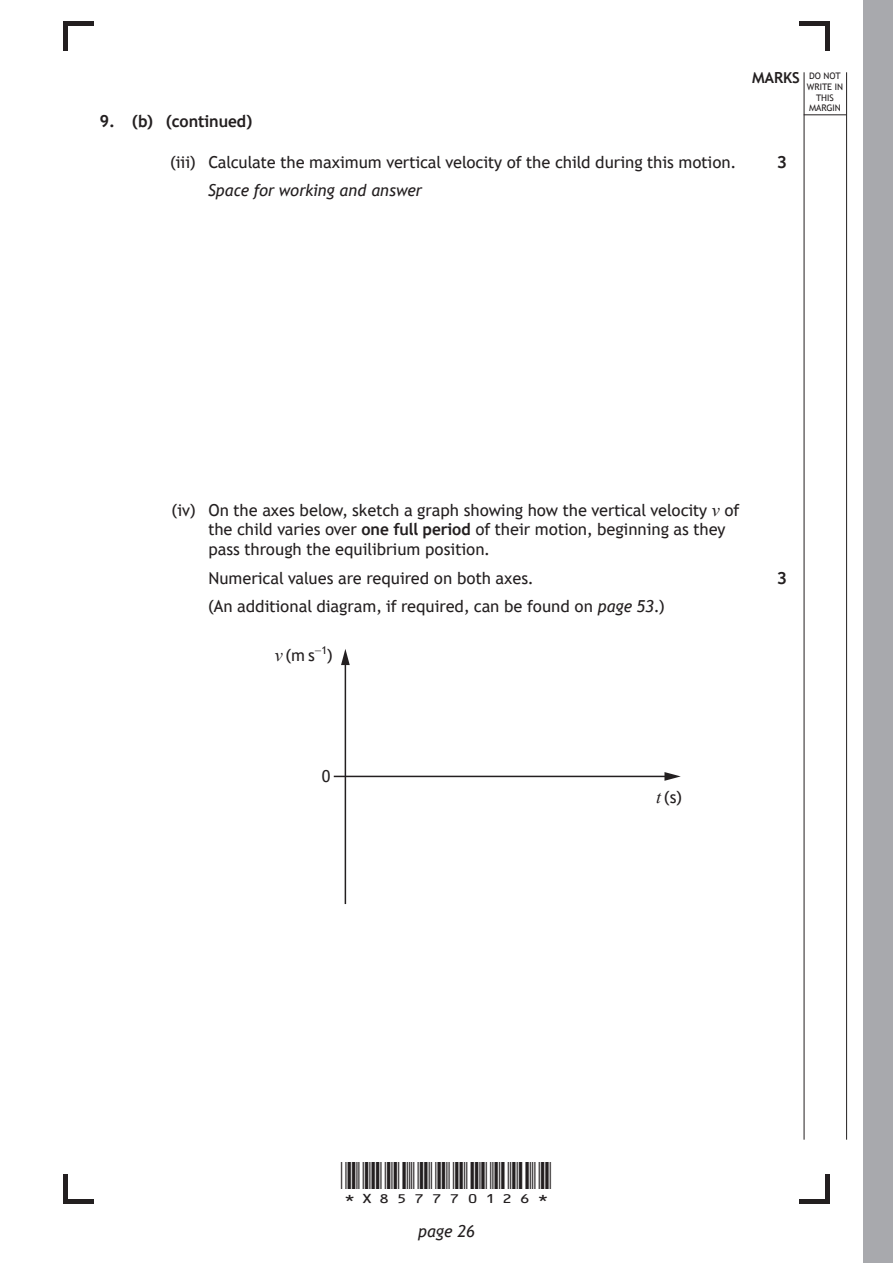
       (iii) Calculate the maximum vertical velocity of the child during this motion. 3
          Space for working and answer

       (iv) On the axes below, sketch a graph showing how the vertical velocity v of
          the child varies over one full period of their motion, beginning as they
          pass through the equilibrium position.
          Numerical values are required on both axes.         3

          (An additional diagram, if required, can be found on page 53.)

                v (m s⁻¹)

                     0

                                                   t (s)

                      *X857770126*

                             page 26
PDF page 27
Selectable page text
MARKS _{W}^{D}_{R}^{O}_{I} _{T}^{N}OT
                                                                   E IN
                                                                  THIS
                                                                 MARGIN
9. (continued)
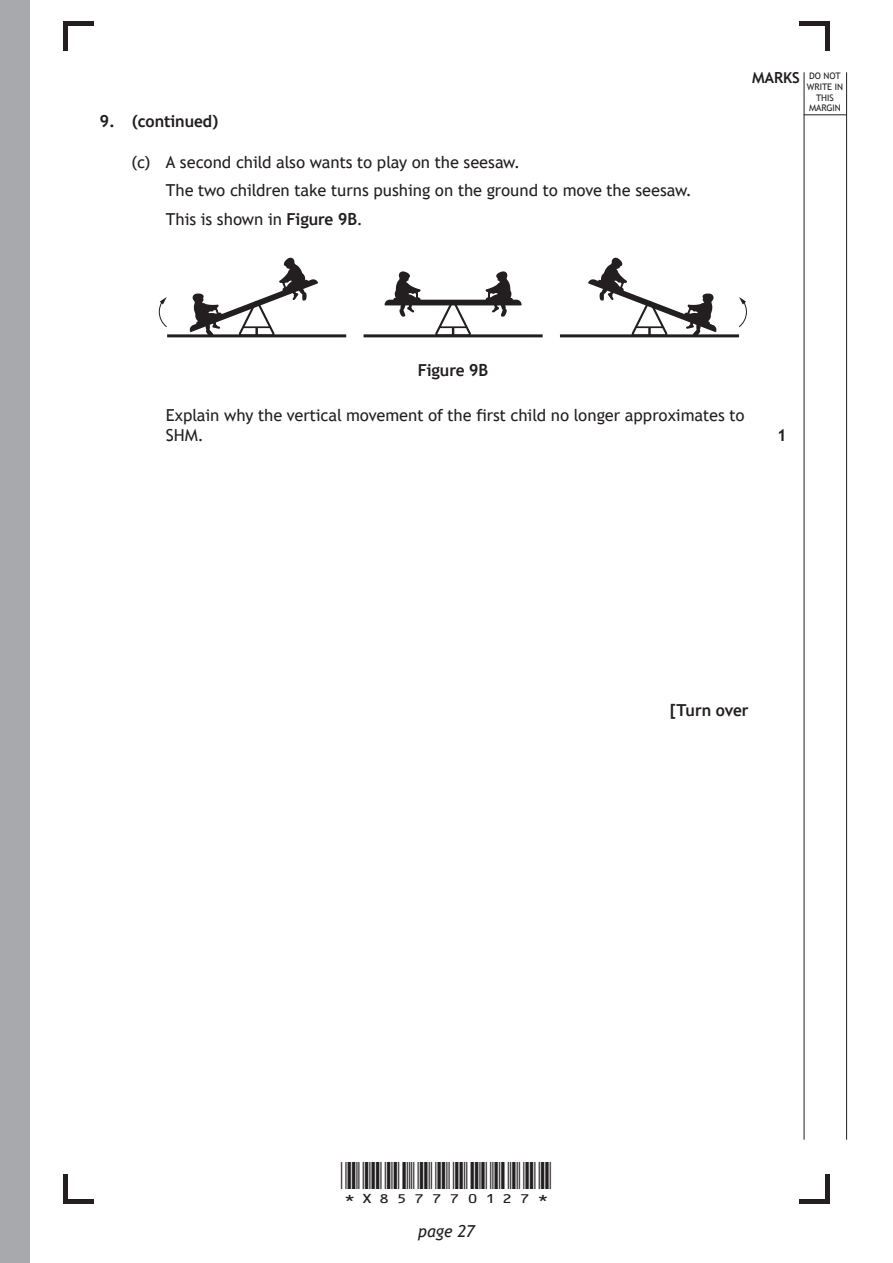
   (c) A second child also wants to play on the seesaw.
      The two children take turns pushing on the ground to move the seesaw.
      This is shown in Figure 9B.

                             Figure 9B

      Explain why the vertical movement of the first child no longer approximates to
      SHM.                                                    1

                                                     [Turn over

                      *X857770127*

                             page 27
PDF page 28
Question 10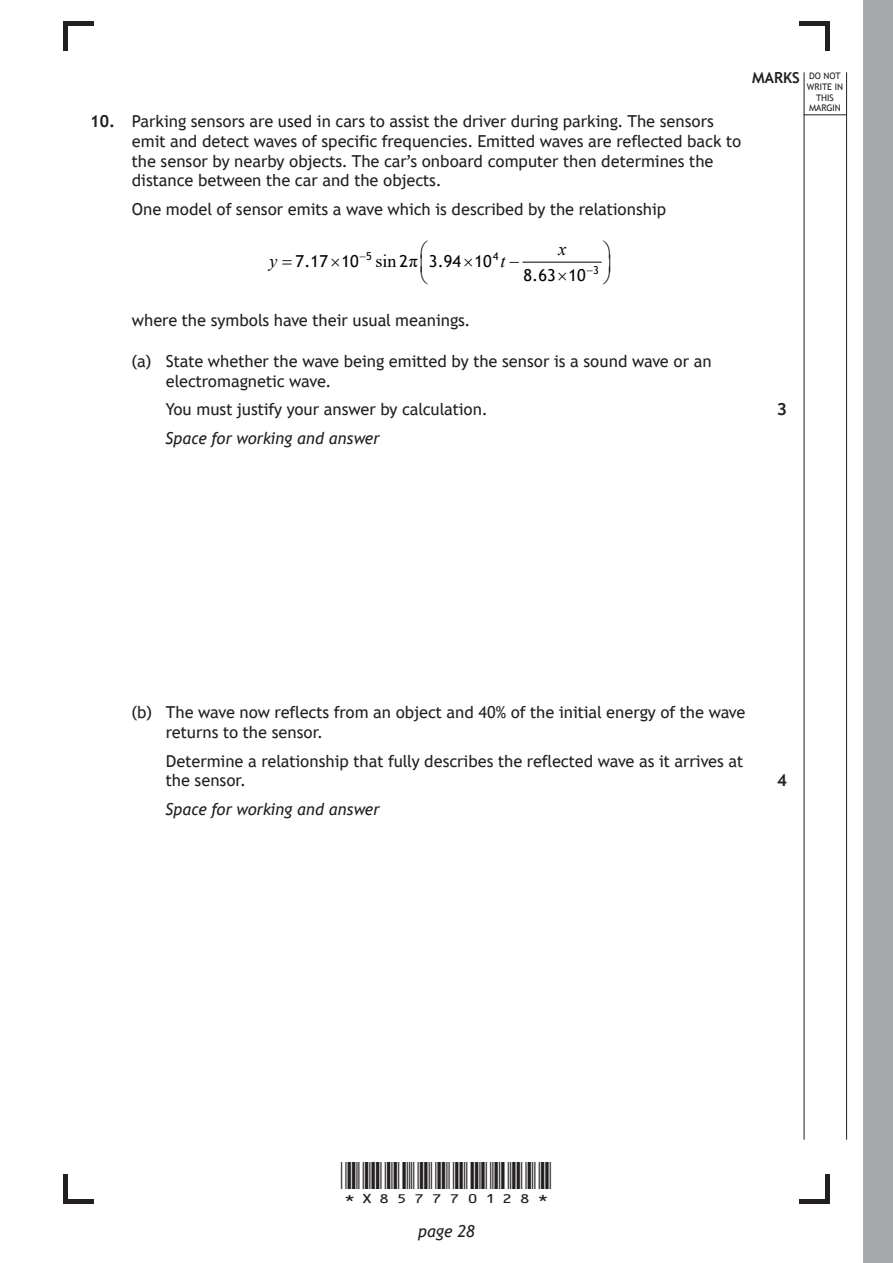
Selectable page text
MARKS _{W}^{D}_{R}^{O}_{I} _{T}^{N}OT
E IN
THIS
MARGIN
10. Parking sensors are used in cars to assist the driver during parking. The sensors
emit and detect waves of specific frequencies. Emitted waves are reflected back to
the sensor by nearby objects. The car’s onboard computer then determines the
distance between the car and the objects.
One model of sensor emits a wave which is described by the relationship
x
y =7.17×10⁻⁵sin2π3.94×10⁴t−
8.63×10⁻³
where the symbols have their usual meanings.
(a) State whether the wave being emitted by the sensor is a sound wave or an
electromagnetic wave.
You must justify your answer by calculation. 3
Space for working and answer
(b) The wave now reflects from an object and 40% of the initial energy of the wave
returns to the sensor.
Determine a relationship that fully describes the reflected wave as it arrives at
the sensor. 4
Space for working and answer
*X857770128*
page 28PDF page 29
Selectable page text
MARKS _{W}^{D}_{R}^{O}_{I} _{T}^{N}OT
                                                                    E IN
                                                                   THIS
                                                                  MARGIN
10. (continued)
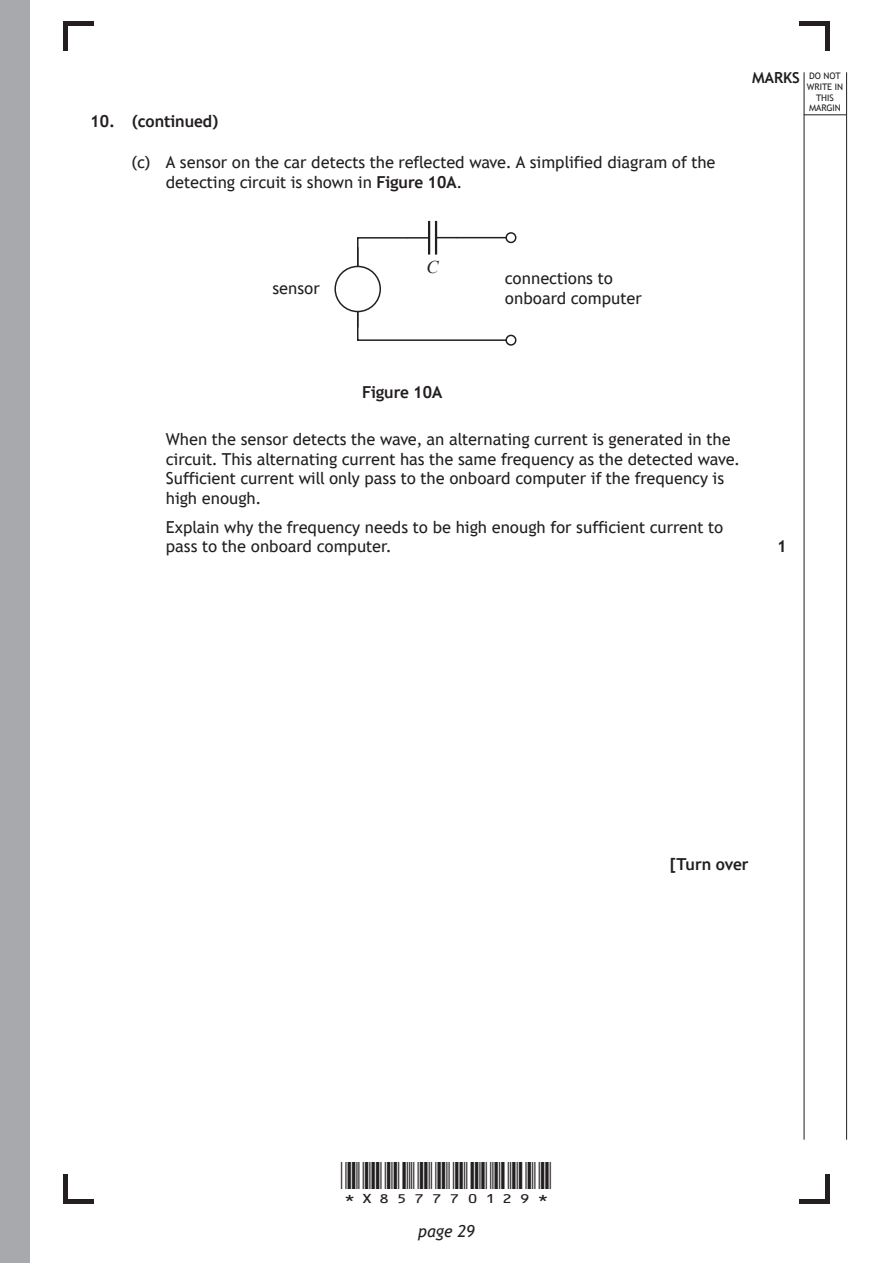
    (c) A sensor on the car detects the reflected wave. A simplified diagram of the
       detecting circuit is shown in Figure 10A.

                               C
                                      connections to
                 sensor
                                      onboard computer

                         Figure 10A

       When the sensor detects the wave, an alternating current is generated in the
       circuit. This alternating current has the same frequency as the detected wave.
       Sufficient current will only pass to the onboard computer if the frequency is
       high enough.

       Explain why the frequency needs to be high enough for sufficient current to
       pass to the onboard computer.                           1

                                                      [Turn over

                       *X857770129*

                              page 29
PDF page 30

Selectable page text
[BLANK PAGE]

DO NOT WRITE ON THIS PAGE

*X857770130*

       page 30
PDF page 31
Question 11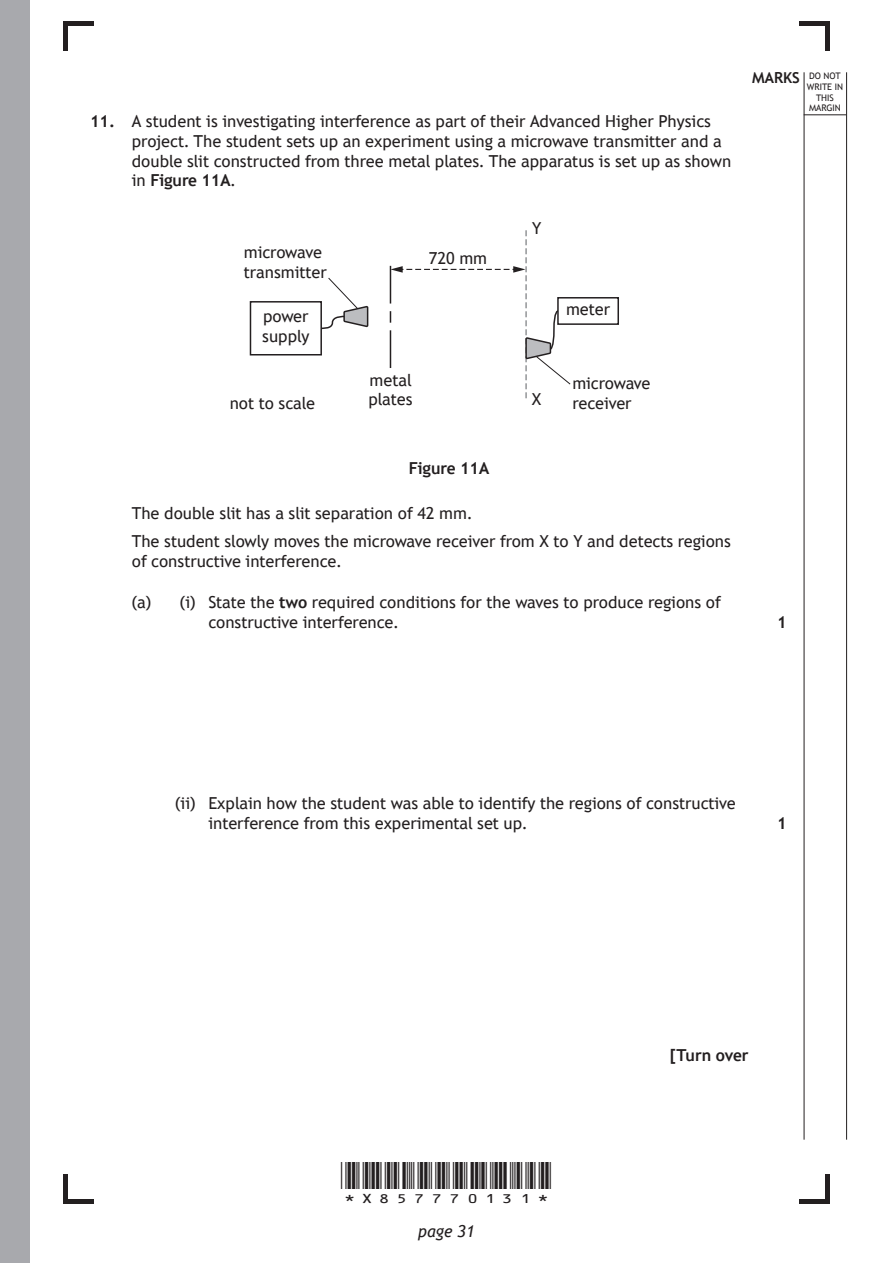
Selectable page text
MARKS _{W}^{D}_{R}^{O}_{I} _{T}^{N}OT
                                                                    E IN
                                                                   THIS
                                                                  MARGIN
11. A student is investigating interference as part of their Advanced Higher Physics
    project. The student sets up an experiment using a microwave transmitter and a
    double slit constructed from three metal plates. The apparatus is set up as shown
    in Figure 11A.
                                         Y
              microwave
                               720 mm
              transmitter
                                            meter
                power
                supply
                          metal              microwave
             not to scale plates         X   receiver

                              Figure 11A

    The double slit has a slit separation of 42 mm.
    The student slowly moves the microwave receiver from X to Y and detects regions
    of constructive interference.

    (a)  (i) State the two required conditions for the waves to produce regions of
           constructive interference.                          1

        (ii) Explain how the student was able to identify the regions of constructive
           interference from this experimental set up.         1

                                                      [Turn over

                       *X857770131*

                              page 31
PDF page 32
Selectable page text
11. (a) (continued)                                          MARKS _{W}^{D}_{R}^{O}_{I} _{T}^{N}OT
                                                                    E IN
                                                                   THIS
                                                                  MARGIN
        (iii) Two adjacent regions of constructive interference are detected. The
           regions are separated by a distance of 470 mm.
           Calculate the wavelength of the microwaves.         3
           Space for working and answer

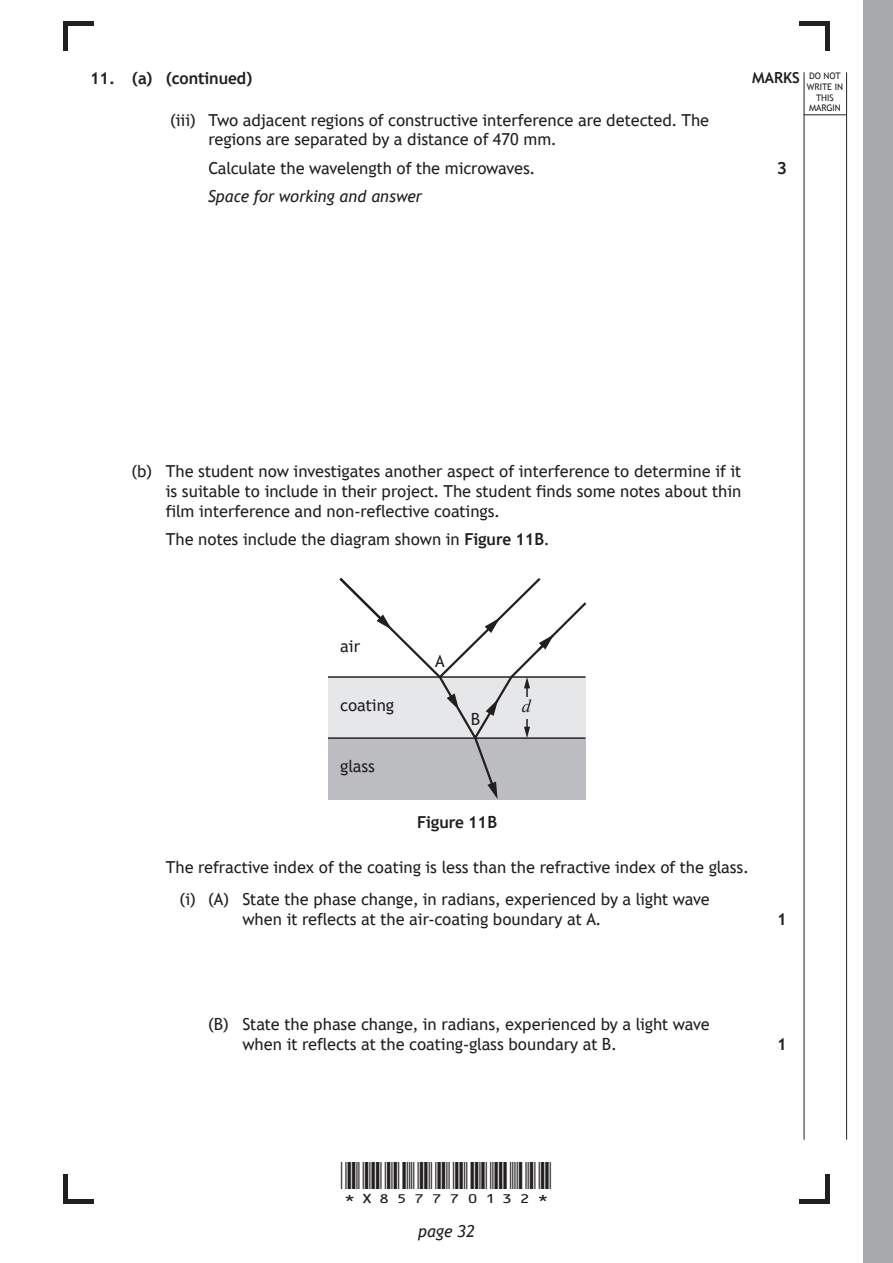
    (b) The student now investigates another aspect of interference to determine if it
       is suitable to include in their project. The student finds some notes about thin
       film interference and non-reflective coatings.
       The notes include the diagram shown in Figure 11B.

                       air
                                A

                       coating          d
                                   B

                       glass

                              Figure 11B

       The refractive index of the coating is less than the refractive index of the glass.

         (i) (A) State the phase change, in radians, experienced by a light wave
              when it reflects at the air-coating boundary at A. 1

           (B) State the phase change, in radians, experienced by a light wave
              when it reflects at the coating-glass boundary at B. 1

                       *X857770132*

                              page 32
PDF page 33
Selectable page text
MARKS _{W}^{D}_{R}^{O}_{I} _{T}^{N}OT
                                                                    E IN
                                                                   THIS
                                                                  MARGIN
11. (b) (continued)
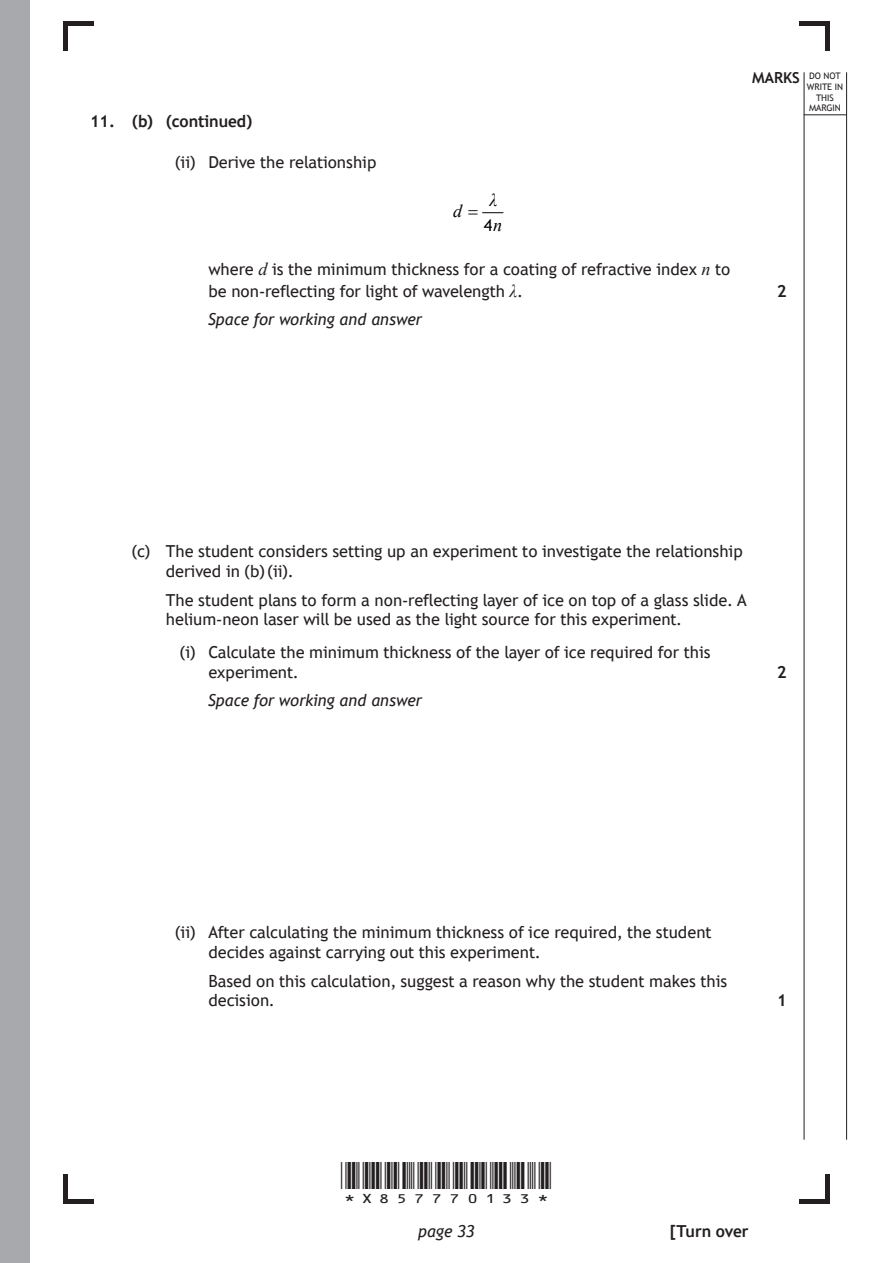
        (ii) Derive the relationship
                                     λ
                                  d =
                                    4n
           where d is the minimum thickness for a coating of refractive index n to

           be non-reflecting for light of wavelength λ.        2
           Space for working and answer

    (c) The student considers setting up an experiment to investigate the relationship
       derived in (b) (ii).
       The student plans to form a non-reflecting layer of ice on top of a glass slide. A
       helium-neon laser will be used as the light source for this experiment.

         (i) Calculate the minimum thickness of the layer of ice required for this
           experiment.                                         2

           Space for working and answer

        (ii) After calculating the minimum thickness of ice required, the student
           decides against carrying out this experiment.

           Based on this calculation, suggest a reason why the student makes this
           decision.                                           1

                       *X857770133*

                              page 33                 [Turn over
PDF page 34
Question 12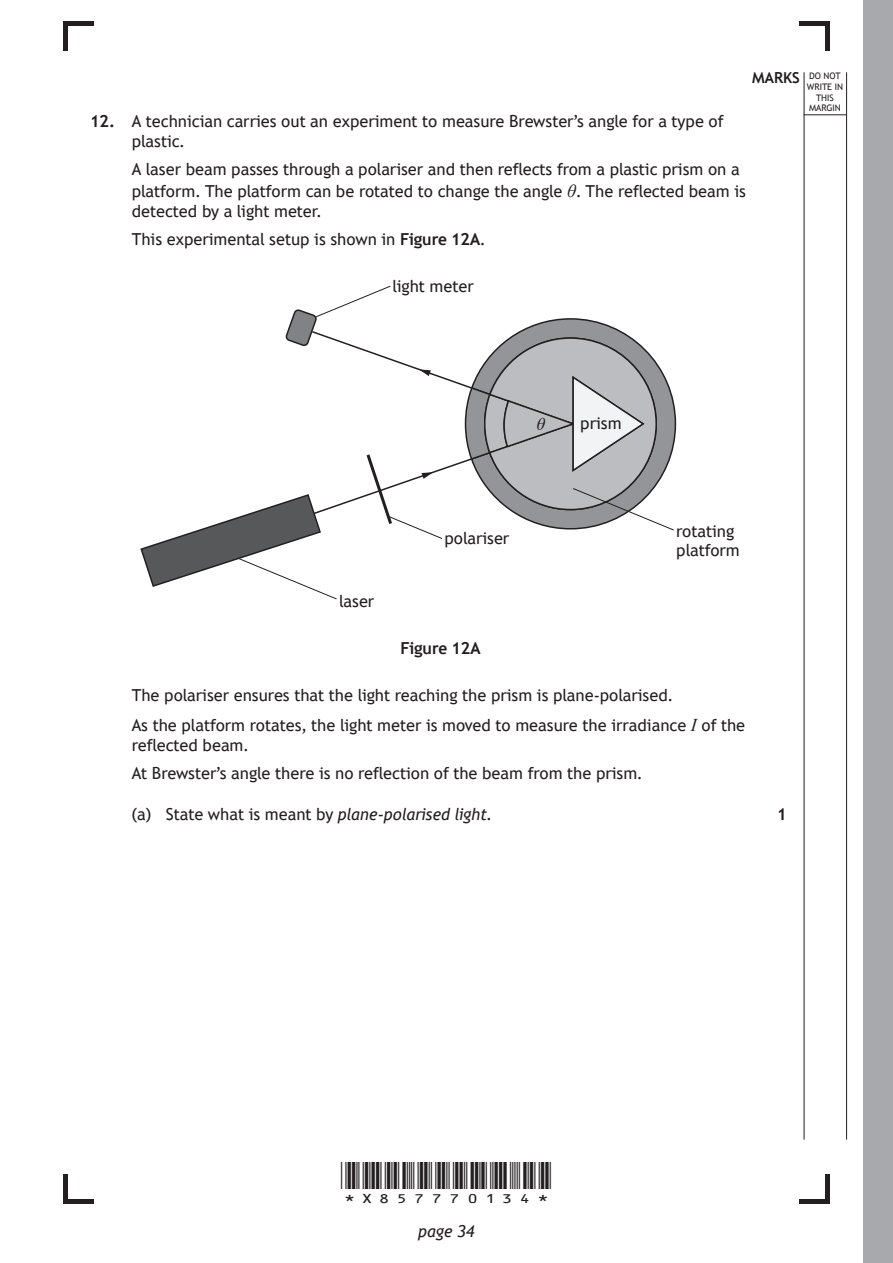
Selectable page text
MARKS _{W}^{D}_{R}^{O}_{I} _{T}^{N}OT
                                                                    E IN
                                                                   THIS
                                                                  MARGIN
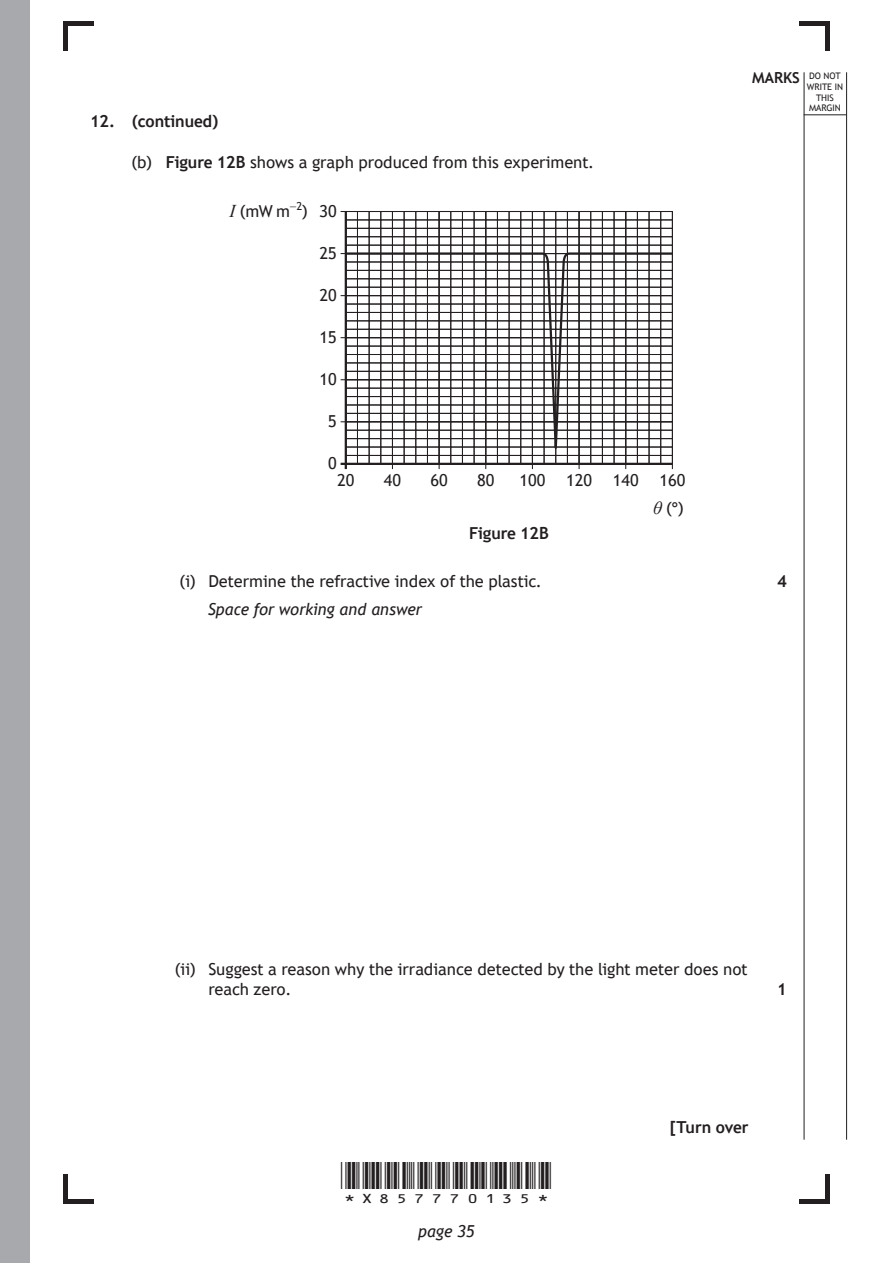
12. A technician carries out an experiment to measure Brewster’s angle for a type of
    plastic.
    A laser beam passes through a polariser and then reflects from a plastic prism on a
    platform. The platform can be rotated to change the angle θ. The reflected beam is
    detected by a light meter.
    This experimental setup is shown in Figure 12A.
                            light meter

                                         θ   prism

                                                      rotating
                                 polariser
                                                      platform
                       laser

                             Figure 12A

    The polariser ensures that the light reaching the prism is plane-polarised.

    As the platform rotates, the light meter is moved to measure the irradiance I of the
    reflected beam.
    At Brewster’s angle there is no reflection of the beam from the prism.

    (a) State what is meant by plane‑polarised light.          1

                       *X857770134*

                              page 34
PDF page 35
Selectable page text
MARKS _{W}^{D}_{R}^{O}_{I} _{T}^{N}OT
                                                                    E IN
                                                                   THIS
                                                                  MARGIN
12. (continued)
    (b) Figure 12B shows a graph produced from this experiment.
             I (mW m⁻²) 30

                     25

                     20

                     15

                     10

                      5

                      0
                       20  40   60  80  100 120 140  160

                                                    θ (°)
                                   Figure 12B

         (i) Determine the refractive index of the plastic.    4

           Space for working and answer

        (ii) Suggest a reason why the irradiance detected by the light meter does not
           reach zero.                                         1

                                                      [Turn over

                       *X857770135*

                              page 35
PDF page 36

Selectable page text
[BLANK PAGE]

DO NOT WRITE ON THIS PAGE

*X857770136*

       page 36
PDF page 37
Question 13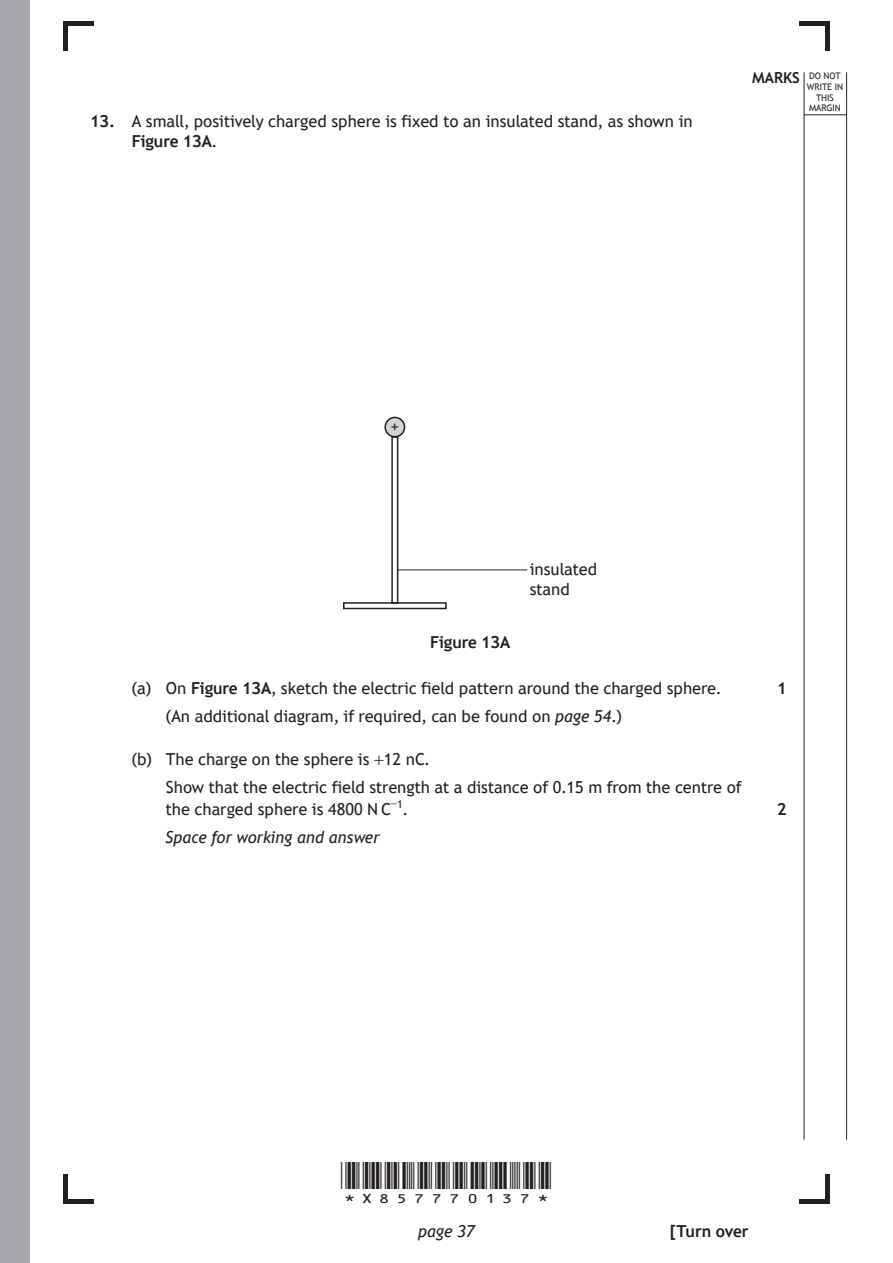
Selectable page text
MARKS _{W}^{D}_{R}^{O}_{I} _{T}^{N}OT
                                                                    E IN
                                                                   THIS
                                                                  MARGIN
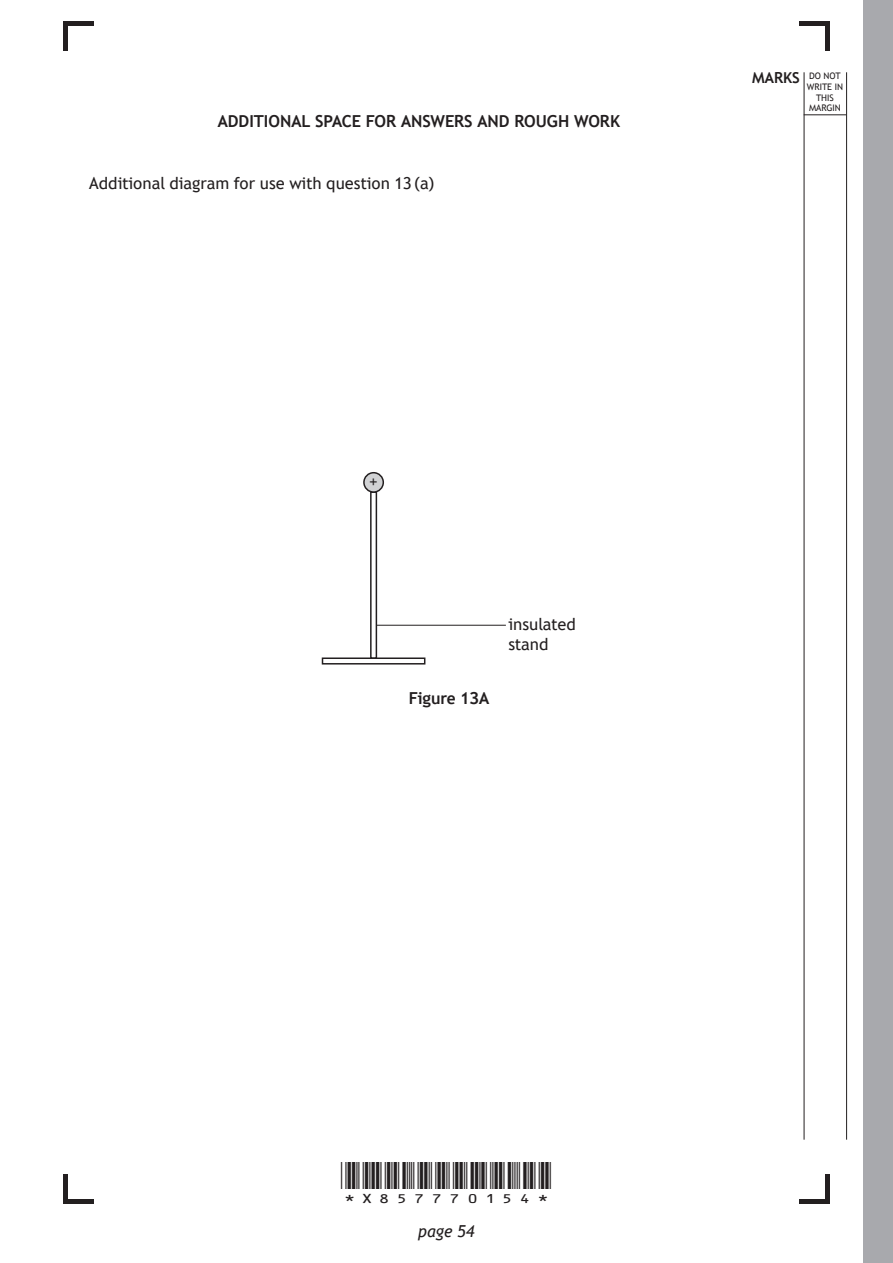
13. A small, positively charged sphere is fixed to an insulated stand, as shown in
    Figure 13A.

                            +

                                         insulated
                                         stand

                                Figure 13A

    (a) On Figure 13A, sketch the electric field pattern around the charged sphere. 1
       (An additional diagram, if required, can be found on page 54.)

    (b) The charge on the sphere is +12 nC.
       Show that the electric field strength at a distance of 0.15 m from the centre of
       the charged sphere is 4800 N C⁻¹.                       2

       Space for working and answer

                       *X857770137*

                              page 37                 [Turn over
PDF page 38
Selectable page text
MARKS _{W}^{D}_{R}^{O}_{I} _{T}^{N}OT
                                                                    E IN
                                                                   THIS
                                                                  MARGIN
13. (continued)
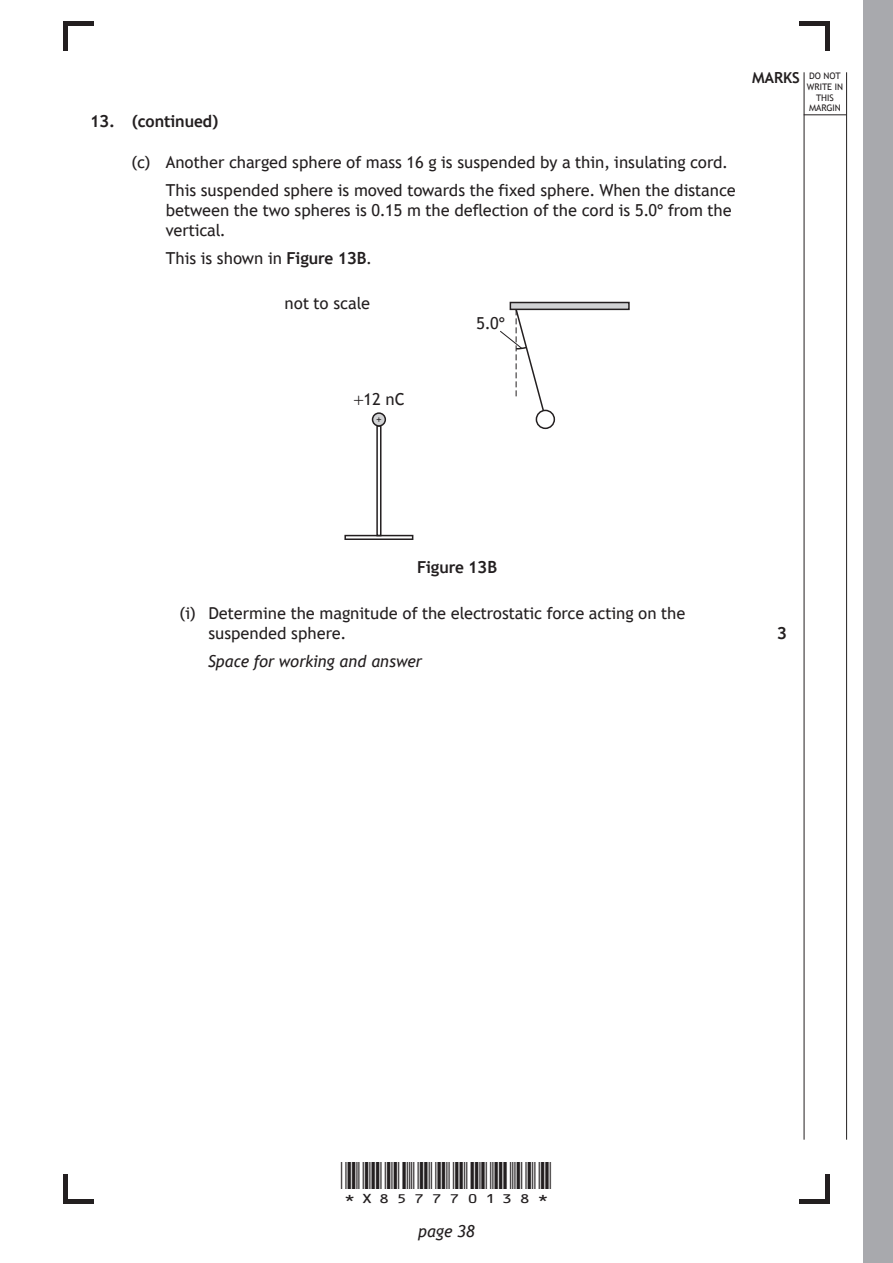
    (c) Another charged sphere of mass 16 g is suspended by a thin, insulating cord.
       This suspended sphere is moved towards the fixed sphere. When the distance
       between the two spheres is 0.15 m the deflection of the cord is 5.0° from the
       vertical.
       This is shown in Figure 13B.

                  not to scale
                                    5.0°

                         +12 nC
                           +

                              Figure 13B

         (i) Determine the magnitude of the electrostatic force acting on the
           suspended sphere.                                   3

           Space for working and answer

                       *X857770138*

                              page 38
PDF page 39
Selectable page text
MARKS _{W}^{D}_{R}^{O}_{I} _{T}^{N}OT
                                                                    E IN
                                                                   THIS
                                                                  MARGIN
13. (c) (continued)
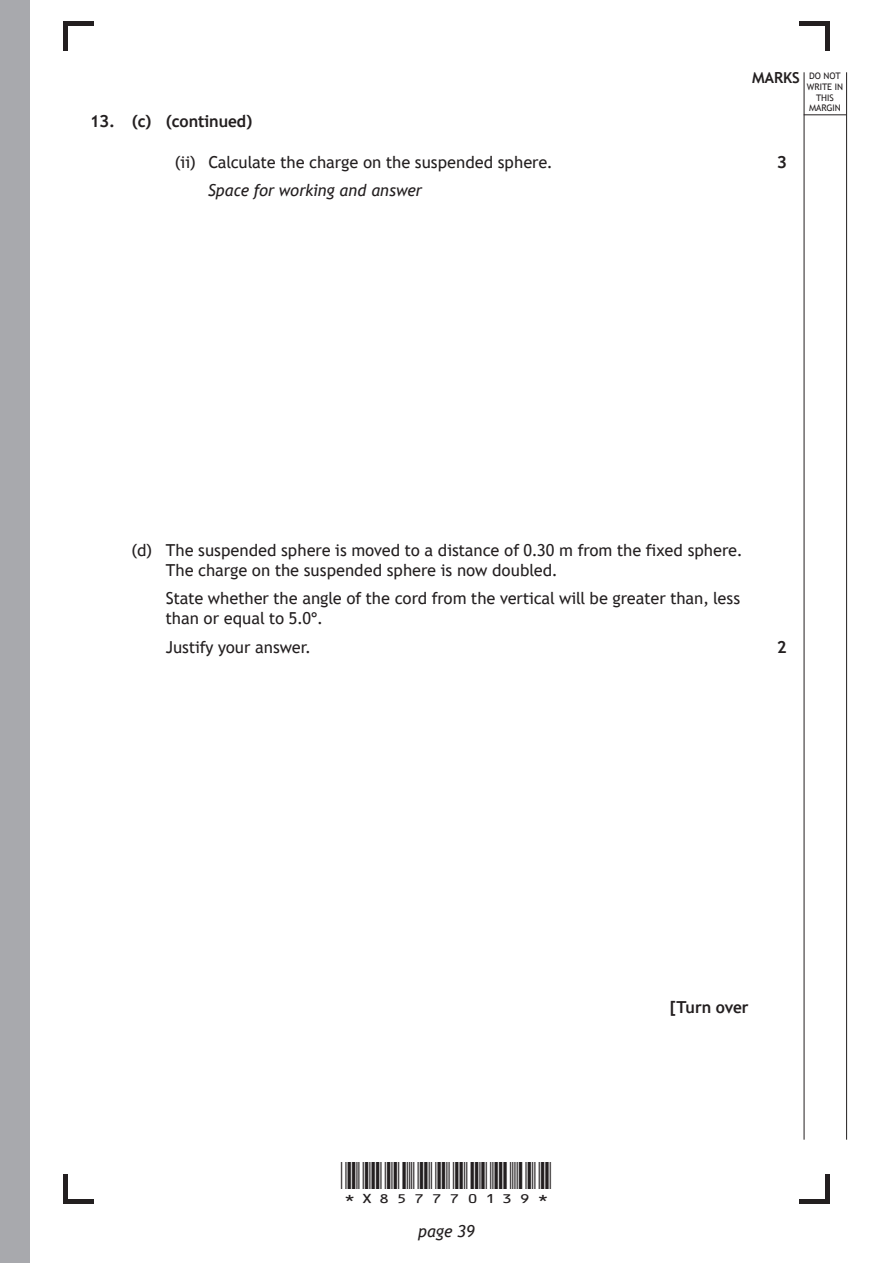
        (ii) Calculate the charge on the suspended sphere.     3
           Space for working and answer

    (d) The suspended sphere is moved to a distance of 0.30 m from the fixed sphere.
       The charge on the suspended sphere is now doubled.
       State whether the angle of the cord from the vertical will be greater than, less
       than or equal to 5.0°.

       Justify your answer.                                    2

                                                      [Turn over

                       *X857770139*

                              page 39
PDF page 40
Question 14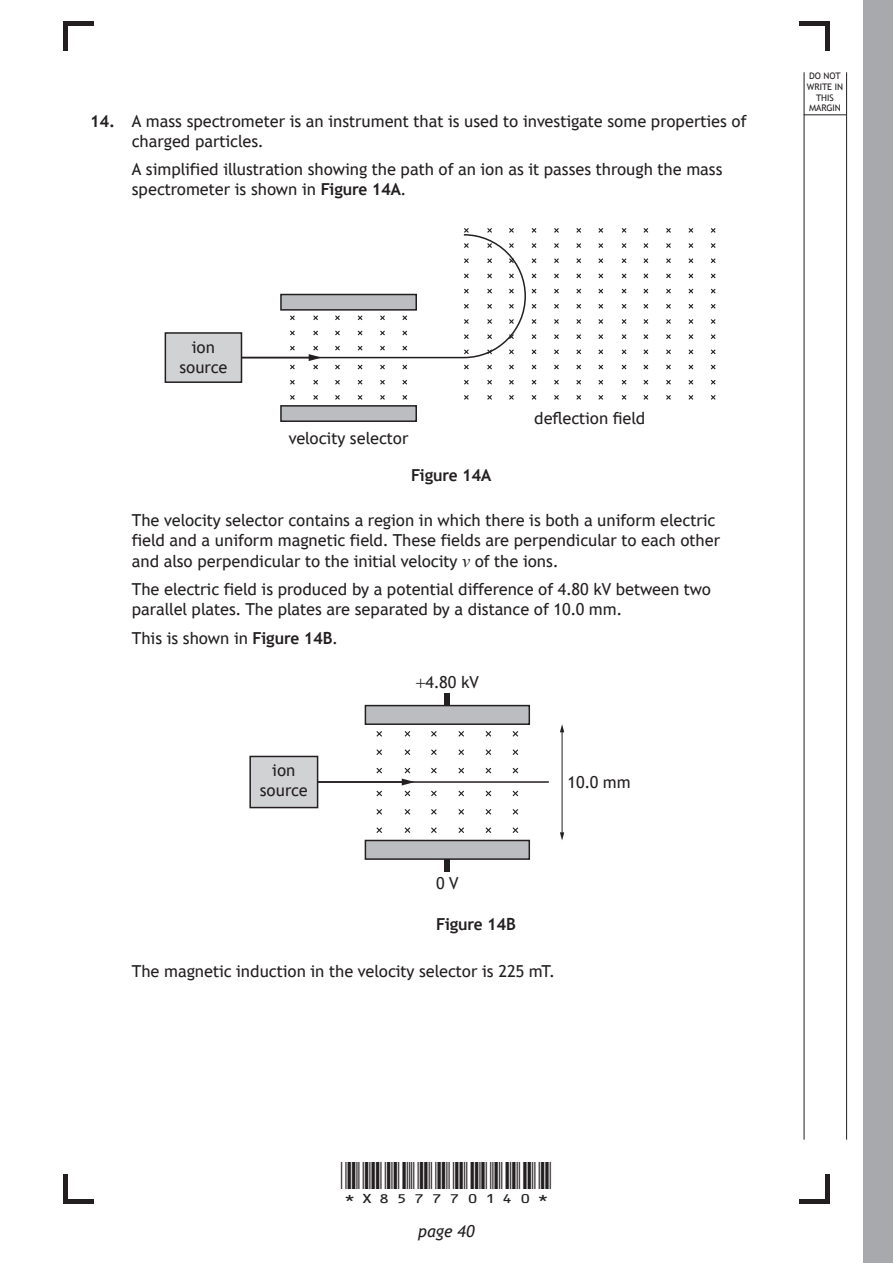
Selectable page text
DO NOT
                                                                  WRITE IN
                                                                   THIS
                                                                  MARGIN
14. A mass spectrometer is an instrument that is used to investigate some properties of
    charged particles.
    A simplified illustration showing the path of an ion as it passes through the mass
    spectrometer is shown in Figure 14A.

          ion
        source

                                         deflection field
                   velocity selector

                              Figure 14A

    The velocity selector contains a region in which there is both a uniform electric
    field and a uniform magnetic field. These fields are perpendicular to each other
    and also perpendicular to the initial velocity v of the ions.

    The electric field is produced by a potential difference of 4.80 kV between two
    parallel plates. The plates are separated by a distance of 10.0 mm.
    This is shown in Figure 14B.

                              +4.80 kV

                 ion
                                            10.0 mm
                source

                                0 V

                                Figure 14B

    The magnetic induction in the velocity selector is 225 mT.

                       *X857770140*

                              page 40
PDF page 41
Selectable page text
MARKS _{W}^{D}_{R}^{O}_{I} _{T}^{N}OT
                                                                    E IN
                                                                   THIS
                                                                  MARGIN
14. (continued)
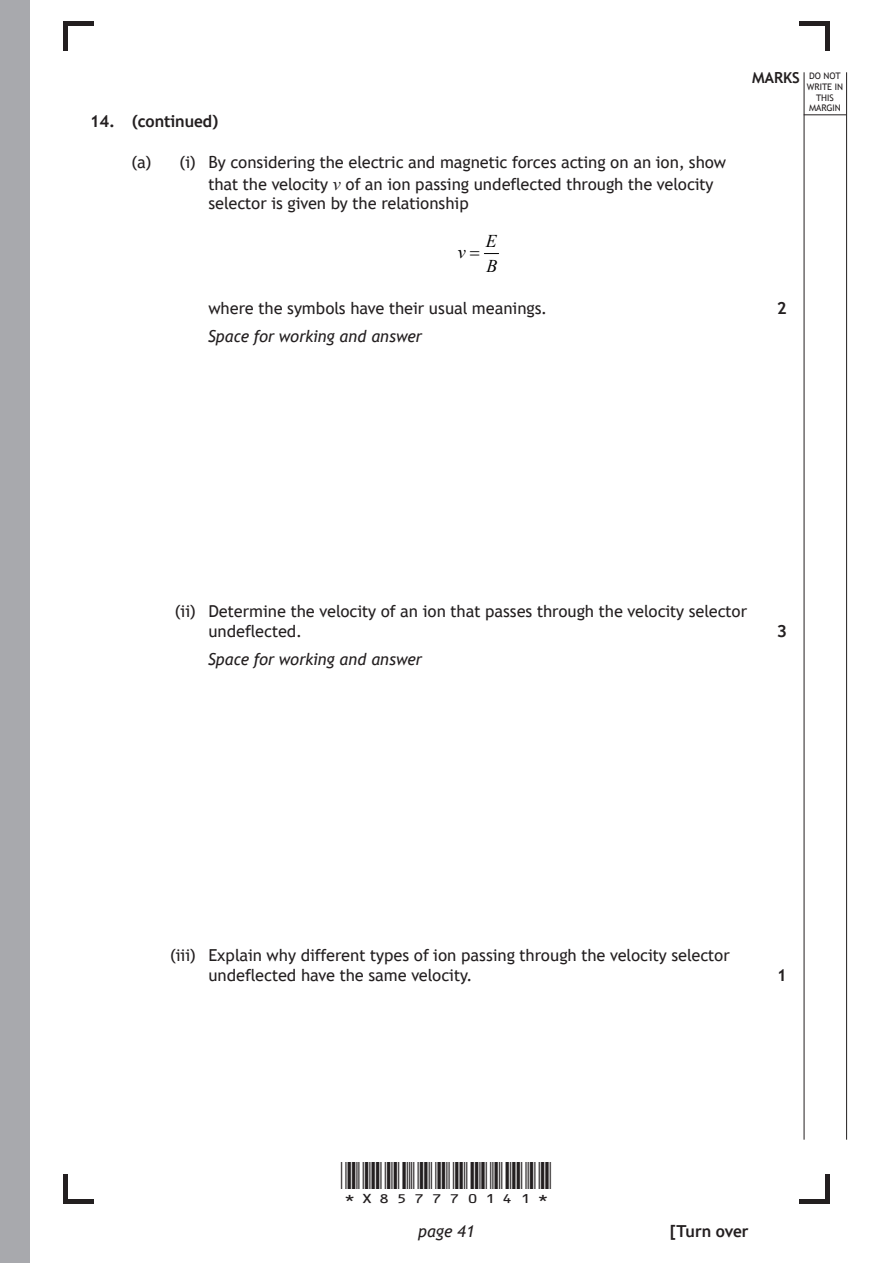
    (a)  (i) By considering the electric and magnetic forces acting on an ion, show
           that the velocity v of an ion passing undeflected through the velocity
           selector is given by the relationship
                                     E
                                  v=
                                     B
           where the symbols have their usual meanings.        2

           Space for working and answer

        (ii) Determine the velocity of an ion that passes through the velocity selector
           undeflected.                                        3
           Space for working and answer

        (iii) Explain why different types of ion passing through the velocity selector
           undeflected have the same velocity.                 1

                       *X857770141*

                              page 41                 [Turn over
PDF page 42
Selectable page text
DO NOT
                                                                  WRITE IN
                                                                   THIS
                                                                  MARGIN
14. (continued)
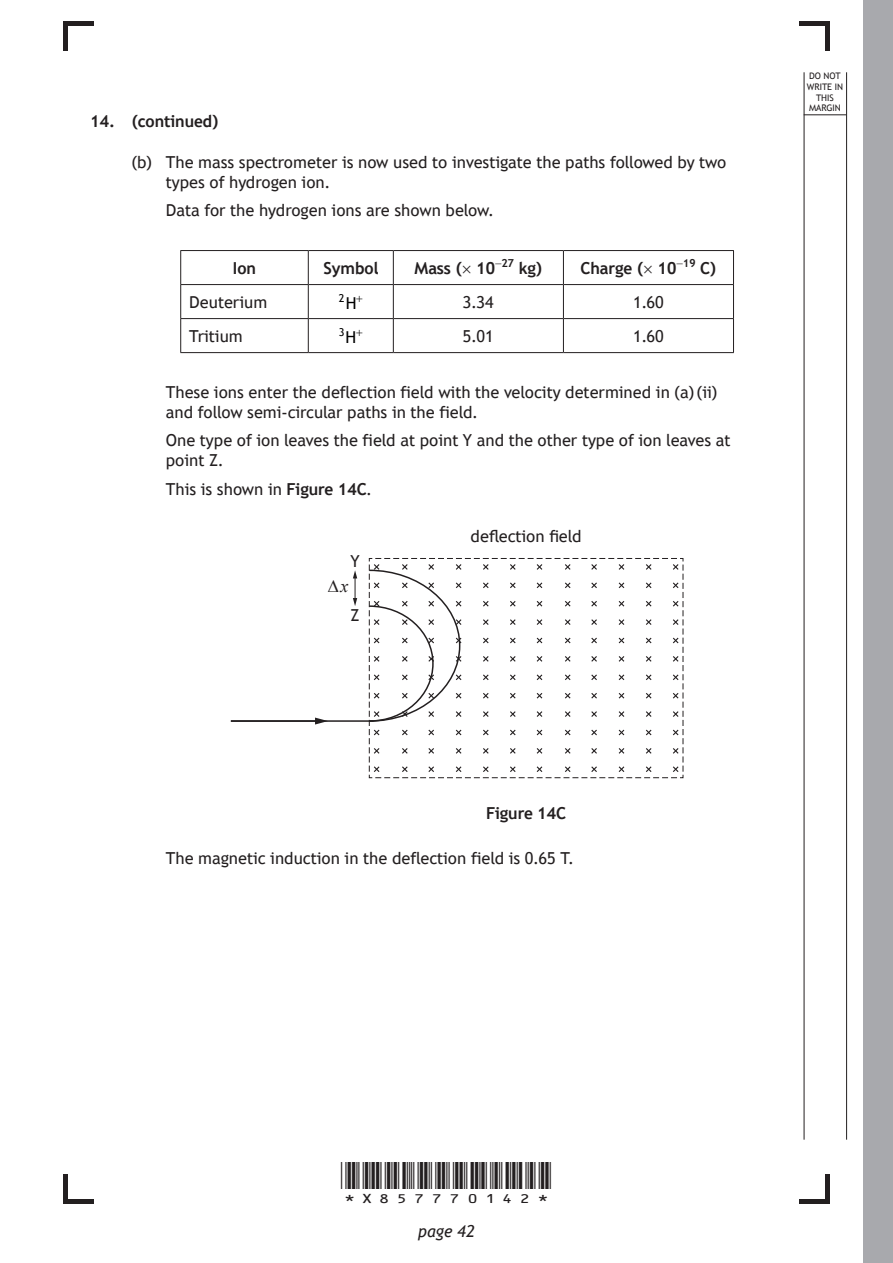
    (b) The mass spectrometer is now used to investigate the paths followed by two
       types of hydrogen ion.
       Data for the hydrogen ions are shown below.

             Ion      Symbol  Mass (× 10⁻²⁷ kg) Charge (× 10⁻¹⁹ C)

         Deuterium     2H⁺         3.34           1.60

         Tritium       3H⁺         5.01           1.60

       These ions enter the deflection field with the velocity determined in (a) (ii)
       and follow semi-circular paths in the field.
       One type of ion leaves the field at point Y and the other type of ion leaves at
       point Z.

       This is shown in Figure 14C.

                                   deflection field
                        Y

                      ∆ x
                        Z

                                     Figure 14C

       The magnetic induction in the deflection field is 0.65 T.

                       *X857770142*

                              page 42
PDF page 43
Selectable page text
MARKS _{W}^{D}_{R}^{O}_{I} _{T}^{N}OT
                                                                    E IN
                                                                   THIS
                                                                  MARGIN
14. (b) (continued)
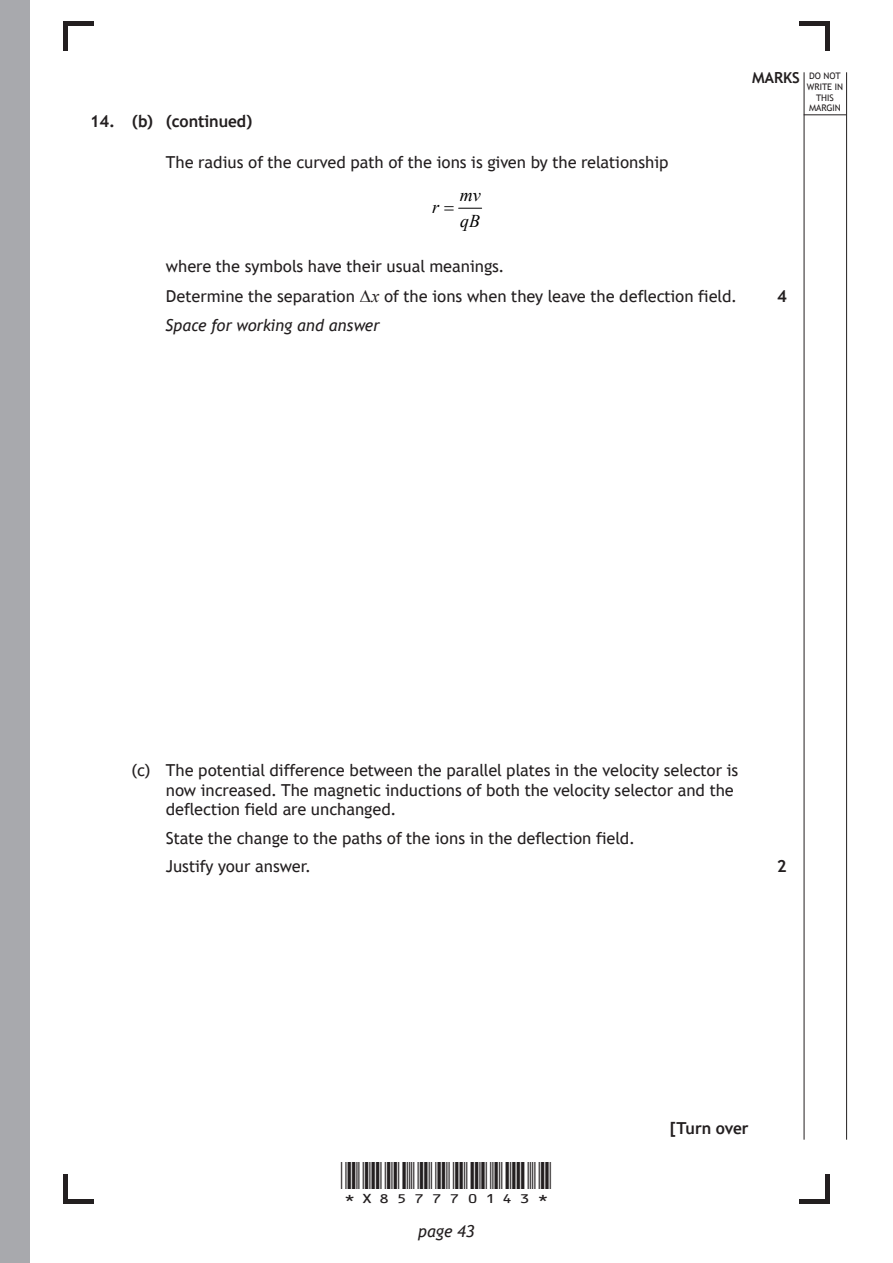
       The radius of the curved path of the ions is given by the relationship
                                  mv
                                r =
                                  qB
       where the symbols have their usual meanings.

       Determine the separation ∆ x of the ions when they leave the deflection field. 4
       Space for working and answer

    (c) The potential difference between the parallel plates in the velocity selector is
       now increased. The magnetic inductions of both the velocity selector and the
       deflection field are unchanged.

       State the change to the paths of the ions in the deflection field.
       Justify your answer.                                    2

                                                      [Turn over

                       *X857770143*

                              page 43
PDF page 44
Question 15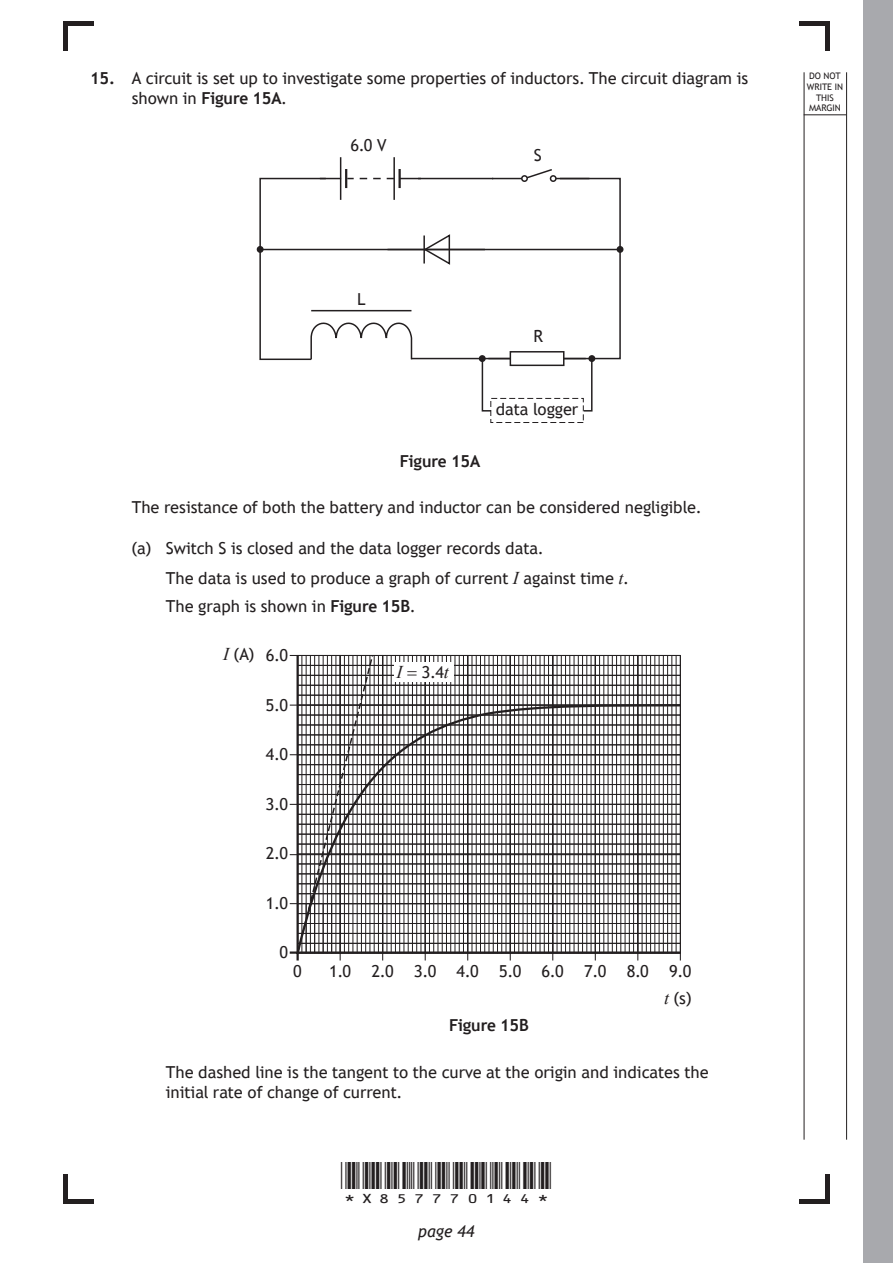
Selectable page text
15. A circuit is set up to investigate some properties of inductors. The circuit diagram is DO NOT
                                                                  WRITE IN
    shown in Figure 15A.                                           THIS
                                                                  MARGIN
                        6.0 V
                                         S

                         L

                                         R

                                      data logger

                             Figure 15A

    The resistance of both the battery and inductor can be considered negligible.

    (a) Switch S is closed and the data logger records data.
       The data is used to produce a graph of current I against time t.

       The graph is shown in Figure 15B.

             I (A) 6.0
                            I = 3.4t

                5.0

                4.0

                3.0

                2.0

                1.0

                  0
                   0  1.0 2.0 3.0 4.0 5.0 6.0 7.0 8.0 9.0

                                                     t (s)
                                 Figure 15B

       The dashed line is the tangent to the curve at the origin and indicates the
       initial rate of change of current.

                       *X857770144*

                              page 44
PDF page 45
Selectable page text
MARKS _{W}^{D}_{R}^{O}_{I} _{T}^{N}OT
                                                                    E IN
                                                                   THIS
                                                                  MARGIN
15. (a) (continued)
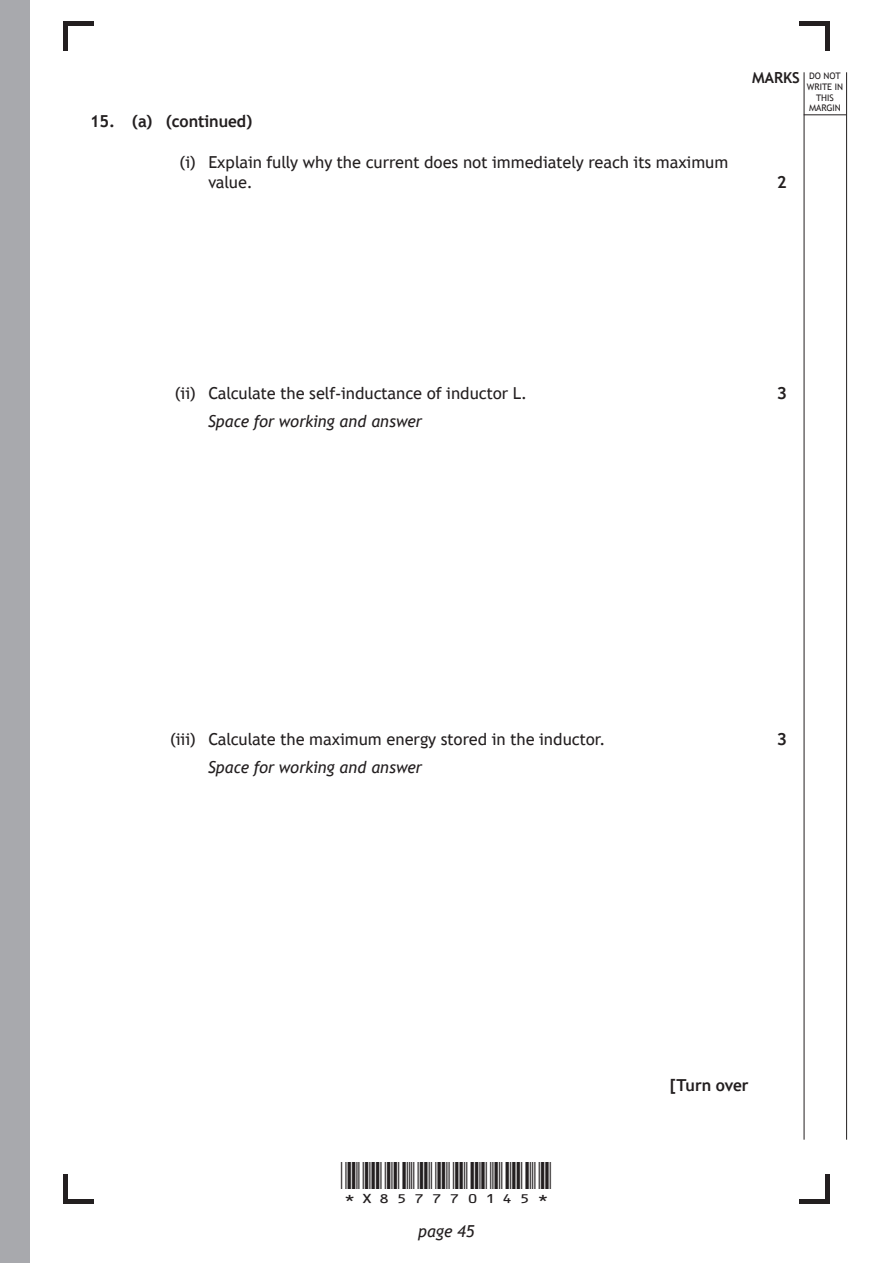
         (i) Explain fully why the current does not immediately reach its maximum
           value.                                              2

        (ii) Calculate the self-inductance of inductor L.      3
           Space for working and answer

        (iii) Calculate the maximum energy stored in the inductor. 3
           Space for working and answer

                                                      [Turn over

                       *X857770145*

                              page 45
PDF page 46
Selectable page text
MARKS _{W}^{D}_{R}^{O}_{I} _{T}^{N}OT
                                                                    E IN
                                                                   THIS
                                                                  MARGIN
15. (continued)
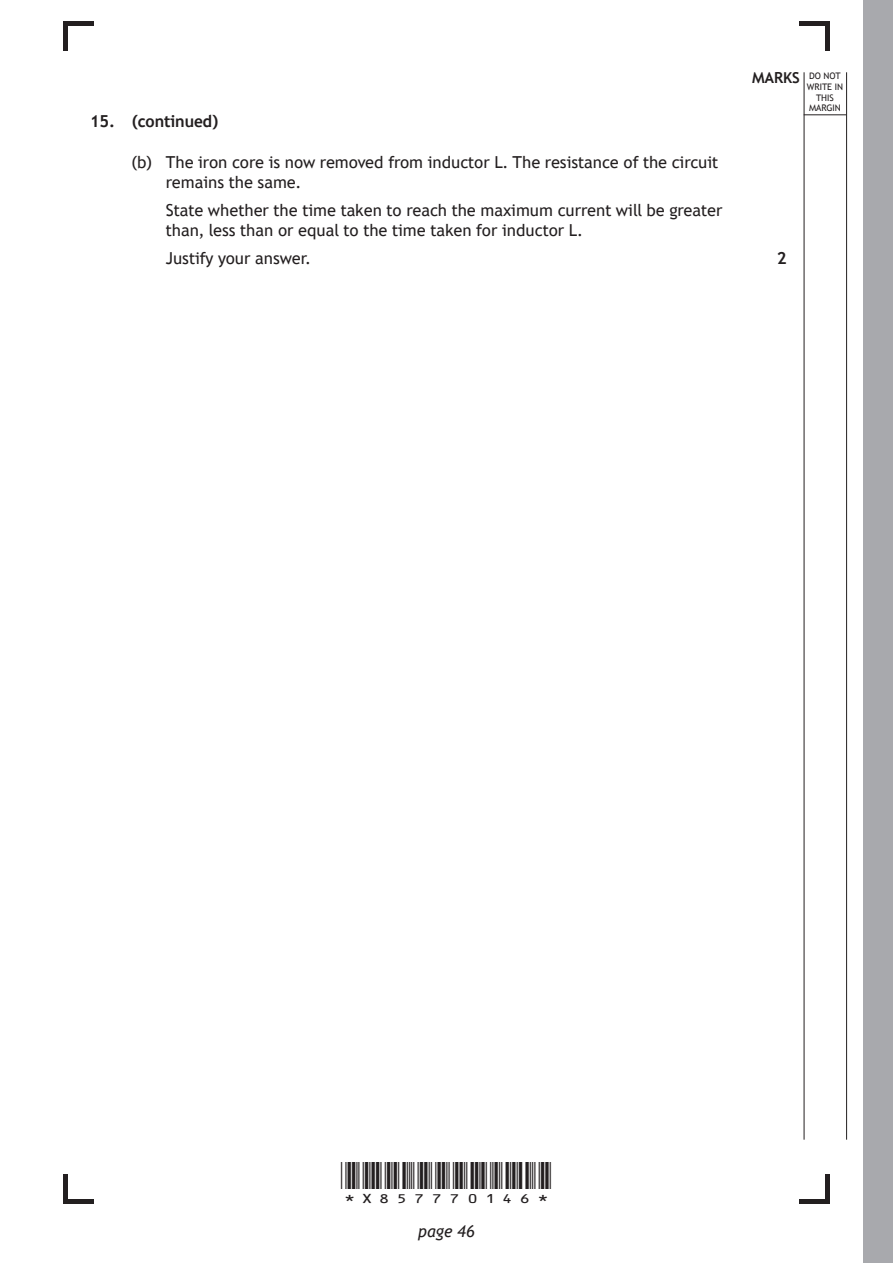
    (b) The iron core is now removed from inductor L. The resistance of the circuit
       remains the same.
       State whether the time taken to reach the maximum current will be greater
       than, less than or equal to the time taken for inductor L.
       Justify your answer.                                    2

                       *X857770146*

                              page 46
PDF page 47
Selectable page text
MARKS _{W}^{D}_{R}^{O}_{I} _{T}^{N}OT
                                                                    E IN
                                                                   THIS
                                                                  MARGIN
15. (continued)
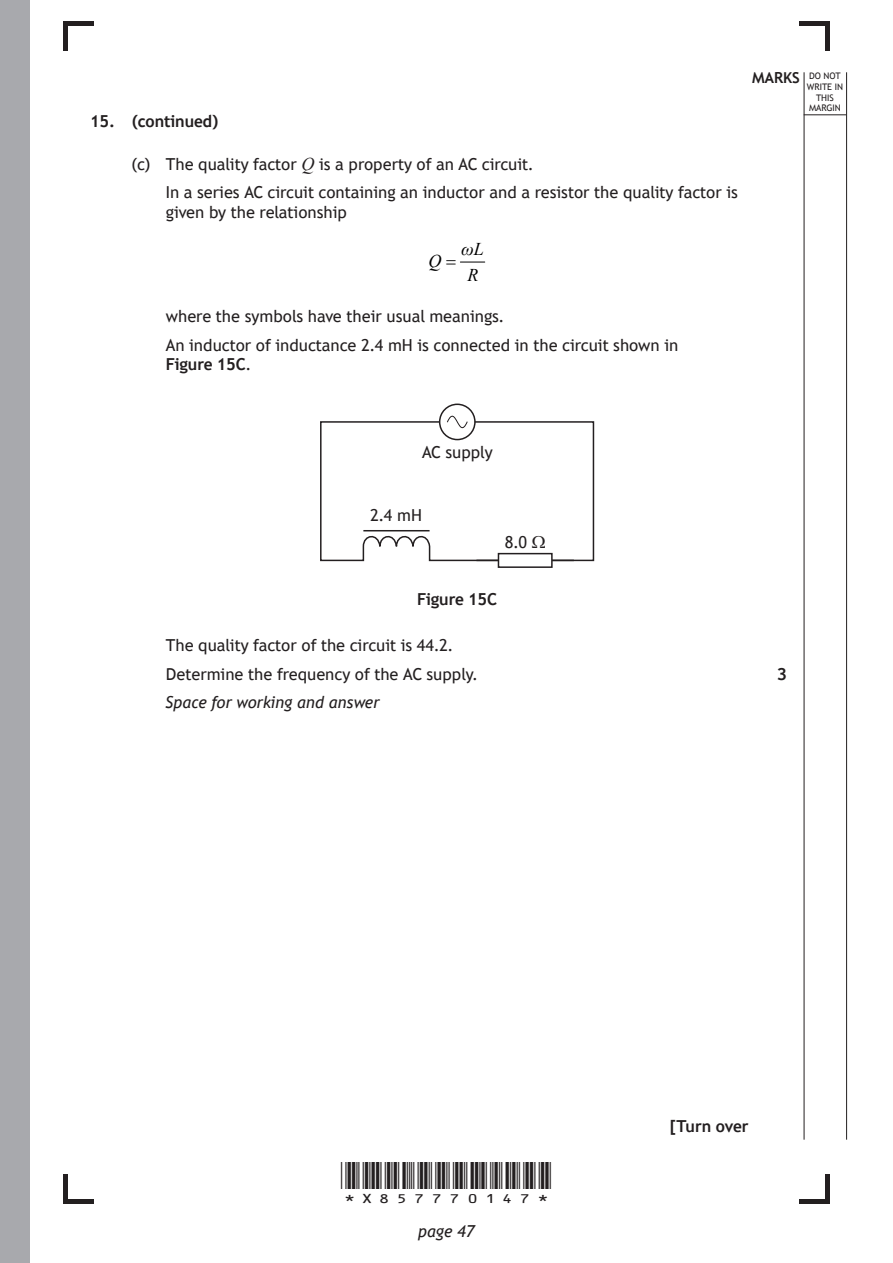
    (c) The quality factor Q is a property of an AC circuit.
       In a series AC circuit containing an inductor and a resistor the quality factor is
       given by the relationship
                                  ωL
                               Q=
                                   R

       where the symbols have their usual meanings.
       An inductor of inductance 2.4 mH is connected in the circuit shown in
       Figure 15C.

                               AC supply

                          2.4 mH
                                      8.0 Ω

                              Figure 15C

       The quality factor of the circuit is 44.2.
       Determine the frequency of the AC supply.               3

       Space for working and answer

                                                      [Turn over

                       *X857770147*

                              page 47
PDF page 48
Question 16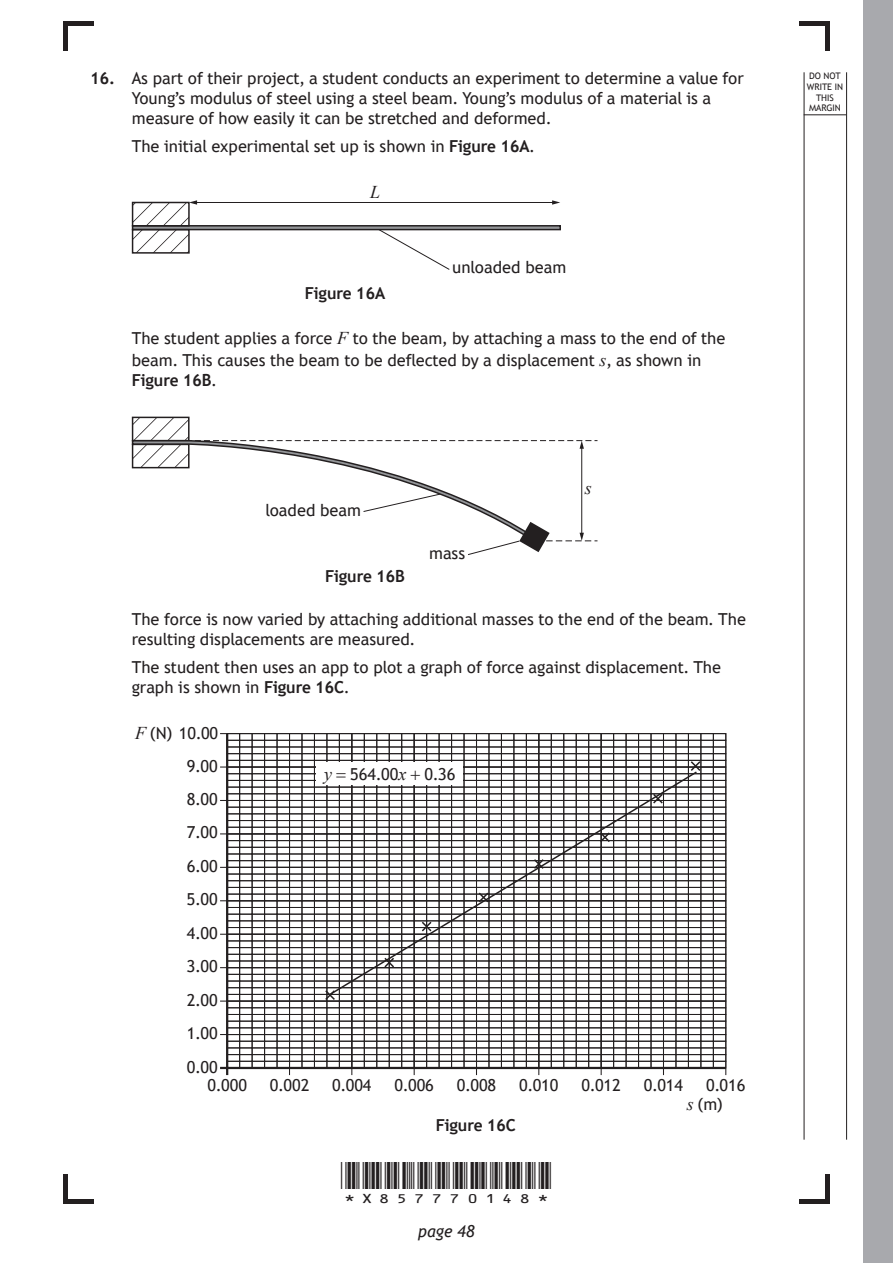
Selectable page text
16. As part of their project, a student conducts an experiment to determine a value for DO NOT
                                                                  WRITE IN
    Young’s modulus of steel using a steel beam. Young’s modulus of a material is a THIS
                                                                  MARGIN
    measure of how easily it can be stretched and deformed.
    The initial experimental set up is shown in Figure 16A.
                          L

                                  unloaded beam

                    Figure 16A

    The student applies a force F to the beam, by attaching a mass to the end of the
    beam. This causes the beam to be deflected by a displacement s, as shown in
    Figure 16B.

                                              s
                loaded beam

                               mass
                      Figure 16B

    The force is now varied by attaching additional masses to the end of the beam. The
    resulting displacements are measured.

    The student then uses an app to plot a graph of force against displacement. The
    graph is shown in Figure 16C.

    F (N) 10.00

         9.00
                      y = 564.00x + 0.36
         8.00
         7.00

         6.00

         5.00
         4.00

         3.00

         2.00

         1.00
         0.00
           0.000 0.002 0.004 0.006 0.008 0.010 0.012 0.014 0.016
                                                       s (m)
                                Figure 16C

                       *X857770148*

                              page 48
PDF page 49
Selectable page text
MARKS _{W}^{D}_{R}^{O}_{I} _{T}^{N}OT
                                                                    E IN
                                                                   THIS
                                                                  MARGIN
16. (continued)
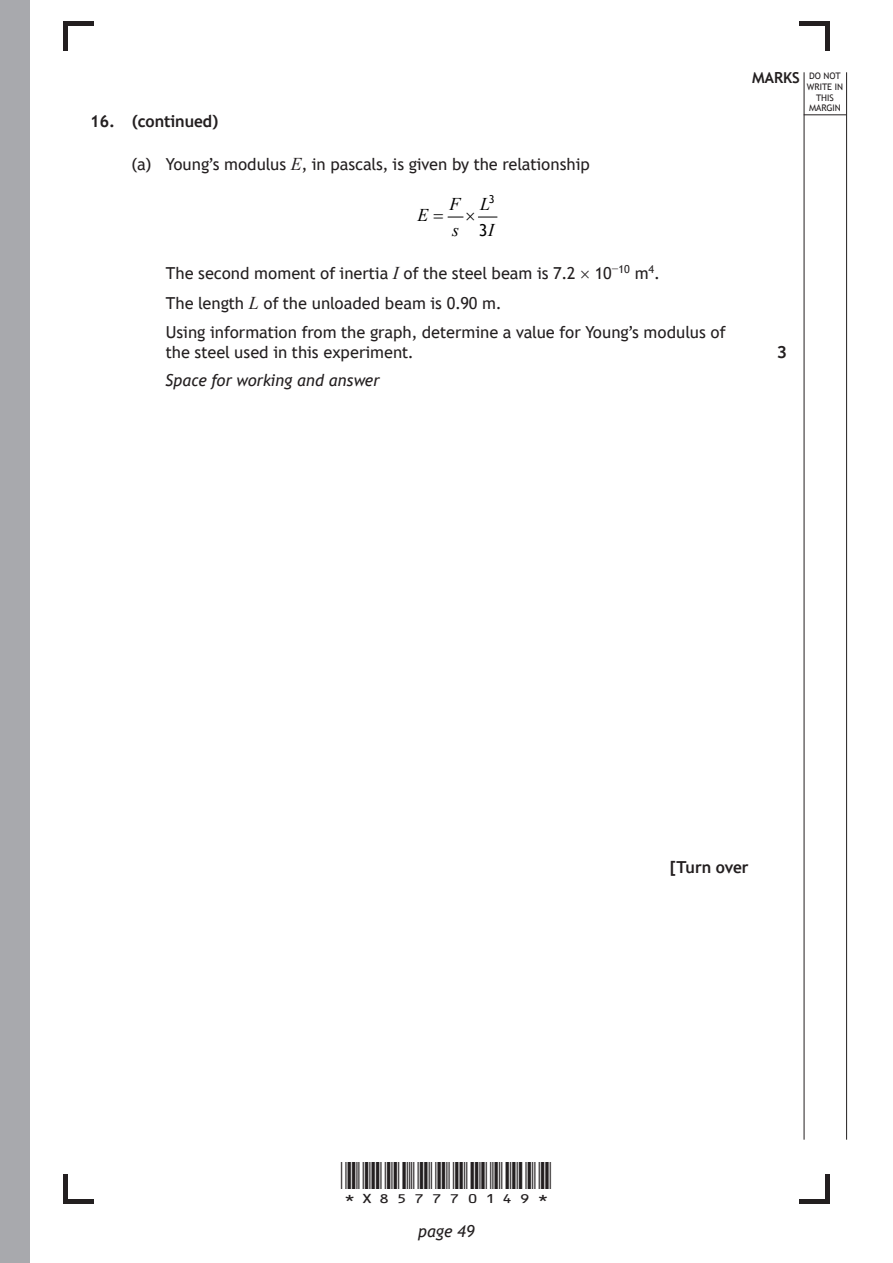
    (a) Young’s modulus E, in pascals, is given by the relationship
                                 F  L³
                              E =  ×
                                  s 3I

       The second moment of inertia I of the steel beam is 7.2 × 10⁻¹⁰ m⁴.
       The length L of the unloaded beam is 0.90 m.

       Using information from the graph, determine a value for Young’s modulus of
       the steel used in this experiment.                      3
       Space for working and answer

                                                      [Turn over

                       *X857770149*

                              page 49
PDF page 50
Selectable page text
16. (continued)                                              MARKS _{W}^{D}_{R}^{O}_{I} _{T}^{N}OT
                                                                    E IN
                                                                   THIS
                                                                  MARGIN
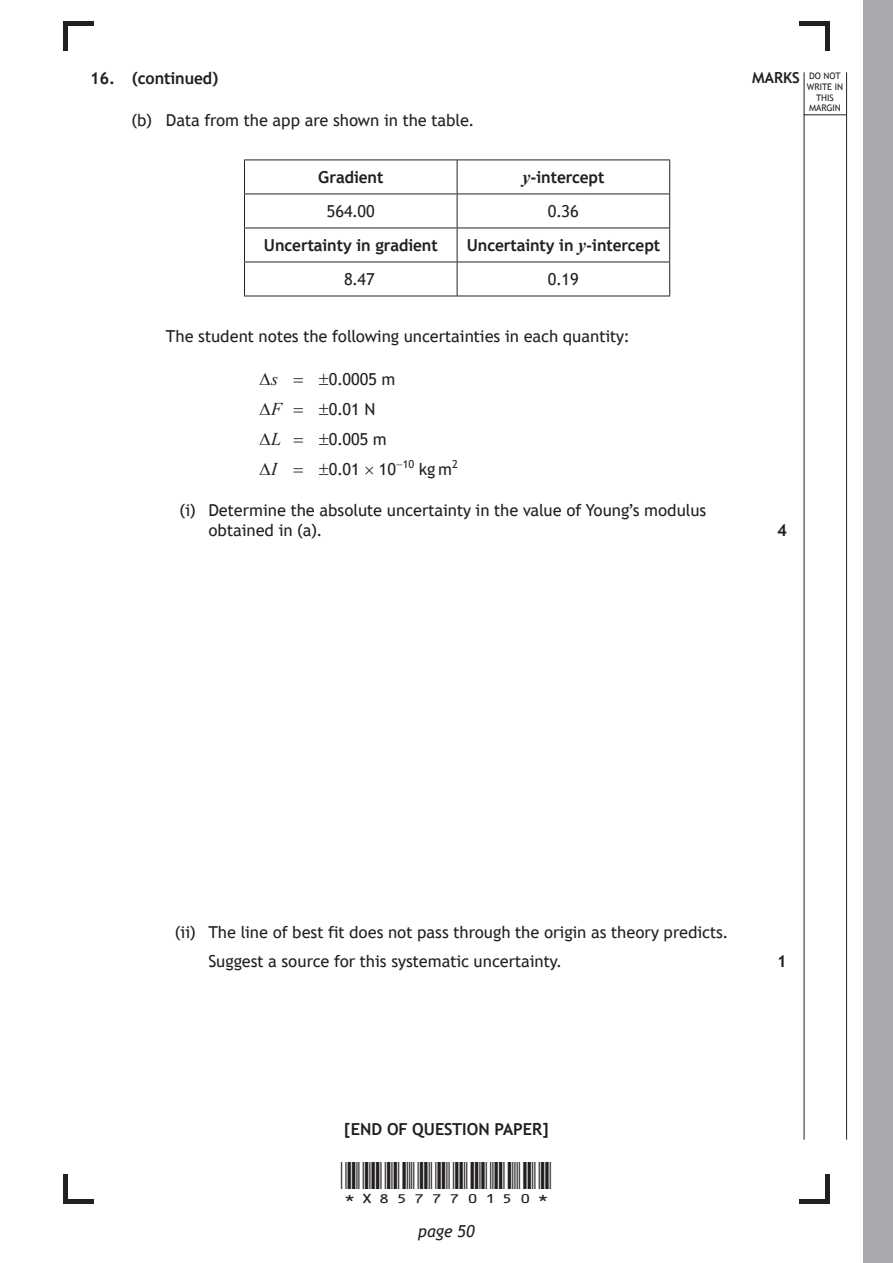
    (b) Data from the app are shown in the table.
                     Gradient           y-intercept
                      564.00              0.36

                Uncertainty in gradient Uncertainty in y-intercept

                        8.47              0.19

       The student notes the following uncertainties in each quantity:

                ∆ s = ±0.0005 m

                ∆ F = ±0.01 N
                ∆ L = ±0.005 m

                ∆ I = ±0.01 × 10⁻¹⁰ kg m²

         (i) Determine the absolute uncertainty in the value of Young’s modulus
           obtained in (a).                                    4

        (ii) The line of best fit does not pass through the origin as theory predicts.

           Suggest a source for this systematic uncertainty.   1

                        [END OF QUESTION PAPER]

                       *X857770150*

                              page 50
PDF page 51

Selectable page text
*X857770151*

       page 51
PDF page 52

Selectable page text
*X857770152*

       page 52
PDF page 53
Selectable page text
MARKS _{W}^{D}_{R}^{O}_{I} _{T}^{N}OT
                                                                    E IN
                                                                   THIS
                                                                  MARGIN
            ADDITIONAL SPACE FOR ANSWERS AND ROUGH WORK
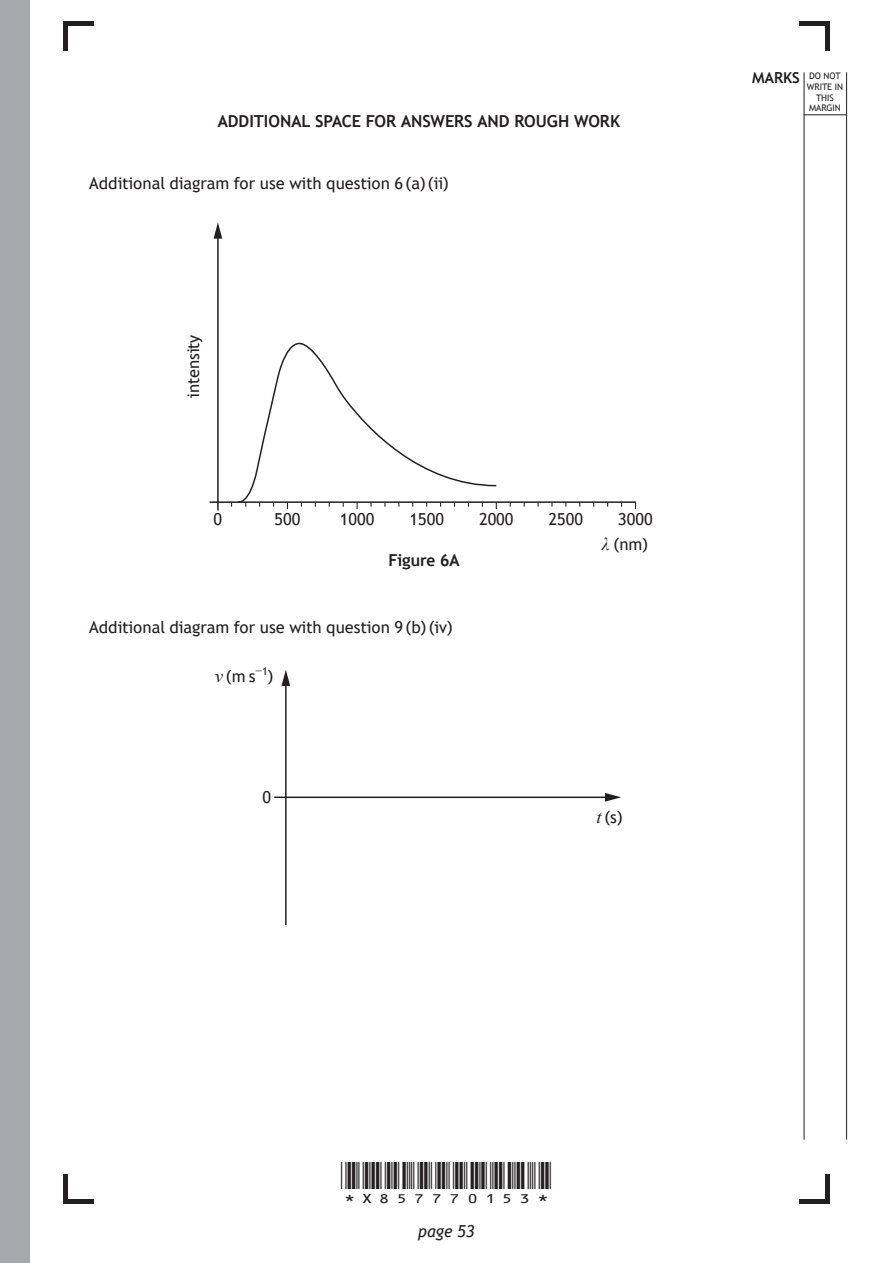
Additional diagram for use with question 6 (a) (ii)

                       *X857770153*

                              page 53
         ytisnetni
            0    500   1000   1500  2000  2500   3000
                                               λ (nm)
                            Figure 6A
Additional diagram for use with question 9 (b) (iv)
            v (m s⁻¹)
                0
                                               t (s)
PDF page 54
Selectable page text
MARKS _{W}^{D}_{R}^{O}_{I} _{T}^{N}OT
                                                                    E IN
                                                                   THIS
                                                                  MARGIN
            ADDITIONAL SPACE FOR ANSWERS AND ROUGH WORK
Additional diagram for use with question 13 (a)

                          +

                                       insulated
                                       stand

                              Figure 13A

                       *X857770154*

                              page 54
PDF page 55
Selectable page text
MARKS _{W}^{D}_{R}^{O}_{I} _{T}^{N}OT
                                                        E IN
                                                       THIS
                                                      MARGIN
ADDITIONAL SPACE FOR ANSWERS AND ROUGH WORK

           *X857770155*

                  page 55
PDF page 56

Selectable page text
MARKS _{W}^{D}_{R}^{O}_{I} _{T}^{N}OT
                                                                    E IN
                                                                   THIS
                                                                  MARGIN
            ADDITIONAL SPACE FOR ANSWERS AND ROUGH WORK

Acknowledgement of copyright
Question 3 ART-ur/shutterstock.com

                       *X857770156*

                              page 56