2024 Advanced Higher Biology - Paper 1 questions
Source: Scottish Qualifications Authority (SQA) / Qualifications Scotland. This is a StemInteract HTML companion, not an official HTML edition. Selectable text is supplied alongside original page images. Use the images or original PDF for equations, powers, fractions, vector notation, tables and diagrams; text extraction cannot fully preserve mathematical layout.
Jump to a question
PDF page 1
Selectable page text
AH
National
Qualications
2024
X807/77/02 Biology
Section 1 — Questions
WEDNESDAY, 15 MAY
9:00 AM – 12:00 NOON
Instructions for the completion of Section 1 are given on page 02 of your question and answer
booklet X807/77/01.
Record your answers on the answer grid on page 03 of your question and answer booklet.
Before leaving the examination room you must give your question and answer booklet to the
Invigilator; if you do not, you may lose all the marks for this paper.
©
*X8077702*
A/PBPDF page 2
Paper 1, Question 1Paper 1, Question 2Paper 1, Question 3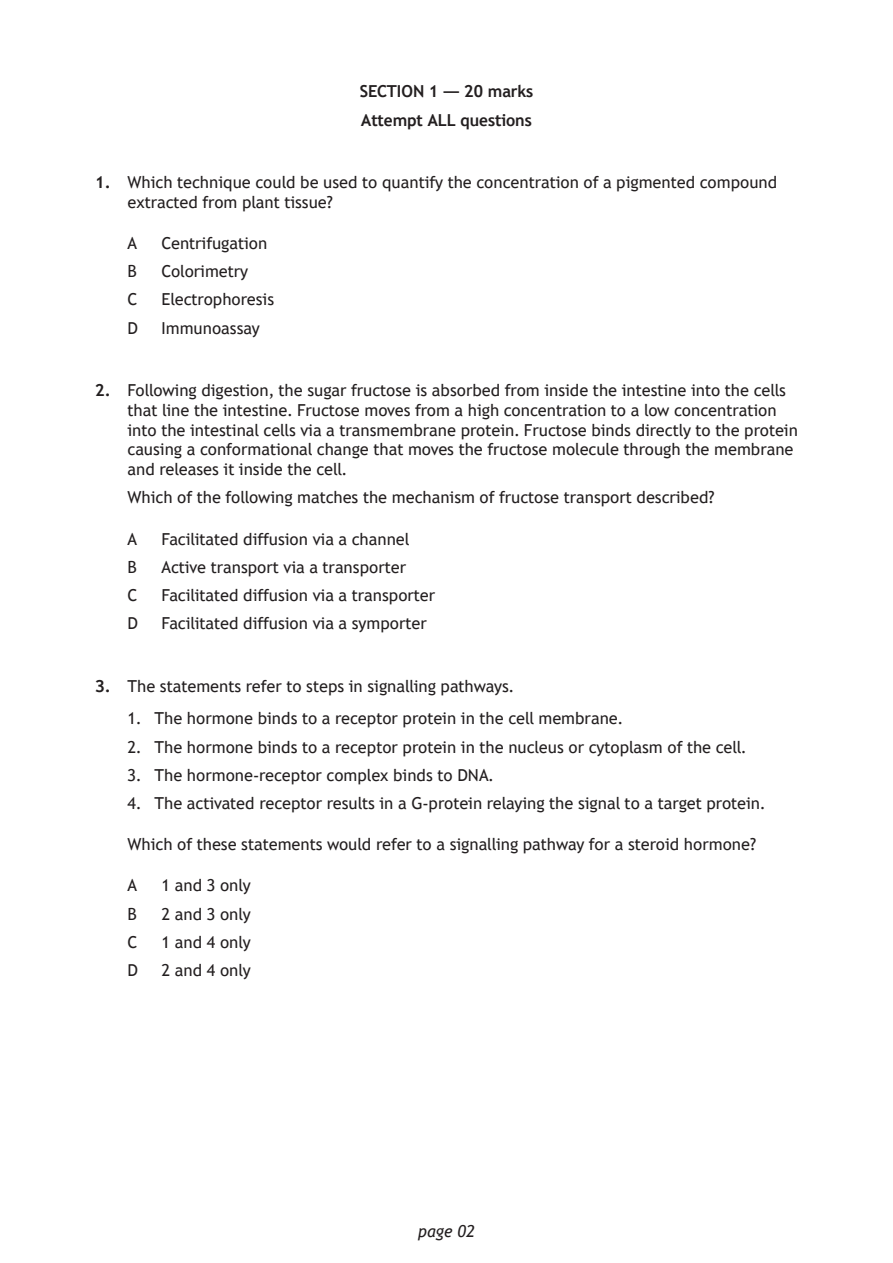
Selectable page text
SECTION 1 — 20 marks

                        Attempt ALL questions

1. Which technique could be used to quantify the concentration of a pigmented compound
   extracted from plant tissue?

   A  Centrifugation

   B  Colorimetry
   C  Electrophoresis
   D  Immunoassay

2. Following digestion, the sugar fructose is absorbed from inside the intestine into the cells
   that line the intestine. Fructose moves from a high concentration to a low concentration
   into the intestinal cells via a transmembrane protein. Fructose binds directly to the protein
   causing a conformational change that moves the fructose molecule through the membrane
   and releases it inside the cell.
   Which of the following matches the mechanism of fructose transport described?

   A  Facilitated diffusion via a channel

   B  Active transport via a transporter
   C  Facilitated diffusion via a transporter

   D  Facilitated diffusion via a symporter

3. The statements refer to steps in signalling pathways.

   1. The hormone binds to a receptor protein in the cell membrane.
   2. The hormone binds to a receptor protein in the nucleus or cytoplasm of the cell.
   3. The hormone‑receptor complex binds to DNA.

   4. The activated receptor results in a G‑protein relaying the signal to a target protein.

   Which of these statements would refer to a signalling pathway for a steroid hormone?

   A  1 and 3 only

   B  2 and 3 only
   C  1 and 4 only
   D  2 and 4 only

                             page 02
PDF page 3
Paper 1, Question 4Paper 1, Question 5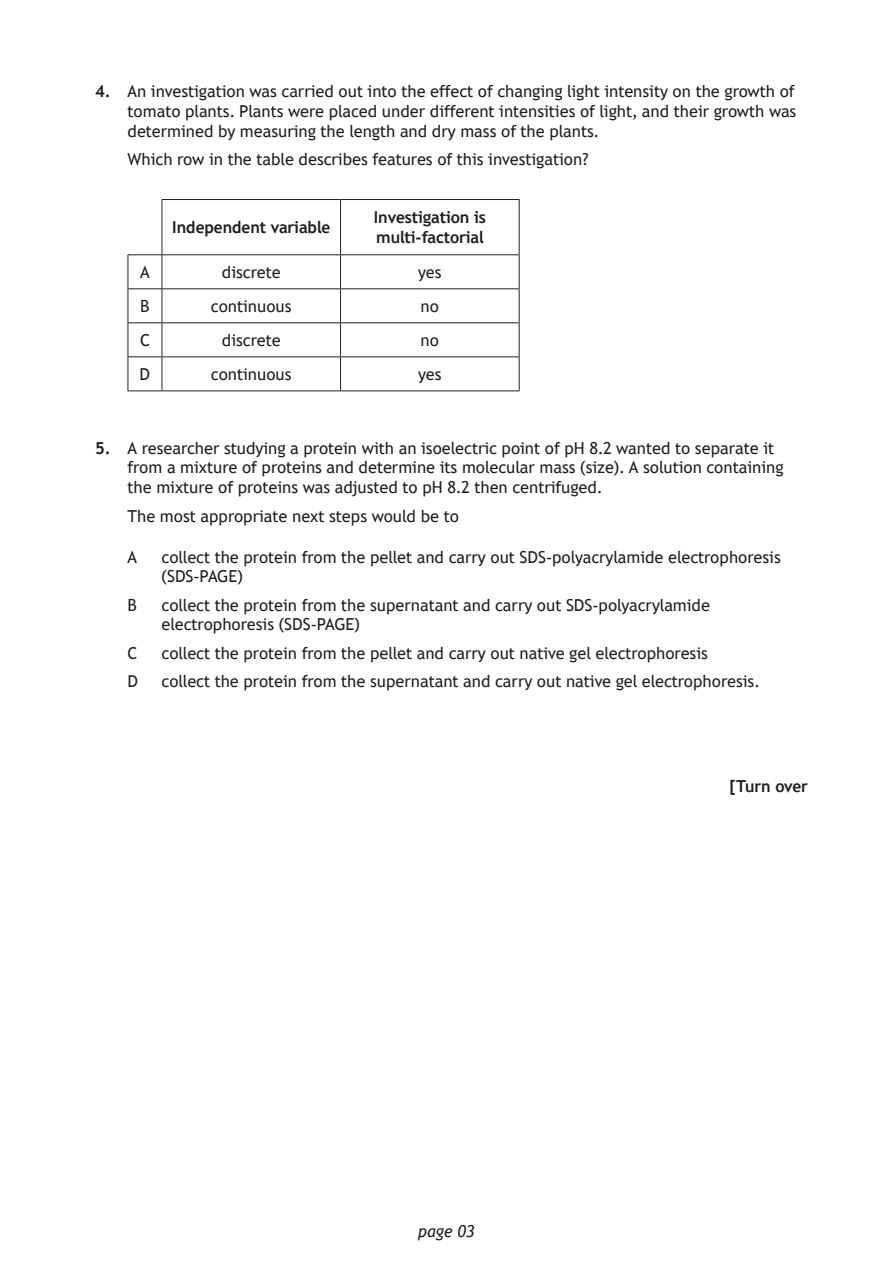
Selectable page text
4. An investigation was carried out into the effect of changing light intensity on the growth of
   tomato plants. Plants were placed under different intensities of light, and their growth was
   determined by measuring the length and dry mass of the plants.

   Which row in the table describes features of this investigation?

                         Investigation is
       Independent variable
                          multi‑factorial
    A      discrete          yes
    B     continuous          no

    C      discrete           no

    D     continuous         yes

5. A researcher studying a protein with an isoelectric point of pH 8.2 wanted to separate it
   from a mixture of proteins and determine its molecular mass (size). A solution containing
   the mixture of proteins was adjusted to pH 8.2 then centrifuged.
   The most appropriate next steps would be to

   A  collect the protein from the pellet and carry out SDS‑polyacrylamide electrophoresis
      (SDS‑PAGE)

   B  collect the protein from the supernatant and carry out SDS‑polyacrylamide
      electrophoresis (SDS‑PAGE)
   C  collect the protein from the pellet and carry out native gel electrophoresis

   D  collect the protein from the supernatant and carry out native gel electrophoresis.

                                                          [Turn over

                             page 03
PDF page 4
Paper 1, Question 6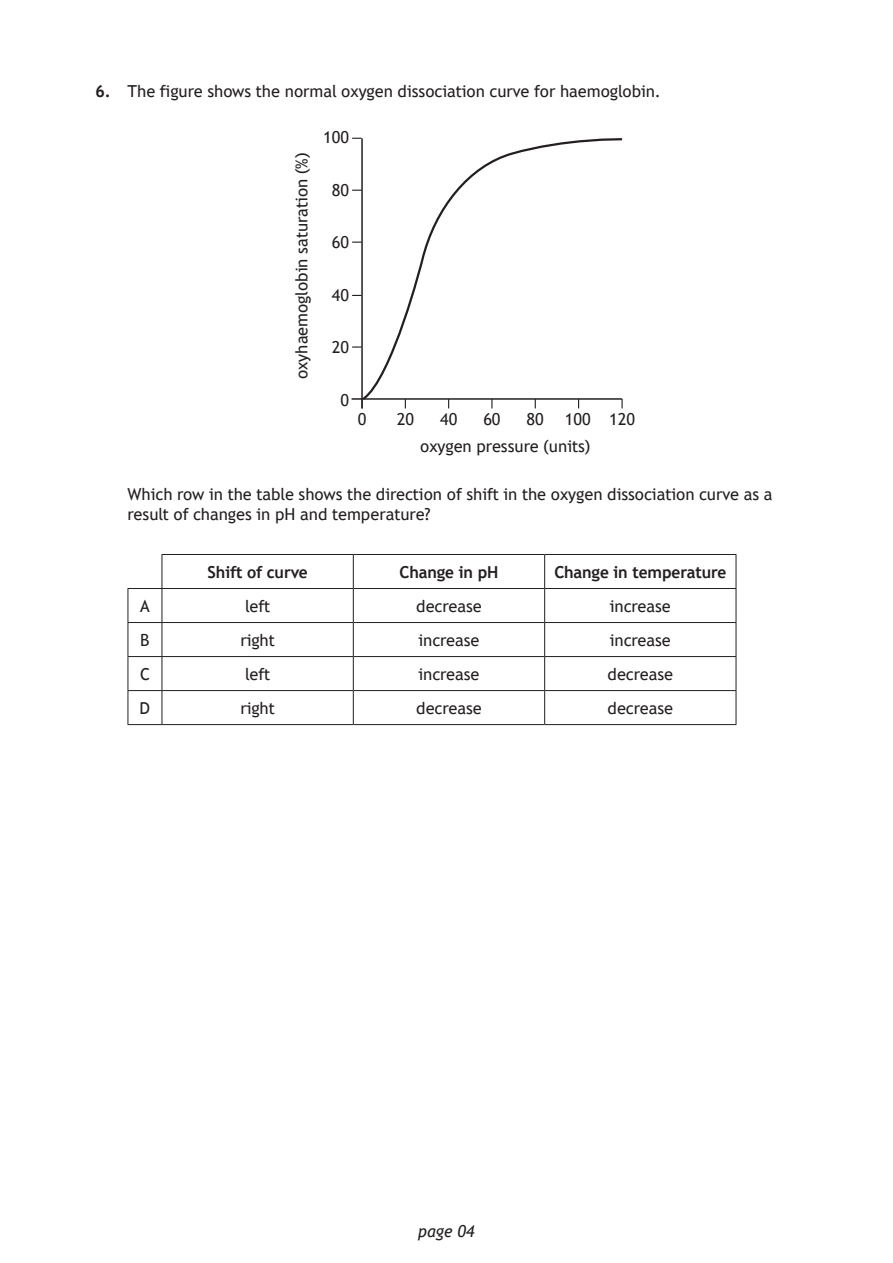
Selectable page text
6. The figure shows the normal oxygen dissociation curve for haemoglobin.

                     100

                      80

                      60

                      40

                      20

                      0
                        0  20  40  60  80  100 120

                              oxygen pressure (units)

                             page 04
                  )%(
                  noitarutas
                  nibolgomeahyxo
   Which row in the table shows the direction of shift in the oxygen dissociation curve as a
   result of changes in pH and temperature?
          Shift of curve    Change in pH  Change in temperature
    A         left           decrease          increase
    B        right           increase          increase
    C         left           increase          decrease
    D        right           decrease          decrease
PDF page 5
Paper 1, Question 7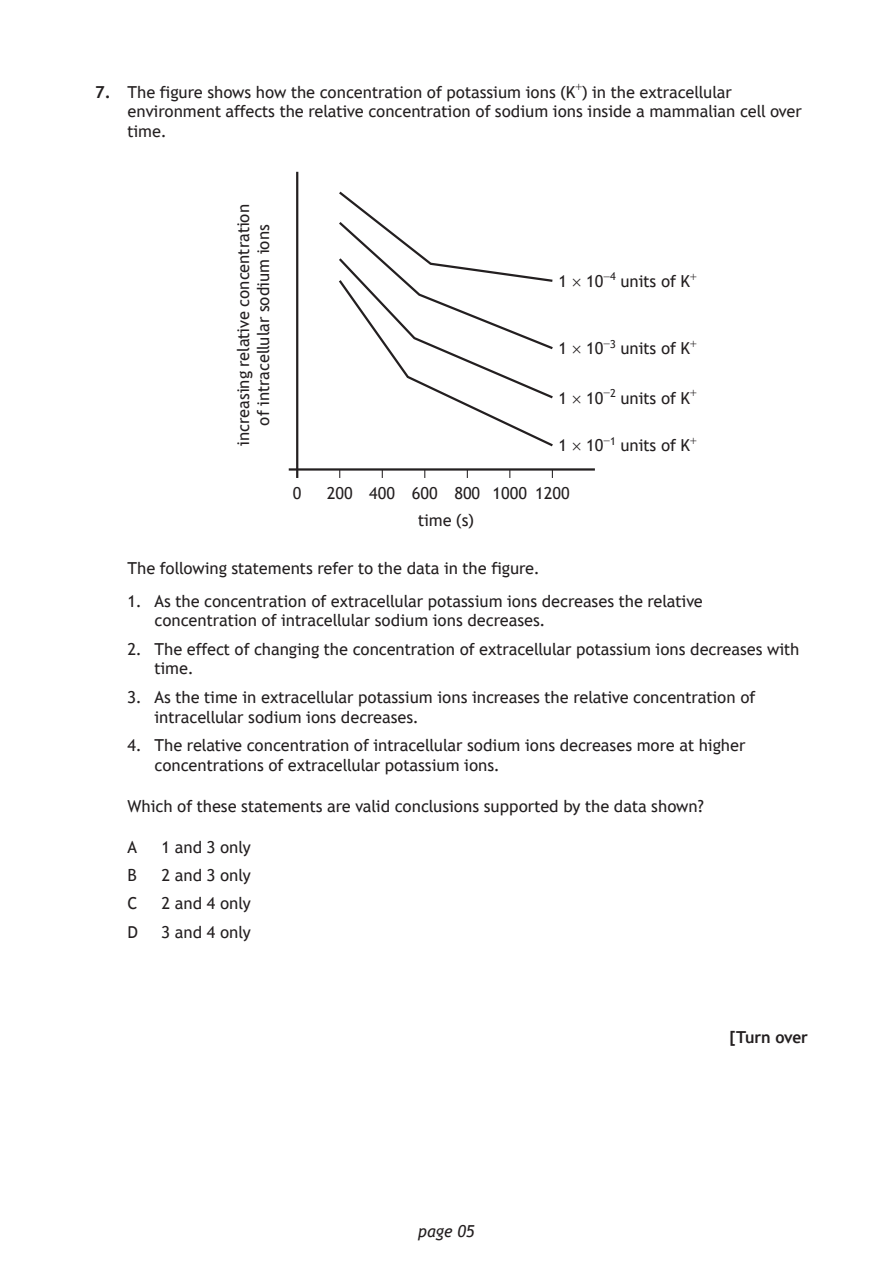
Selectable page text
7. The figure shows how the concentration of potassium ions (K⁺) in the extracellular
   environment affects the relative concentration of sodium ions inside a mammalian cell over
   time.

                  0  200 400 600
                             time (s)

                             page 05
             noitartnecnoc
             evitaler
             gnisaercni
               snoi
               muidos
               ralullecartni
               fo
                                          1 × 10⁻⁴ units of K⁺
                                          1 × 10⁻³ units of K⁺
                                          1 × 10⁻² units of K⁺
                                          1 × 10⁻¹ units of K⁺
                                 800 1000 1200
   The following statements refer to the data in the figure.
   1. As the concentration of extracellular potassium ions decreases the relative
     concentration of intracellular sodium ions decreases.
   2. The effect of changing the concentration of extracellular potassium ions decreases with
     time.
   3. As the time in extracellular potassium ions increases the relative concentration of
     intracellular sodium ions decreases.
   4. The relative concentration of intracellular sodium ions decreases more at higher
     concentrations of extracellular potassium ions.
   Which of these statements are valid conclusions supported by the data shown?
   A  1 and 3 only
   B  2 and 3 only
   C  2 and 4 only
   D  3 and 4 only
                                                          [Turn over
PDF page 6
Paper 1, Question 8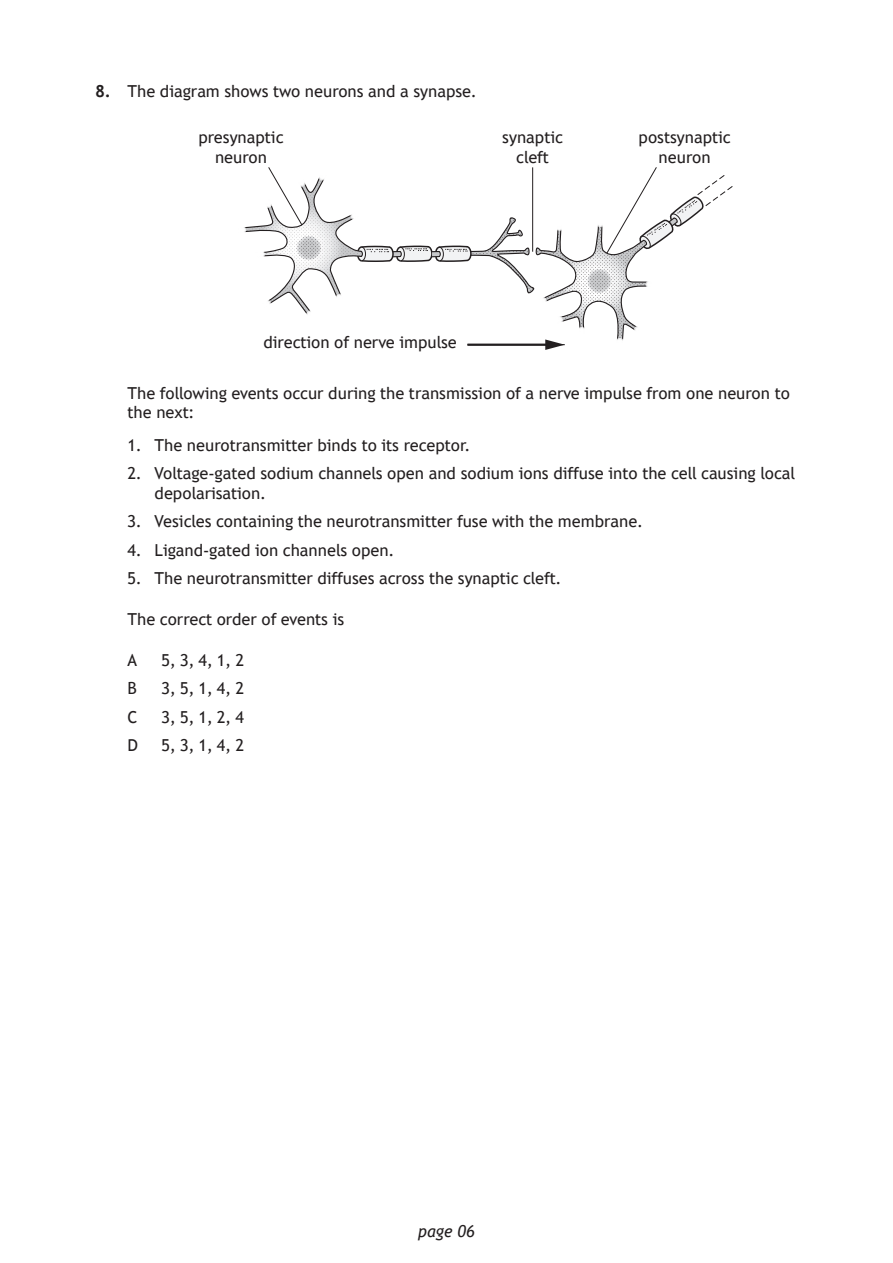
Selectable page text
8. The diagram shows two neurons and a synapse.

         presynaptic                 synaptic     postsynaptic
           neuron                     cleft         neuron

               direction of nerve impulse

   The following events occur during the transmission of a nerve impulse from one neuron to
   the next:
   1. The neurotransmitter binds to its receptor.

   2. Voltage‑gated sodium channels open and sodium ions diffuse into the cell causing local
     depolarisation.
   3. Vesicles containing the neurotransmitter fuse with the membrane.

   4. Ligand‑gated ion channels open.
   5. The neurotransmitter diffuses across the synaptic cleft.

   The correct order of events is

   A  5, 3, 4, 1, 2
   B  3, 5, 1, 4, 2
   C  3, 5, 1, 2, 4

   D  5, 3, 1, 4, 2

                             page 06
PDF page 7
Paper 1, Question 9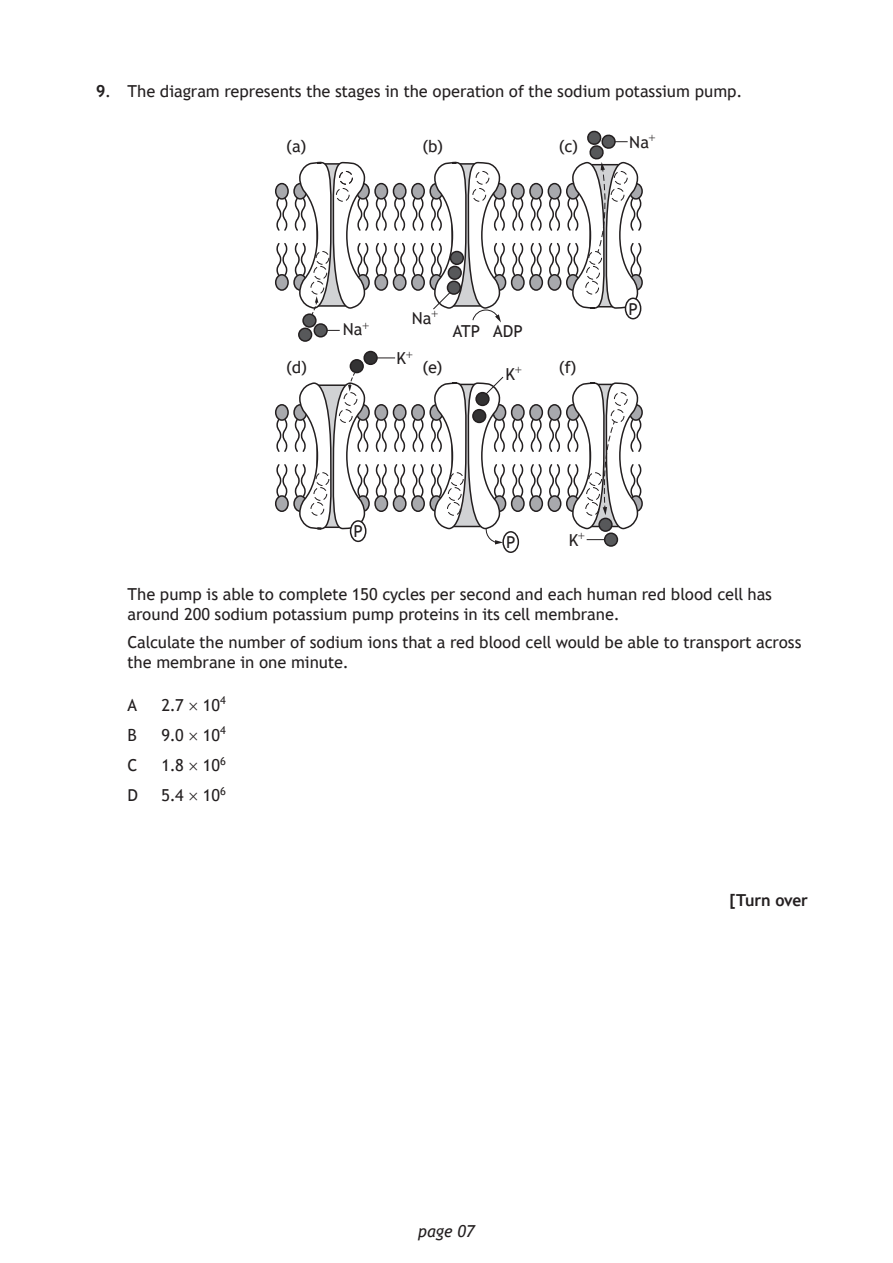
Selectable page text
9. The diagram represents the stages in the operation of the sodium potassium pump.

                 (a)          (b)         (c)    Na⁺

                                                 P
                             Na⁺
                       Na⁺       ATP ADP
                           K⁺
                 (d)          (e)         (f)
                                     K⁺

                        P
                                      P    K⁺

   The pump is able to complete 150 cycles per second and each human red blood cell has
   around 200 sodium potassium pump proteins in its cell membrane.

   Calculate the number of sodium ions that a red blood cell would be able to transport across
   the membrane in one minute.

   A  2.7 × 10⁴
   B  9.0 × 10⁴

   C  1.8 × 10⁶
   D  5.4 × 10⁶

                                                          [Turn over

                             page 07
PDF page 8
Paper 1, Question 10Paper 1, Question 11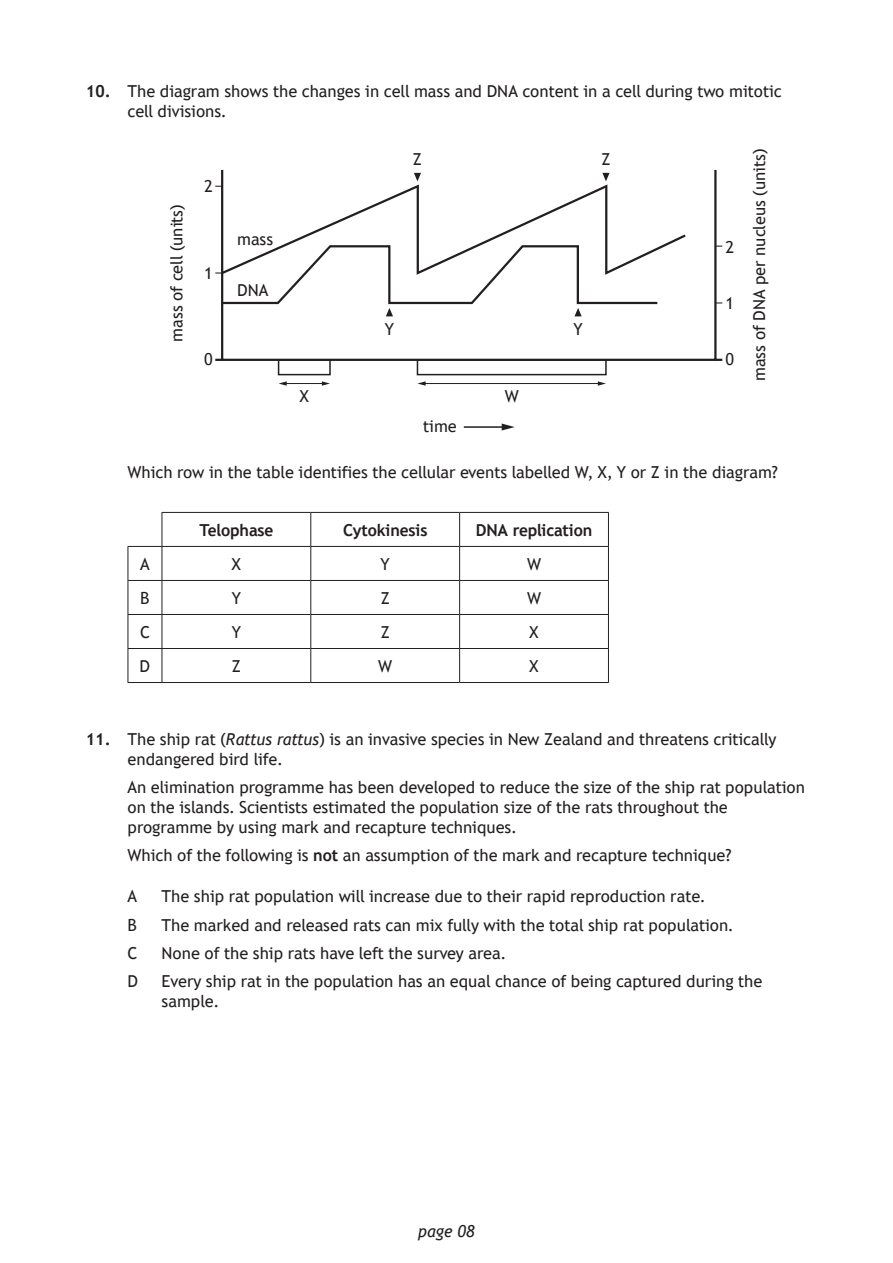
Selectable page text
10. The diagram shows the changes in cell mass and DNA content in a cell during two mitotic
    cell divisions.

                              page 08
        )stinu(
        llec
        fo
        ssam
                               time
                                                             )stinu(
                                                             suelcun
                                                             rep
                                                             AND
                                                             fo
                                                             ssam
                              Z                Z
           2
              mass
                                                           2
           1
              DNA
                                                           1
                           Y                 Y
           0                                               0
                    X                 W
    Which row in the table identifies the cellular events labelled W, X, Y or Z in the diagram?
          Telophase     Cytokinesis DNA replication
     A       X             Y            W
     B       Y             Z            W
     C       Y             Z             X
     D       Z             W             X
11. The ship rat (Rattus rattus) is an invasive species in New Zealand and threatens critically
    endangered bird life.
    An elimination programme has been developed to reduce the size of the ship rat population
    on the islands. Scientists estimated the population size of the rats throughout the
    programme by using mark and recapture techniques.
    Which of the following is not an assumption of the mark and recapture technique?
    A  The ship rat population will increase due to their rapid reproduction rate.
    B  The marked and released rats can mix fully with the total ship rat population.
    C  None of the ship rats have left the survey area.
    D  Every ship rat in the population has an equal chance of being captured during the
       sample.
PDF page 9
Paper 1, Question 12Paper 1, Question 13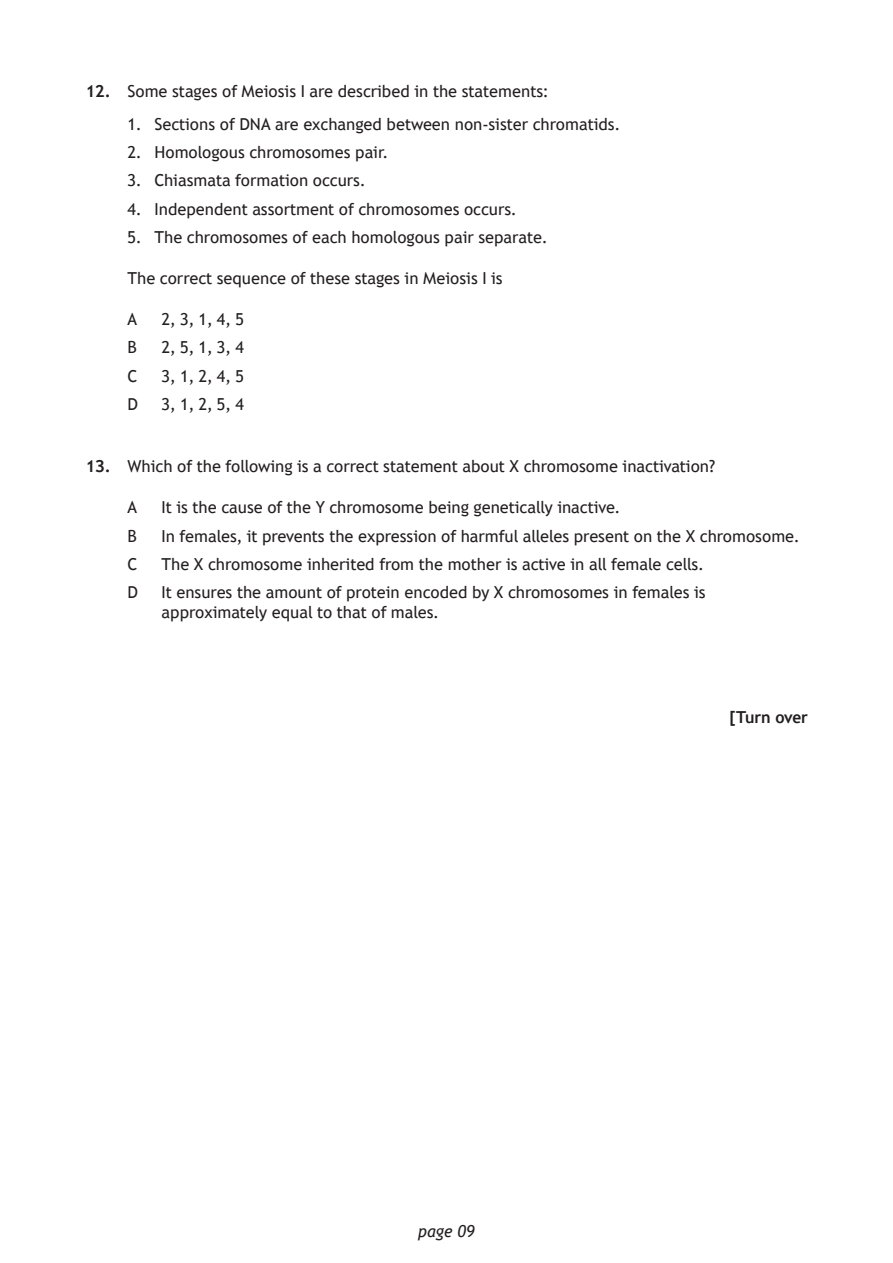
Selectable page text
12. Some stages of Meiosis I are described in the statements:

    1. Sections of DNA are exchanged between non‑sister chromatids.
    2. Homologous chromosomes pair.

    3. Chiasmata formation occurs.
    4. Independent assortment of chromosomes occurs.

    5. The chromosomes of each homologous pair separate.

    The correct sequence of these stages in Meiosis I is

    A  2, 3, 1, 4, 5
    B  2, 5, 1, 3, 4

    C  3, 1, 2, 4, 5
    D  3, 1, 2, 5, 4

13. Which of the following is a correct statement about X chromosome inactivation?

    A  It is the cause of the Y chromosome being genetically inactive.
    B  In females, it prevents the expression of harmful alleles present on the X chromosome.

    C  The X chromosome inherited from the mother is active in all female cells.
    D  It ensures the amount of protein encoded by X chromosomes in females is
       approximately equal to that of males.

                                                           [Turn over

                              page 09
PDF page 10
Paper 1, Question 14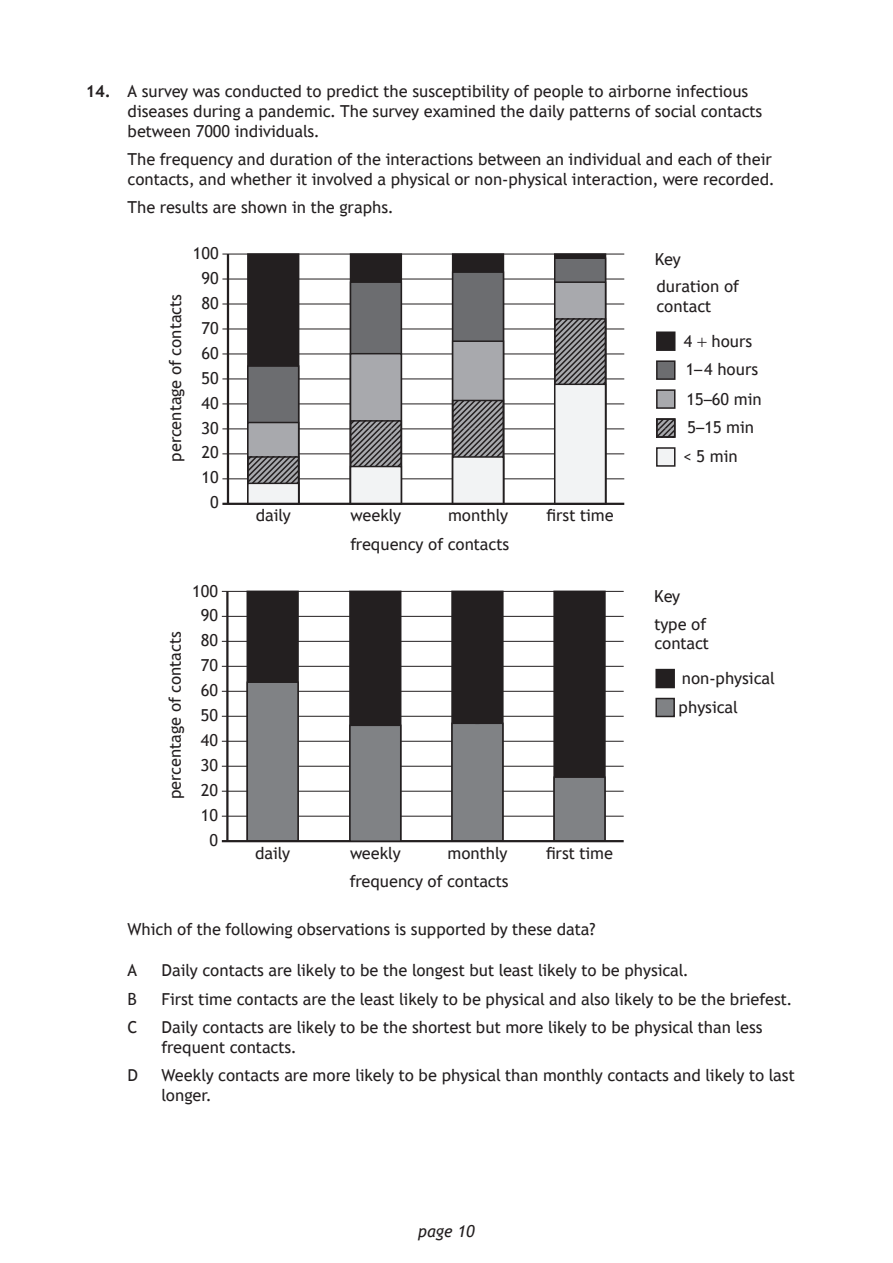
Selectable page text
14. A survey was conducted to predict the susceptibility of people to airborne infectious
    diseases during a pandemic. The survey examined the daily patterns of social contacts
    between 7000 individuals.

    The frequency and duration of the interactions between an individual and each of their
    contacts, and whether it involved a physical or non‑physical interaction, were recorded.
    The results are shown in the graphs.

          100
           90
           80
           70

           60
           50
           40

           30
           20
           10
           0

                              page 10
        stcatnoc
        fo
        egatnecrep
                                                    Key
                                                    duration of
                                                    contact
                                                       4 + hours
                                                       1– 4 hours
                                                       15–60 min
                                                       5–15 min
                                                       < 5 min
                daily   weekly   monthly  first time
                        frequency of contacts
          100
          90
          80
          70
          60
          50
          40
          30
          20
          10
           0
       stcatnoc
       fo
       egatnecrep
                                                    Key
                                                    type of
                                                    contact
                                                       non-physical
                                                      physical
               daily    weekly   monthly  first time
                        frequency of contacts
    Which of the following observations is supported by these data?
    A  Daily contacts are likely to be the longest but least likely to be physical.
    B  First time contacts are the least likely to be physical and also likely to be the briefest.
    C  Daily contacts are likely to be the shortest but more likely to be physical than less
       frequent contacts.
    D  Weekly contacts are more likely to be physical than monthly contacts and likely to last
       longer.
PDF page 11
Paper 1, Question 15Paper 1, Question 16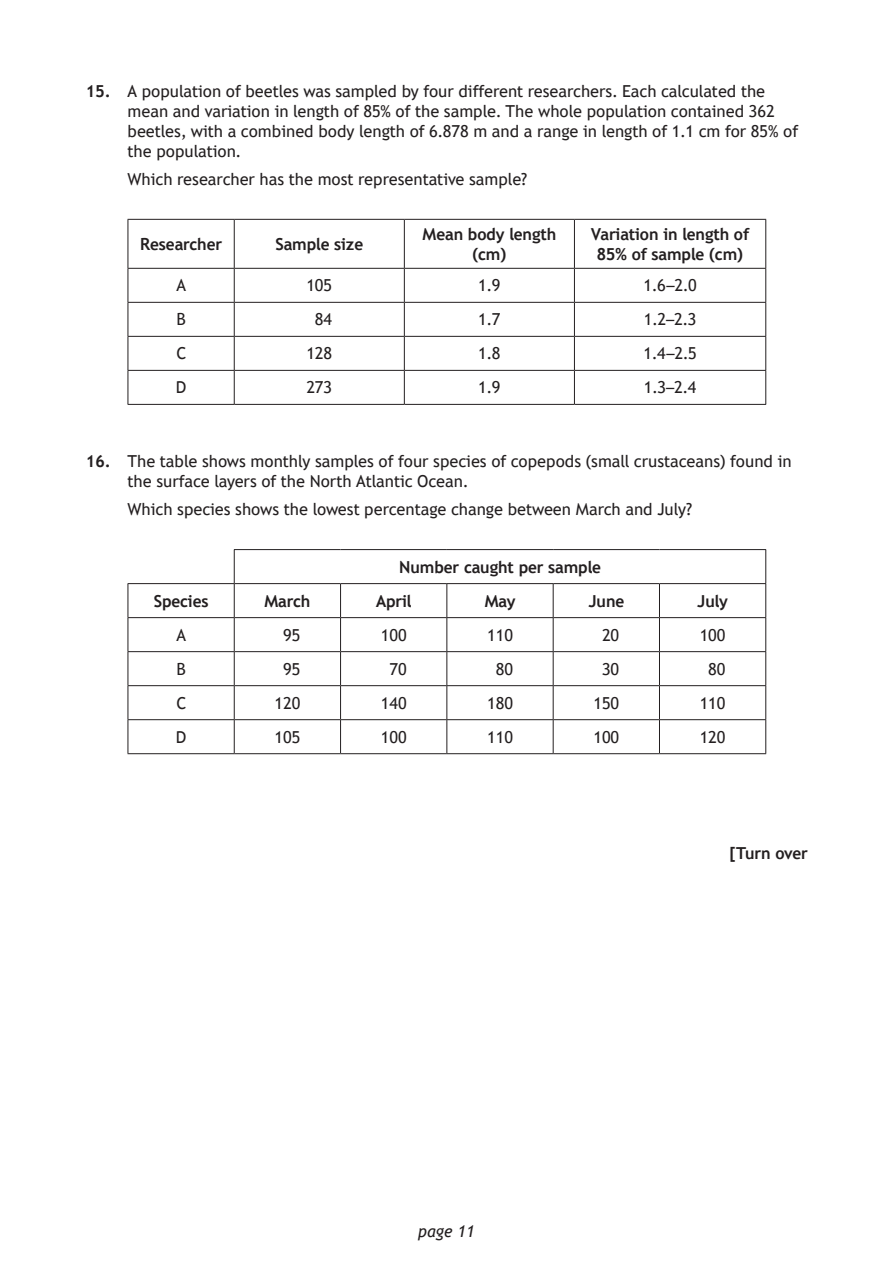
Selectable page text
15. A population of beetles was sampled by four different researchers. Each calculated the
    mean and variation in length of 85% of the sample. The whole population contained 362
    beetles, with a combined body length of 6.878 m and a range in length of 1.1 cm for 85% of
    the population.

    Which researcher has the most representative sample?

                               Mean body length Variation in length of
     Researcher  Sample size
                                   (cm)        85% of sample (cm)
        A           105             1.9            1.6 –2.0
        B            84             1.7            1.2–2.3

        C           128             1.8            1.4 –2.5

        D           273             1.9            1.3–2.4

16. The table shows monthly samples of four species of copepods (small crustaceans) found in
    the surface layers of the North Atlantic Ocean.

    Which species shows the lowest percentage change between March and July?

                             Number caught per sample
      Species   March      April     May      June      July

        A         95       100       110       20       100

        B         95        70        80       30        80

        C        120       140       180       150      110
        D        105       100       110       100      120

                                                           [Turn over

                              page 11
PDF page 12
Paper 1, Question 17Paper 1, Question 18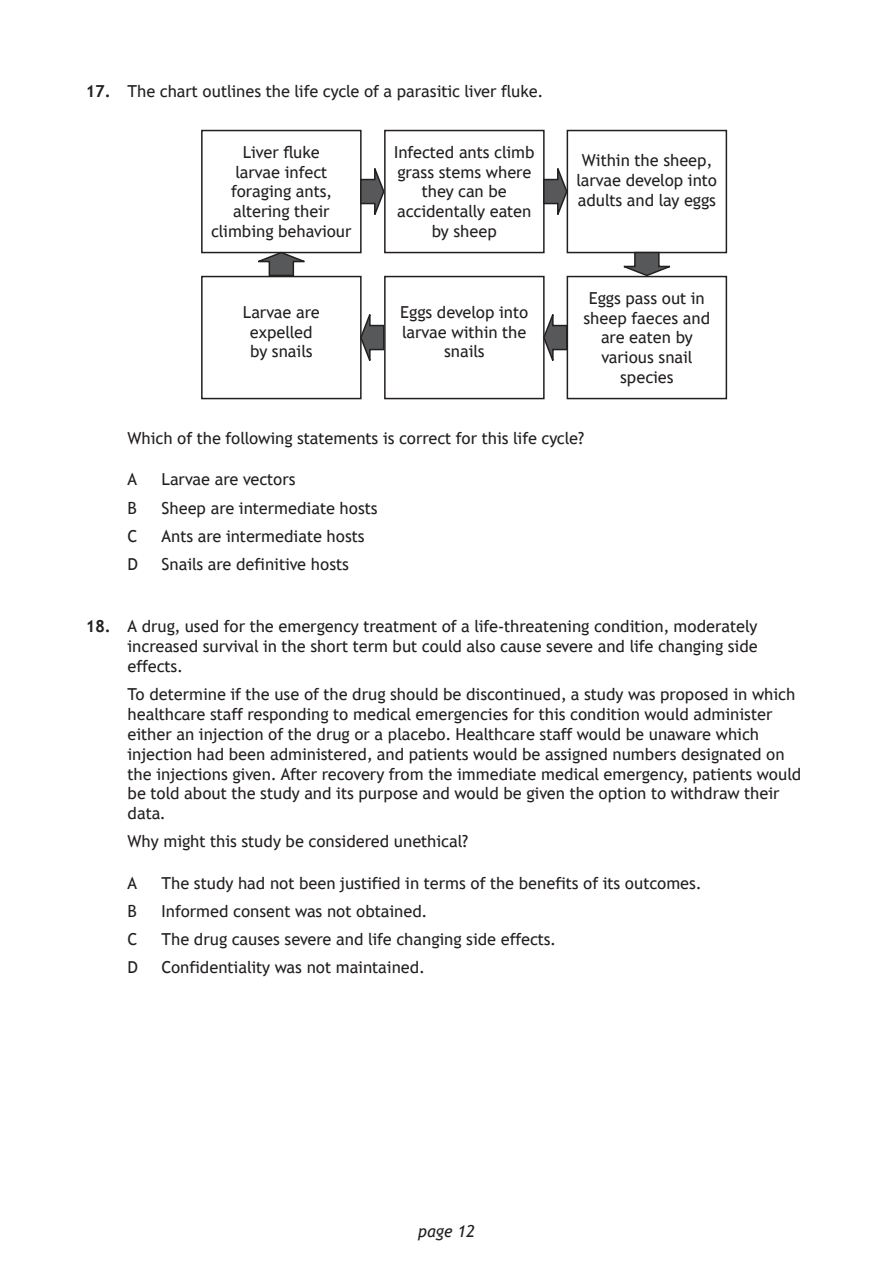
Selectable page text
17. The chart outlines the life cycle of a parasitic liver fluke.

              Liver fluke   Infected ants climb
                                              Within the sheep,
              larvae infect  grass stems where
                                             larvae develop into
             foraging ants,    they can be
                                             adults and lay eggs
             altering their  accidentally eaten
           climbing behaviour   by sheep
                                              Eggs pass out in
              Larvae are     Eggs develop into
                                              sheep faeces and
               expelled      larvae within the
                                               are eaten by
               by snails         snails
                                               various snail
                                                 species
    Which of the following statements is correct for this life cycle?
    A  Larvae are vectors

    B  Sheep are intermediate hosts
    C  Ants are intermediate hosts

    D  Snails are definitive hosts

18. A drug, used for the emergency treatment of a life‑threatening condition, moderately
    increased survival in the short term but could also cause severe and life changing side
    effects.
    To determine if the use of the drug should be discontinued, a study was proposed in which
    healthcare staff responding to medical emergencies for this condition would administer
    either an injection of the drug or a placebo. Healthcare staff would be unaware which
    injection had been administered, and patients would be assigned numbers designated on
    the injections given. After recovery from the immediate medical emergency, patients would
    be told about the study and its purpose and would be given the option to withdraw their
    data.

    Why might this study be considered unethical?

    A  The study had not been justified in terms of the benefits of its outcomes.
    B  Informed consent was not obtained.

    C  The drug causes severe and life changing side effects.
    D  Confidentiality was not maintained.

                              page 12
PDF page 13
Paper 1, Question 19Paper 1, Question 20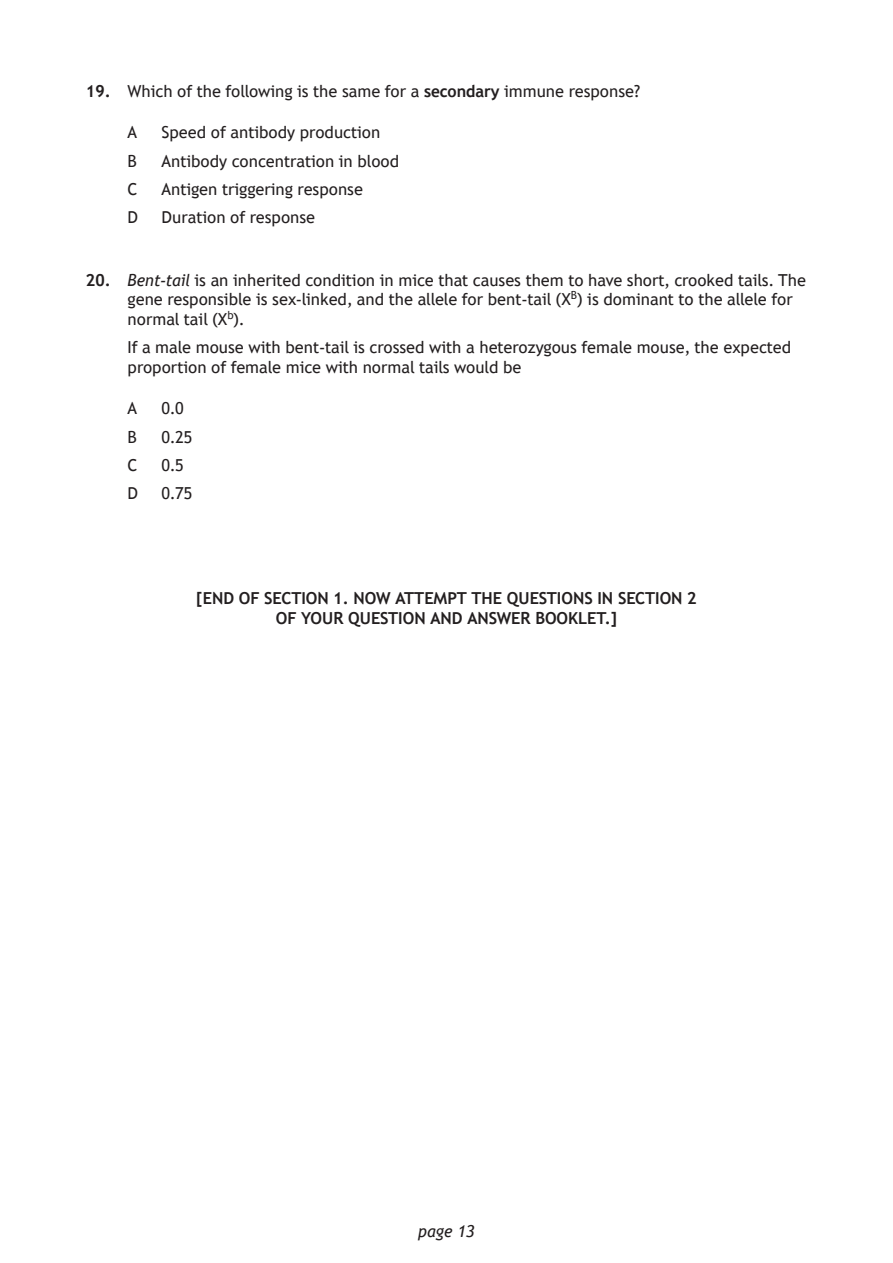
Selectable page text
19. Which of the following is the same for a secondary immune response?

    A  Speed of antibody production

    B  Antibody concentration in blood
    C  Antigen triggering response

    D  Duration of response

20. Bent‑tail is an inherited condition in mice that causes them to have short, crooked tails. The
    gene responsible is sex‑linked, and the allele for bent‑tail (X^{B}) is dominant to the allele for
    normal tail (X^{b}).
    If a male mouse with bent‑tail is crossed with a heterozygous female mouse, the expected

    proportion of female mice with normal tails would be

    A  0.0
    B  0.25

    C  0.5
    D  0.75

          [END OF SECTION 1. NOW ATTEMPT THE QUESTIONS IN SECTION 2
                 OF YOUR QUESTION AND ANSWER BOOKLET.]

                              page 13
PDF page 14

Selectable page text
[BLANK PAGE]

DO NOT WRITE ON THIS PAGE

       page 14
PDF page 15

Selectable page text
[BLANK PAGE]

DO NOT WRITE ON THIS PAGE

       page 15
PDF page 16

Selectable page text
[BLANK PAGE]

DO NOT WRITE ON THIS PAGE

       page 16