2022 Advanced Higher Biology - Paper 1 questions
Source: Scottish Qualifications Authority (SQA) / Qualifications Scotland. This is a StemInteract HTML companion, not an official HTML edition. Selectable text is supplied alongside original page images. Use the images or original PDF for equations, powers, fractions, vector notation, tables and diagrams; text extraction cannot fully preserve mathematical layout.
Jump to a question
PDF page 1
Selectable page text
AH
National
Qualications
2022
X807/77/02 Biology
Section 1 — Questions
THURSDAY, 19 MAY
1:00 PM – 4:00 PM
Instructions for the completion of Section 1 are given on page 02 of your question and answer
booklet X807/77/01.
Record your answers on the answer grid on page 03 of your question and answer booklet.
Before leaving the examination room you must give your question and answer booklet to the
Invigilator; if you do not, you may lose all the marks for this paper.
©
*X8077702*
A/PBPDF page 2
Paper 1, Question 1Paper 1, Question 2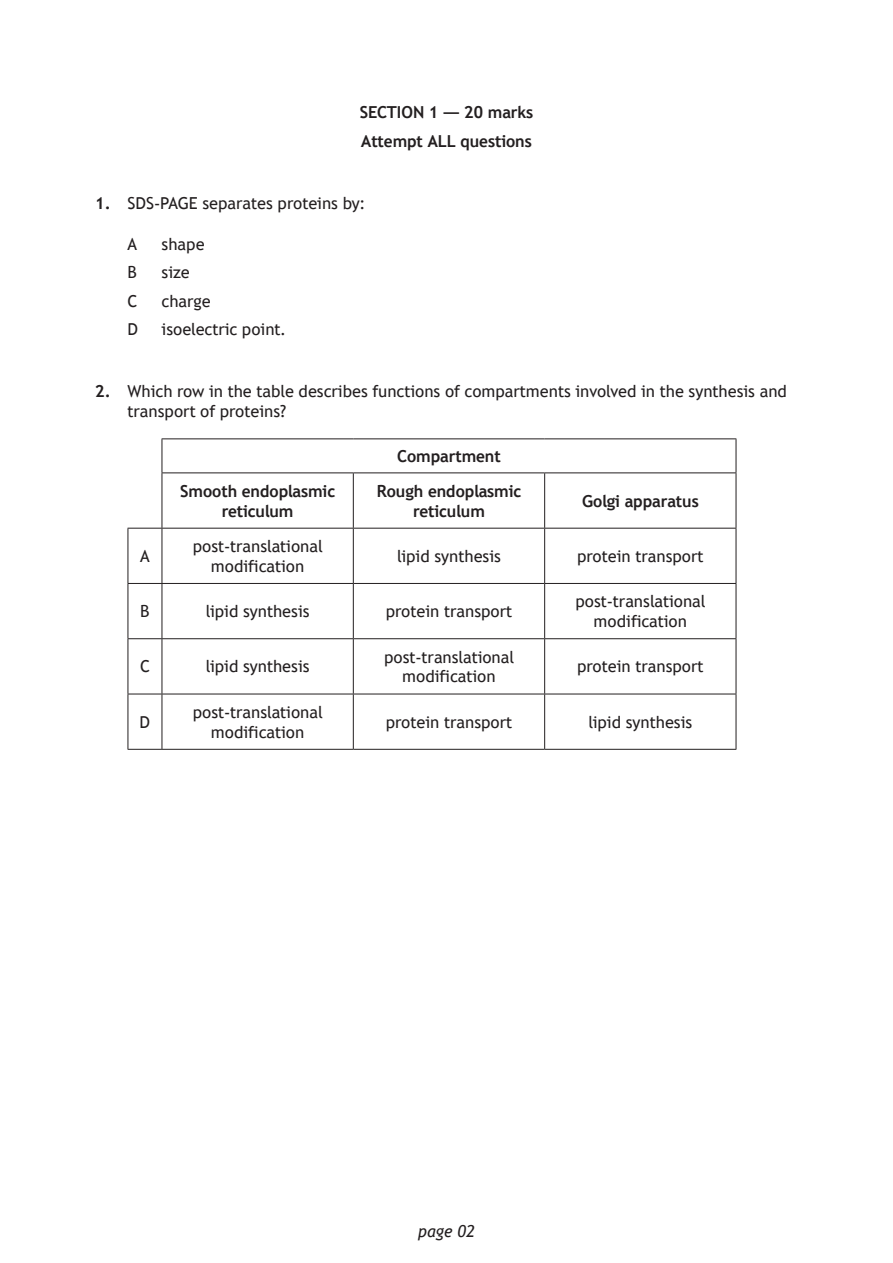
Selectable page text
SECTION 1 — 20 marks

                        Attempt ALL questions

1. SDS‑PAGE separates proteins by:

   A  shape

   B  size
   C  charge

   D  isoelectric point.

2. Which row in the table describes functions of compartments involved in the synthesis and
   transport of proteins?

                            Compartment

        Smooth endoplasmic Rough endoplasmic
                                             Golgi apparatus
           reticulum         reticulum
         post‑translational
    A                       lipid synthesis protein transport
          modification
                                            post‑translational
    B     lipid synthesis protein transport
                                              modification
                          post‑translational
    C     lipid synthesis                   protein transport
                            modification
         post‑translational
    D                     protein transport  lipid synthesis
          modification

                             page 02
PDF page 3
Paper 1, Question 3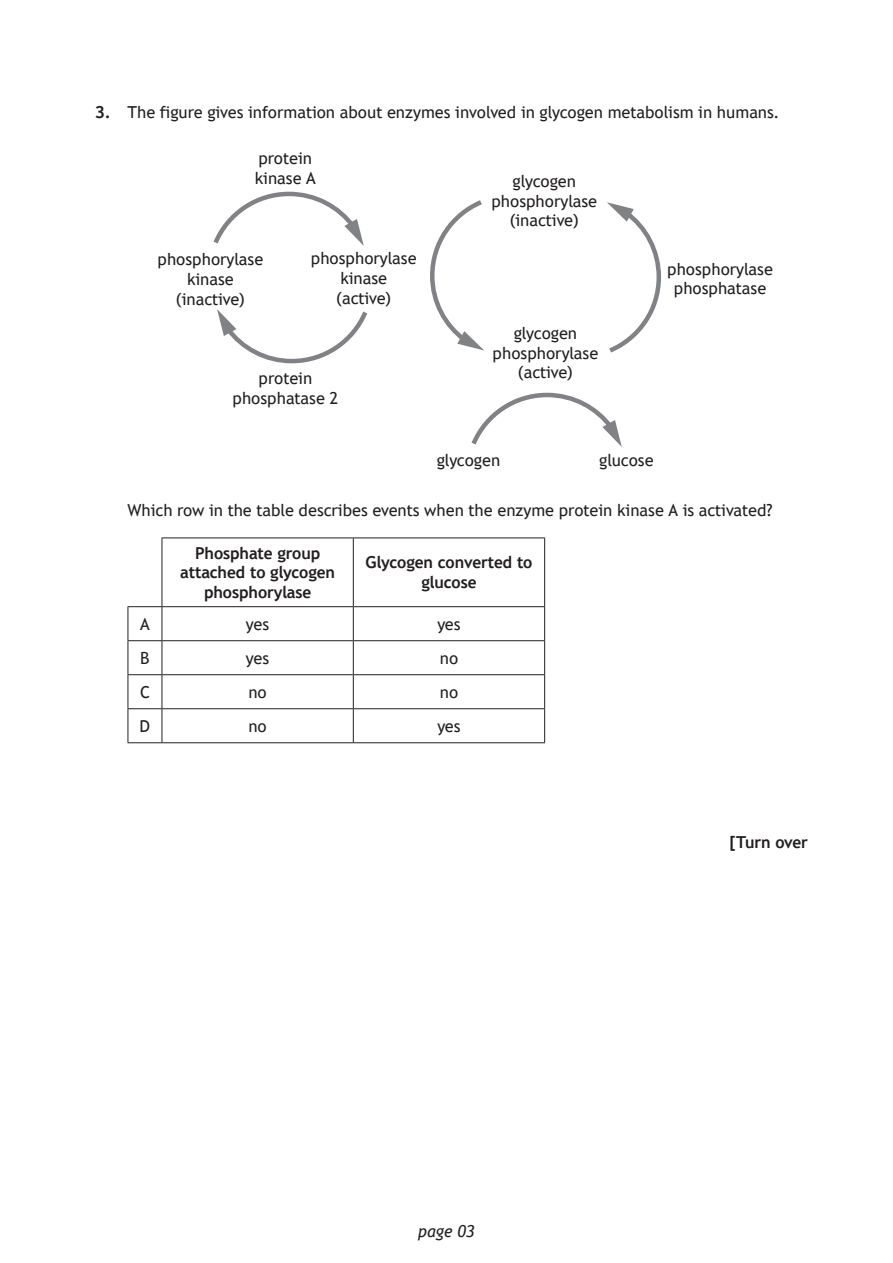
Selectable page text
3. The figure gives information about enzymes involved in glycogen metabolism in humans.

               protein
              kinase A                glycogen
                                    phosphorylase
                                      (inactive)

     phosphorylase  phosphorylase
                                                    phosphorylase
        kinase        kinase
                                                     phosphatase
       (inactive)     (active)
                                      glycogen
                                    phosphorylase
                                       (active)
               protein
            phosphatase 2
                               glycogen       glucose

   Which row in the table describes events when the enzyme protein kinase A is activated?

         Phosphate group
                         Glycogen converted to
        attached to glycogen
                              glucose
          phosphorylase
    A         yes              yes
    B         yes              no
    C         no               no

    D         no               yes

                                                          [Turn over

                             page 03
PDF page 4
Paper 1, Question 4Paper 1, Question 5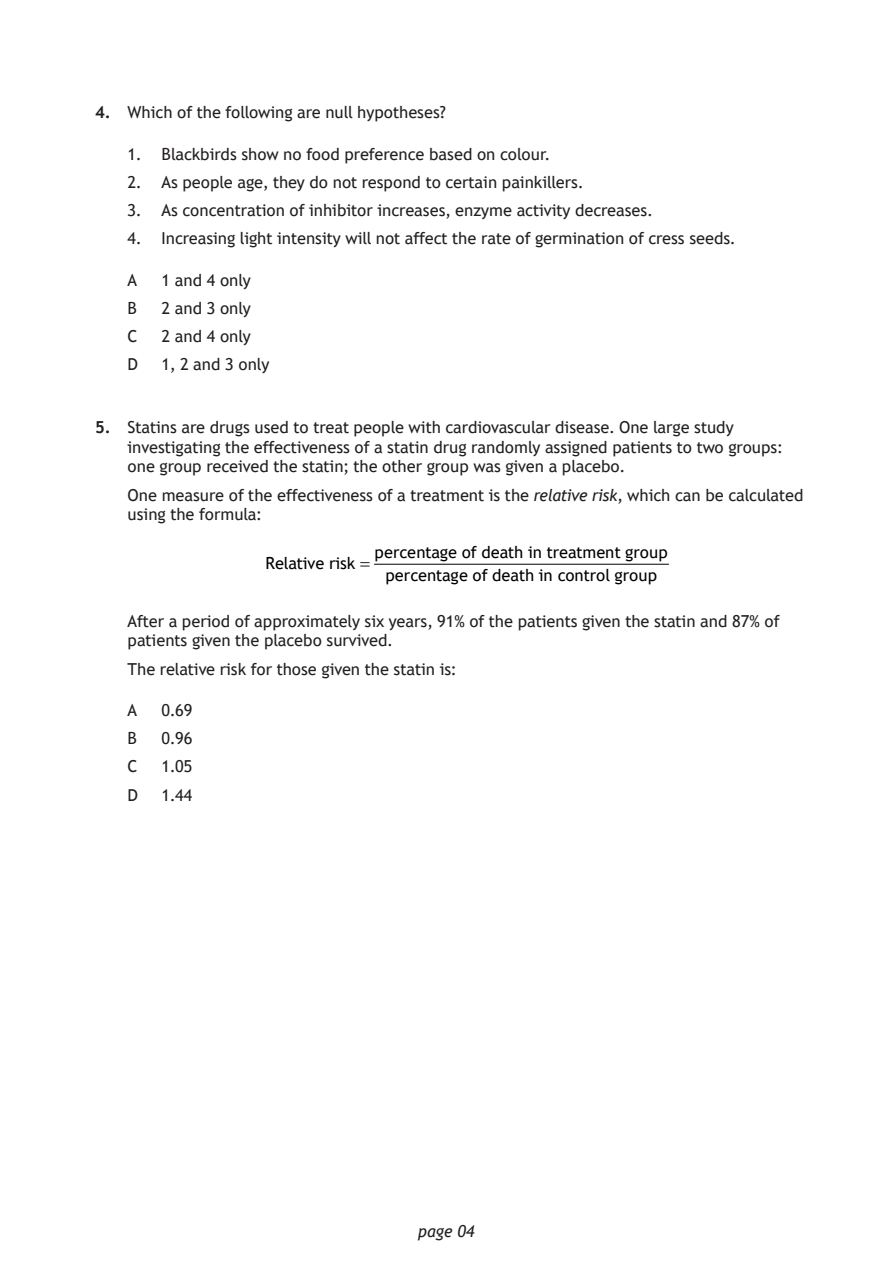
Selectable page text
4. Which of the following are null hypotheses?

   1. Blackbirds show no food preference based on colour.
   2. As people age, they do not respond to certain painkillers.
   3. As concentration of inhibitor increases, enzyme activity decreases.

   4. Increasing light intensity will not affect the rate of germination of cress seeds.

   A  1 and 4 only
   B  2 and 3 only

   C  2 and 4 only
   D  1, 2 and 3 only

5. Statins are drugs used to treat people with cardiovascular disease. One large study
   investigating the effectiveness of a statin drug randomly assigned patients to two groups:
   one group received the statin; the other group was given a placebo.
   One measure of the effectiveness of a treatment is the relative risk, which can be calculated
   using the formula:

                         percentage of death in treatment group
               Relative risk =
                          percentage of death in control group
   After a period of approximately six years, 91% of the patients given the statin and 87% of

   patients given the placebo survived.
   The relative risk for those given the statin is:

   A  0.69

   B  0.96
   C  1.05
   D  1.44

                             page 04
PDF page 5
Paper 1, Question 6Paper 1, Question 7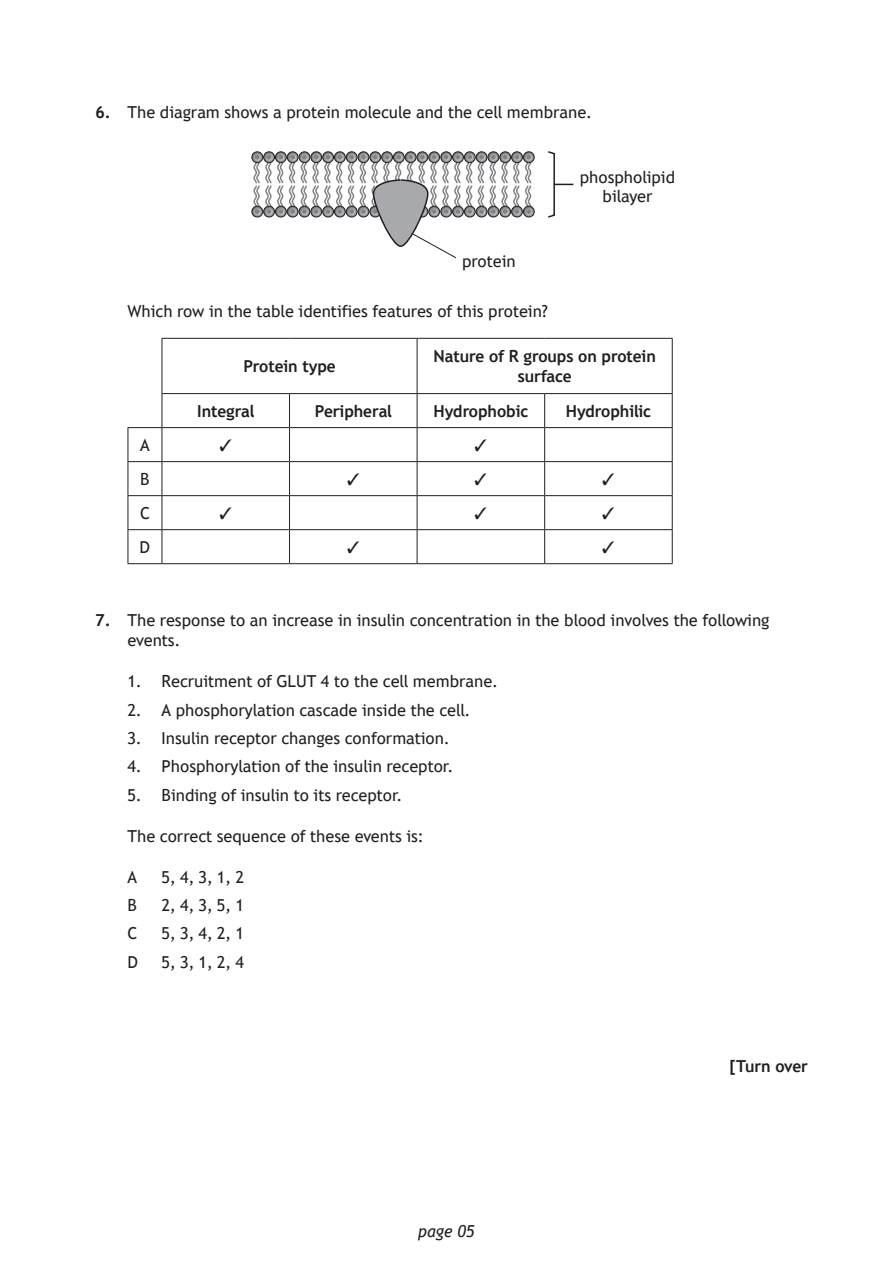
Selectable page text
6. The diagram shows a protein molecule and the cell membrane.

                                            phospholipid
                                              bilayer

                                 protein

   Which row in the table identifies features of this protein?

                               Nature of R groups on protein
             Protein type
                                       surface
         Integral   Peripheral Hydrophobic Hydrophilic
    A      ✓                       ✓

    B                  ✓           ✓          ✓

    C      ✓                       ✓          ✓

    D                  ✓                      ✓

7. The response to an increase in insulin concentration in the blood involves the following
   events.

   1. Recruitment of GLUT 4 to the cell membrane.
   2. A phosphorylation cascade inside the cell.

   3. Insulin receptor changes conformation.
   4. Phosphorylation of the insulin receptor.
   5. Binding of insulin to its receptor.

   The correct sequence of these events is:

   A  5, 4, 3, 1, 2
   B  2, 4, 3, 5, 1

   C  5, 3, 4, 2, 1
   D  5, 3, 1, 2, 4

                                                          [Turn over

                             page 05
PDF page 6
Paper 1, Question 8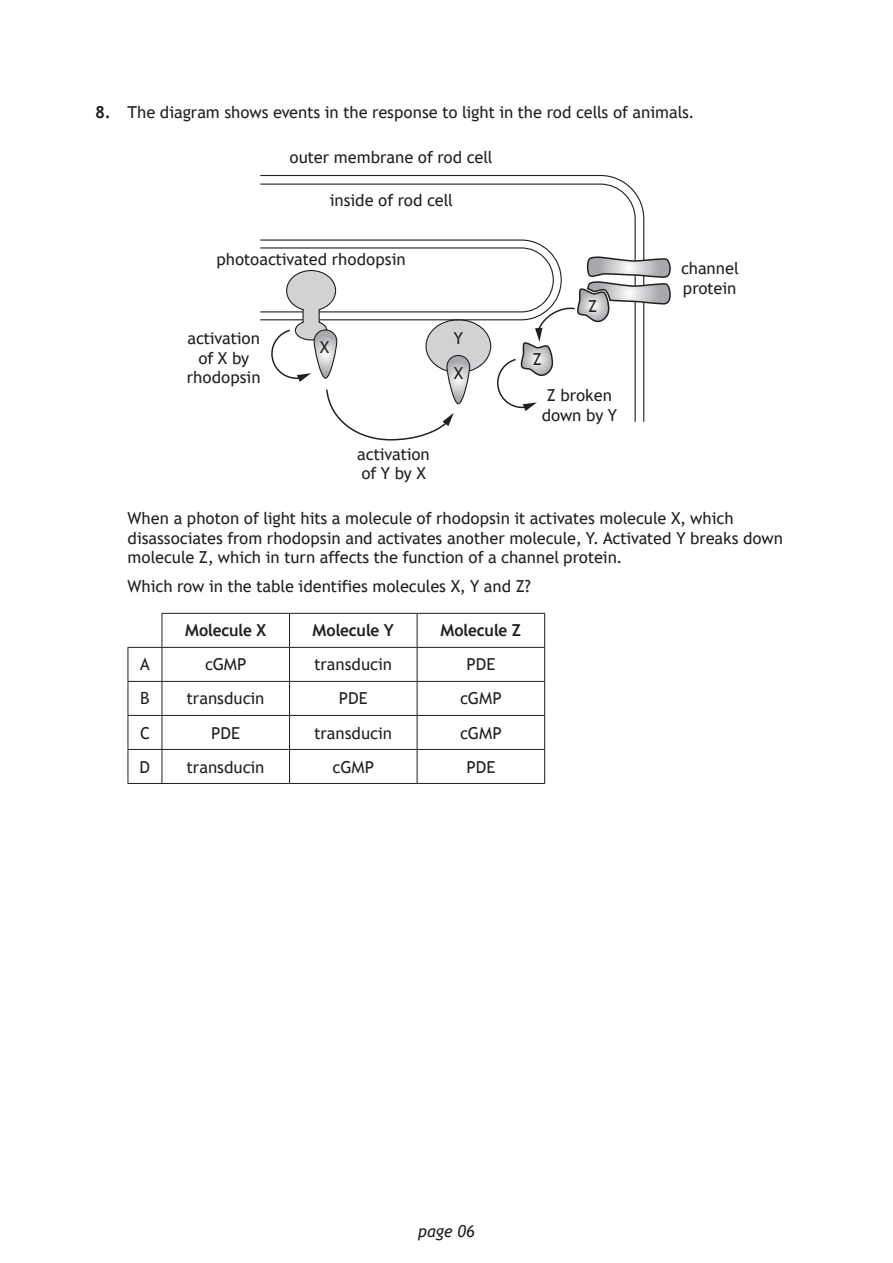
Selectable page text
8. The diagram shows events in the response to light in the rod cells of animals.

                  outer membrane of rod cell

                     inside of rod cell

           photoactivated rhodopsin
                                                      channel
                                                      protein
                                             Z
        activation               Y
                    X
         of X by                        Z
        rhodopsin                X
                                         Z broken
                                         down by Y
                        activation
                        of Y by X

   When a photon of light hits a molecule of rhodopsin it activates molecule X, which
   disassociates from rhodopsin and activates another molecule, Y. Activated Y breaks down
   molecule Z, which in turn affects the function of a channel protein.

   Which row in the table identifies molecules X, Y and Z?

        Molecule X  Molecule Y  Molecule Z

    A     cGMP      transducin    PDE
    B   transducin    PDE        cGMP

    C     PDE       transducin   cGMP

    D   transducin    cGMP        PDE

                             page 06
PDF page 7
Paper 1, Question 9Paper 1, Question 10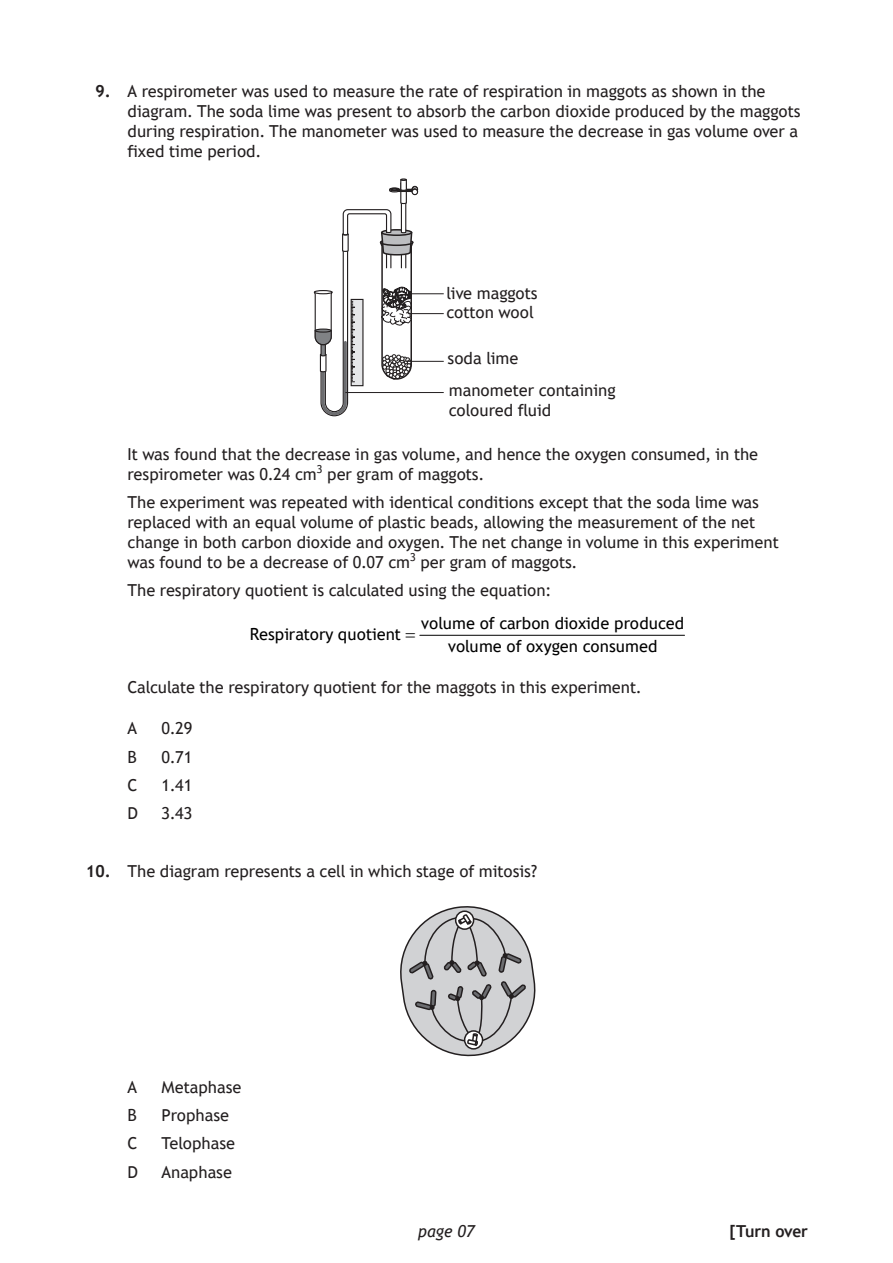
Selectable page text
9. A respirometer was used to measure the rate of respiration in maggots as shown in the
    diagram. The soda lime was present to absorb the carbon dioxide produced by the maggots
    during respiration. The manometer was used to measure the decrease in gas volume over a
    fixed time period.

                                 live maggots
                                 cotton wool

                                 soda lime

                                 manometer containing
                                 coloured fluid

    It was found that the decrease in gas volume, and hence the oxygen consumed, in the
    respirometer was 0.24 cm³ per gram of maggots.
    The experiment was repeated with identical conditions except that the soda lime was
    replaced with an equal volume of plastic beads, allowing the measurement of the net
    change in both carbon dioxide and oxygen. The net change in volume in this experiment
    was found to be a decrease of 0.07 cm³ per gram of maggots.

    The respiratory quotient is calculated using the equation:

                               volume of carbon dioxide produced
               Respiratory quotient =
                                 volume of oxygen consumed
    Calculate the respiratory quotient for the maggots in this experiment.

    A  0.29
    B  0.71

    C  1.41
    D  3.43

10. The diagram represents a cell in which stage of mitosis?

    A  Metaphase

    B  Prophase
    C  Telophase

    D  Anaphase

                              page 07                      [Turn over
PDF page 8
Paper 1, Question 11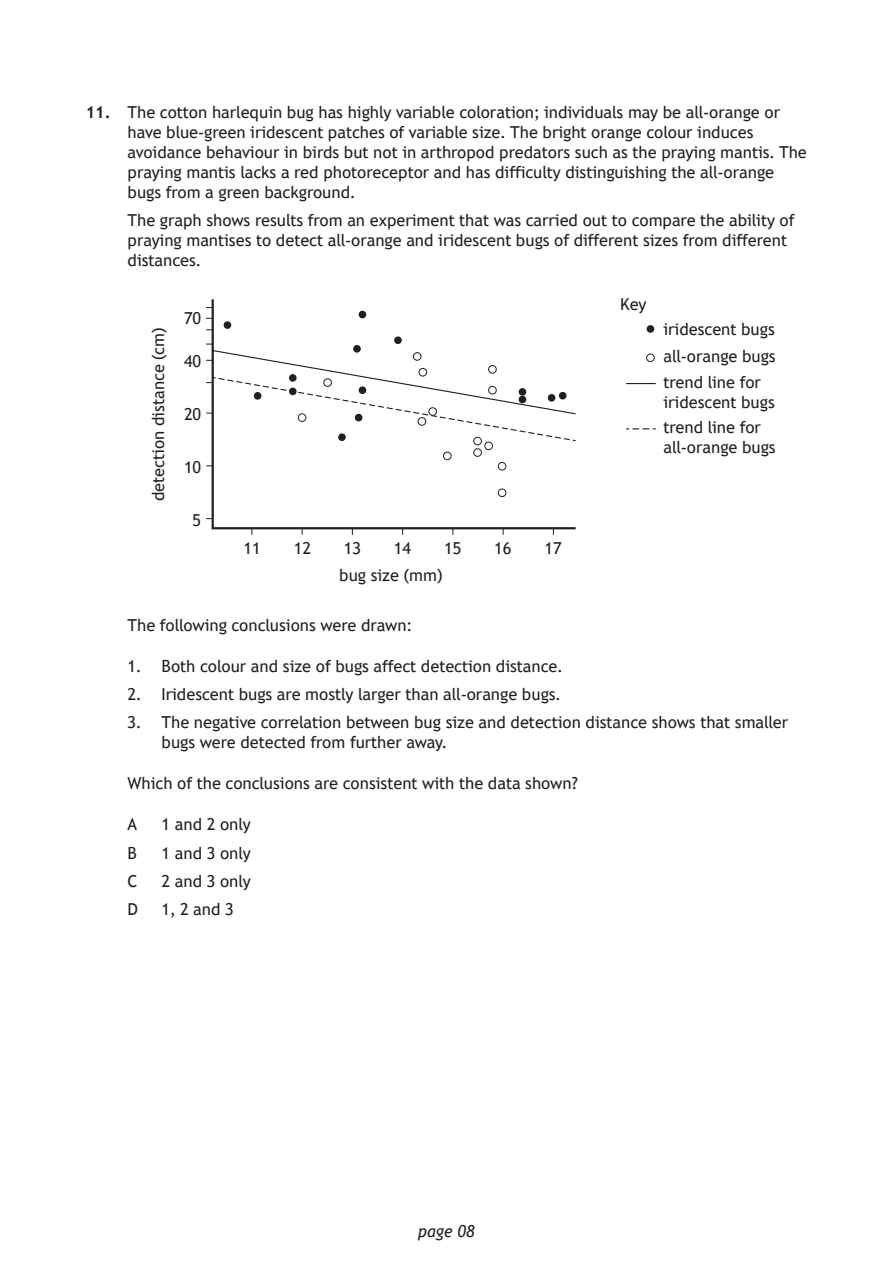
Selectable page text
11. The cotton harlequin bug has highly variable coloration; individuals may be all‑orange or
    have blue‑green iridescent patches of variable size. The bright orange colour induces
    avoidance behaviour in birds but not in arthropod predators such as the praying mantis. The
    praying mantis lacks a red photoreceptor and has difficulty distinguishing the all‑orange
    bugs from a green background.

    The graph shows results from an experiment that was carried out to compare the ability of
    praying mantises to detect all‑orange and iridescent bugs of different sizes from different
    distances.

                              page 08
      )mc(
      ecnatsid
      noitceted
                                                 Key
         70
                                                     iridescent bugs
                                                     all‑orange bugs
         40
                                                     trend line for
                                                     iridescent bugs
         20
                                                     trend line for
                                                     all‑orange bugs
         10
          5
              11   12   13  14   15  16   17
                       bug size (mm)
    The following conclusions were drawn:
    1. Both colour and size of bugs affect detection distance.
    2. Iridescent bugs are mostly larger than all‑orange bugs.
    3. The negative correlation between bug size and detection distance shows that smaller
       bugs were detected from further away.
    Which of the conclusions are consistent with the data shown?
    A  1 and 2 only
    B  1 and 3 only
    C  2 and 3 only
    D  1, 2 and 3
PDF page 9
Paper 1, Question 12Paper 1, Question 13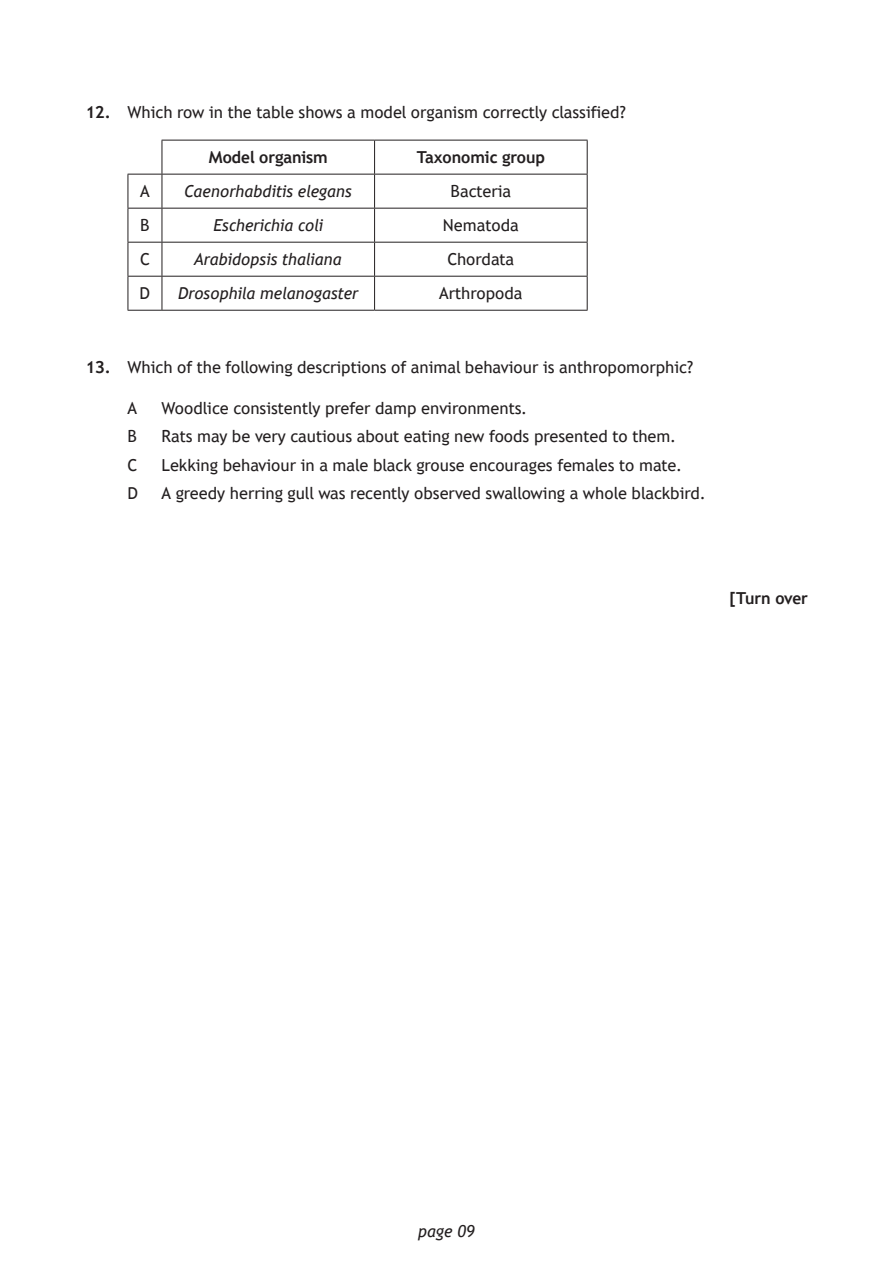
Selectable page text
12. Which row in the table shows a model organism correctly classified?

           Model organism     Taxonomic group
     A   Caenorhabditis elegans  Bacteria

     B      Escherichia coli     Nematoda

     C    Arabidopsis thaliana   Chordata

     D  Drosophila melanogaster Arthropoda

13. Which of the following descriptions of animal behaviour is anthropomorphic?

    A  Woodlice consistently prefer damp environments.
    B  Rats may be very cautious about eating new foods presented to them.
    C  Lekking behaviour in a male black grouse encourages females to mate.

    D  A greedy herring gull was recently observed swallowing a whole blackbird.

                                                           [Turn over

                              page 09
PDF page 10
Paper 1, Question 14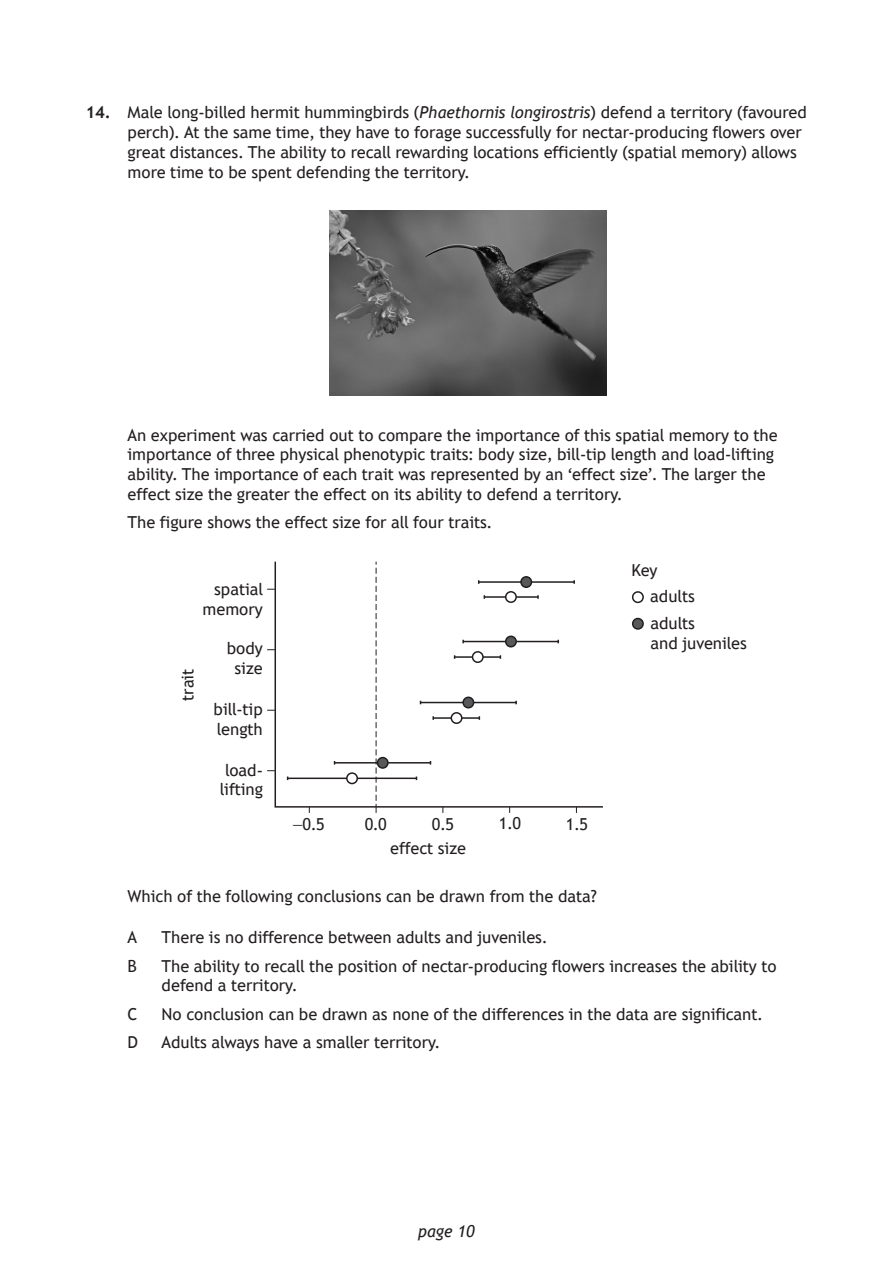
Selectable page text
14. Male long‑billed hermit hummingbirds (Phaethornis longirostris) defend a territory (favoured
    perch). At the same time, they have to forage successfully for nectar‑producing flowers over
    great distances. The ability to recall rewarding locations efficiently (spatial memory) allows
    more time to be spent defending the territory.

    An experiment was carried out to compare the importance of this spatial memory to the
    importance of three physical phenotypic traits: body size, bill‑tip length and load‑lifting
    ability. The importance of each trait was represented by an ‘effect size’. The larger the
    effect size the greater the effect on its ability to defend a territory.
    The figure shows the effect size for all four traits.

            spatial
           memory

             body
              size

            bill‑tip
            length

             load‑
            lifting

                              page 10
         tiart
                                                  Key
                                                    adults
                                                    adults
                                                    and juveniles
                   −0.5   0.0   0.5   1.0   1.5
                            effect size
    Which of the following conclusions can be drawn from the data?
    A  There is no difference between adults and juveniles.
    B  The ability to recall the position of nectar‑producing flowers increases the ability to
       defend a territory.
    C  No conclusion can be drawn as none of the differences in the data are significant.
    D  Adults always have a smaller territory.
PDF page 11
Paper 1, Question 15Paper 1, Question 16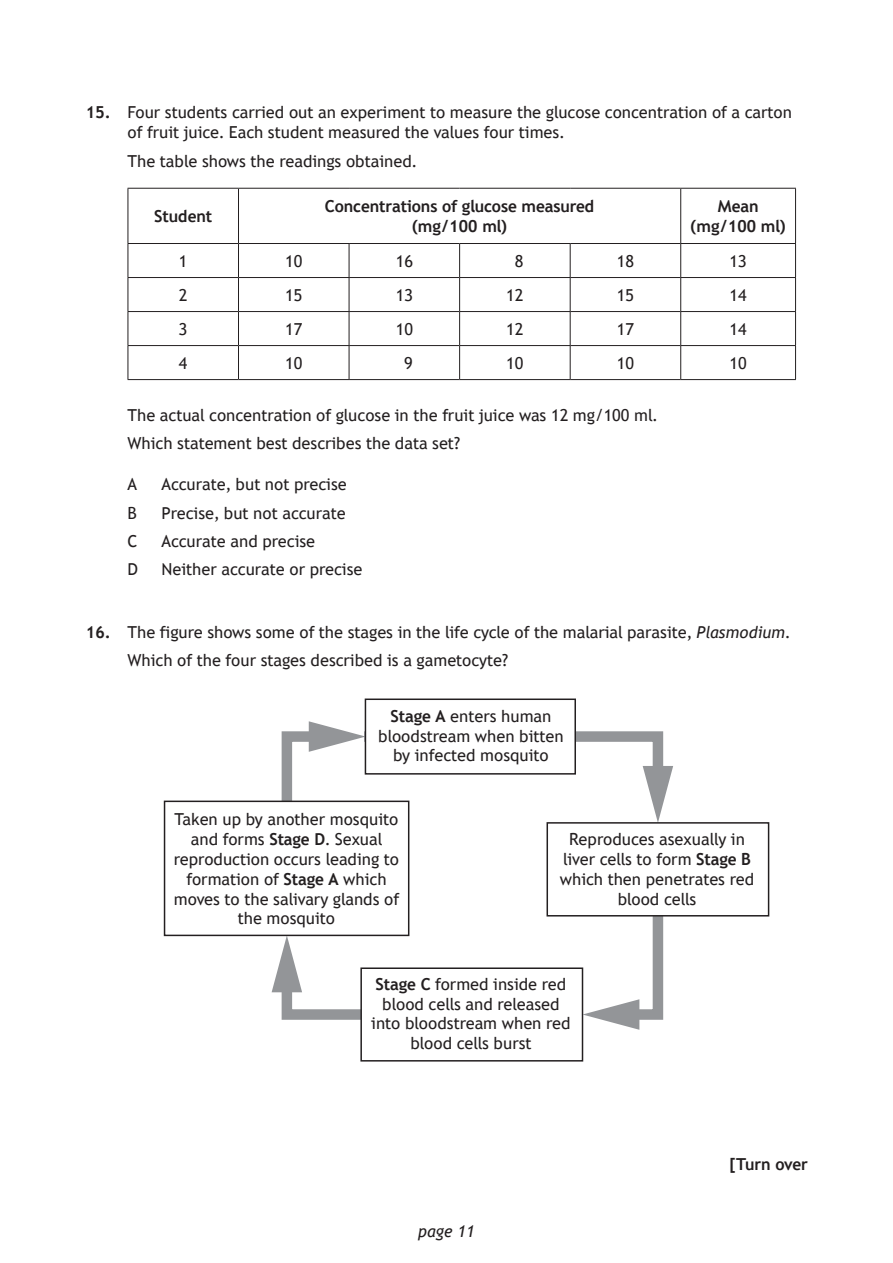
Selectable page text
15. Four students carried out an experiment to measure the glucose concentration of a carton
    of fruit juice. Each student measured the values four times.

    The table shows the readings obtained.

                      Concentrations of glucose measured  Mean
      Student
                              (mg/100 ml)              (mg/100 ml)
        1         10        16         8         18        13

        2         15        13         12        15        14

        3         17        10         12        17        14
        4         10         9         10        10        10

    The actual concentration of glucose in the fruit juice was 12 mg/100 ml.
    Which statement best describes the data set?

    A  Accurate, but not precise
    B  Precise, but not accurate
    C  Accurate and precise

    D  Neither accurate or precise

16. The figure shows some of the stages in the life cycle of the malarial parasite, Plasmodium.

    Which of the four stages described is a gametocyte?

                            Stage A enters human
                           bloodstream when bitten
                            by infected mosquito

        Taken up by another mosquito
          and forms Stage D. Sexual         Reproduces asexually in
        reproduction occurs leading to      liver cells to form Stage B
         formation of Stage A which        which then penetrates red
        moves to the salivary glands of          blood cells
              the mosquito

                           Stage C formed inside red
                           blood cells and released
                          into bloodstream when red
                              blood cells burst

                                                           [Turn over

                              page 11
PDF page 12
Paper 1, Question 17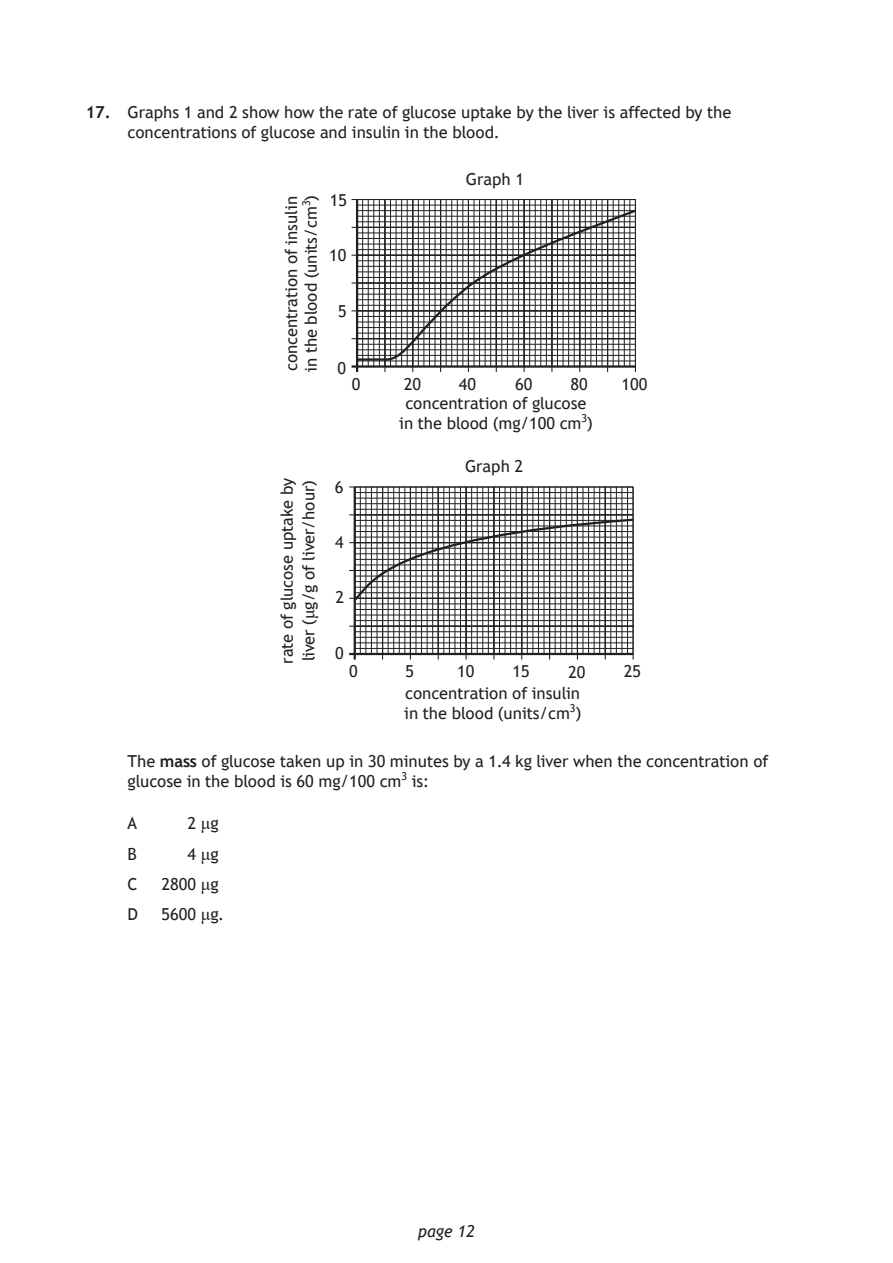
Selectable page text
17. Graphs 1 and 2 show how the rate of glucose uptake by the liver is affected by the
    concentrations of glucose and insulin in the blood.

                              page 12
                  nilusni
                  fo
                  noitartnecnoc
                    )3mc/stinu(
                    doolb
                    eht
                    ni
                                   Graph 1
                      15
                      10
                       5
                       0
                        0    20   40   60   80   100
                             concentration of glucose
                             in the blood (mg/100 cm³)
                                   Graph 2
                             concentration of insulin
                             in the blood (units/cm³)
                  yb
                  ekatpu
                  esoculg
                  fo
                  etar
                    )ruoh/revil
                    fo
                    g/gμ(
                    revil
                       6
                       4
                       2
                       0
                        0    5    10   15   20   25
    The mass of glucose taken up in 30 minutes by a 1.4 kg liver when the concentration of
    glucose in the blood is 60 mg/100 cm³ is:
    A    2 μg
    B    4 μg
    C  2800 μg
    D  5600 μg.
PDF page 13
Paper 1, Question 18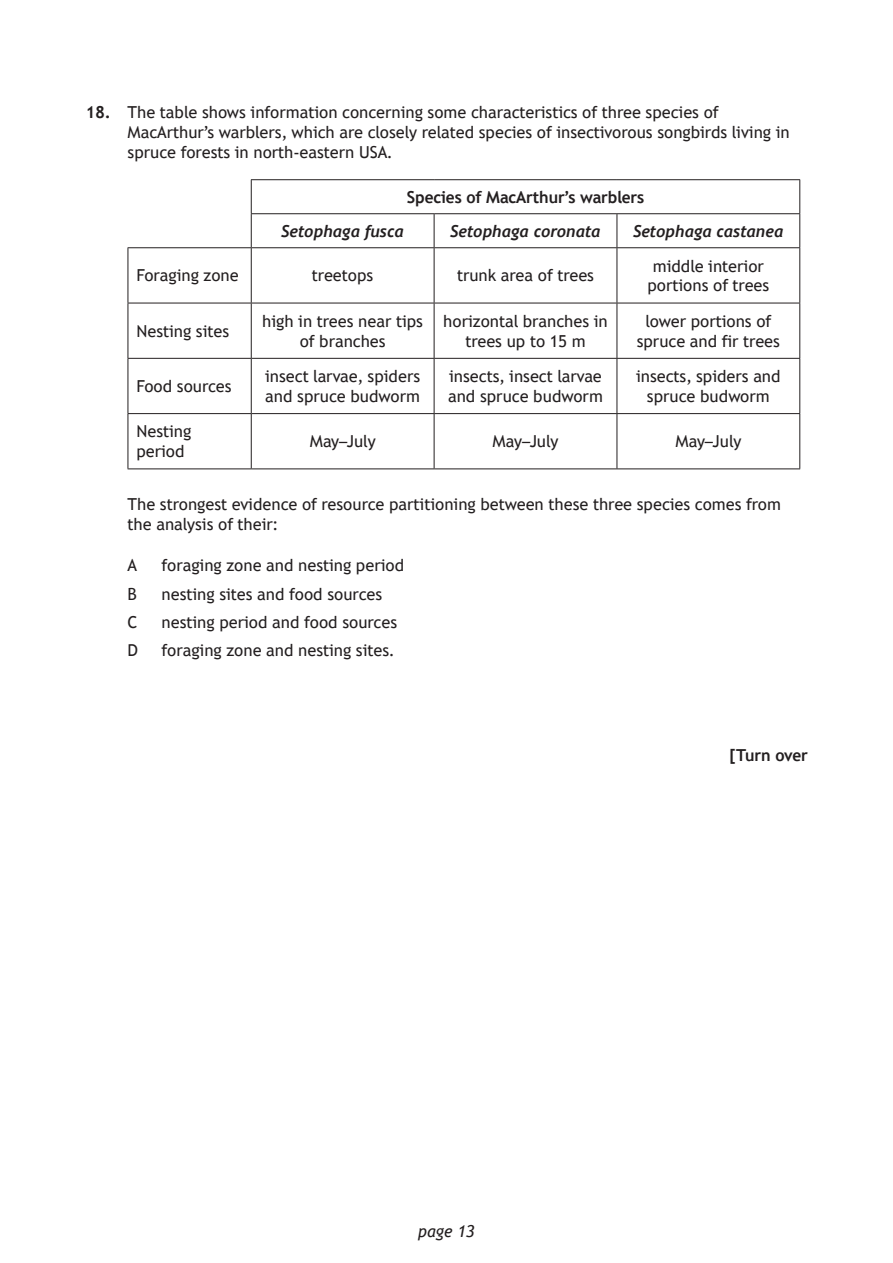
Selectable page text
18. The table shows information concerning some characteristics of three species of
    MacArthur’s warblers, which are closely related species of insectivorous songbirds living in
    spruce forests in north‑eastern USA.

                             Species of MacArthur’s warblers

                  Setophaga fusca Setophaga coronata Setophaga castanea
                                                    middle interior
     Foraging zone   treetops     trunk area of trees
                                                    portions of trees
                high in trees near tips horizontal branches in lower portions of
     Nesting sites
                    of branches    trees up to 15 m spruce and fir trees
                insect larvae, spiders insects, insect larvae insects, spiders and
     Food sources
                and spruce budworm and spruce budworm spruce budworm
     Nesting
                    May–July         May–July         May–July
     period

    The strongest evidence of resource partitioning between these three species comes from
    the analysis of their:

    A  foraging zone and nesting period
    B  nesting sites and food sources

    C  nesting period and food sources
    D  foraging zone and nesting sites.

                                                           [Turn over

                              page 13
PDF page 14
Paper 1, Question 19Paper 1, Question 20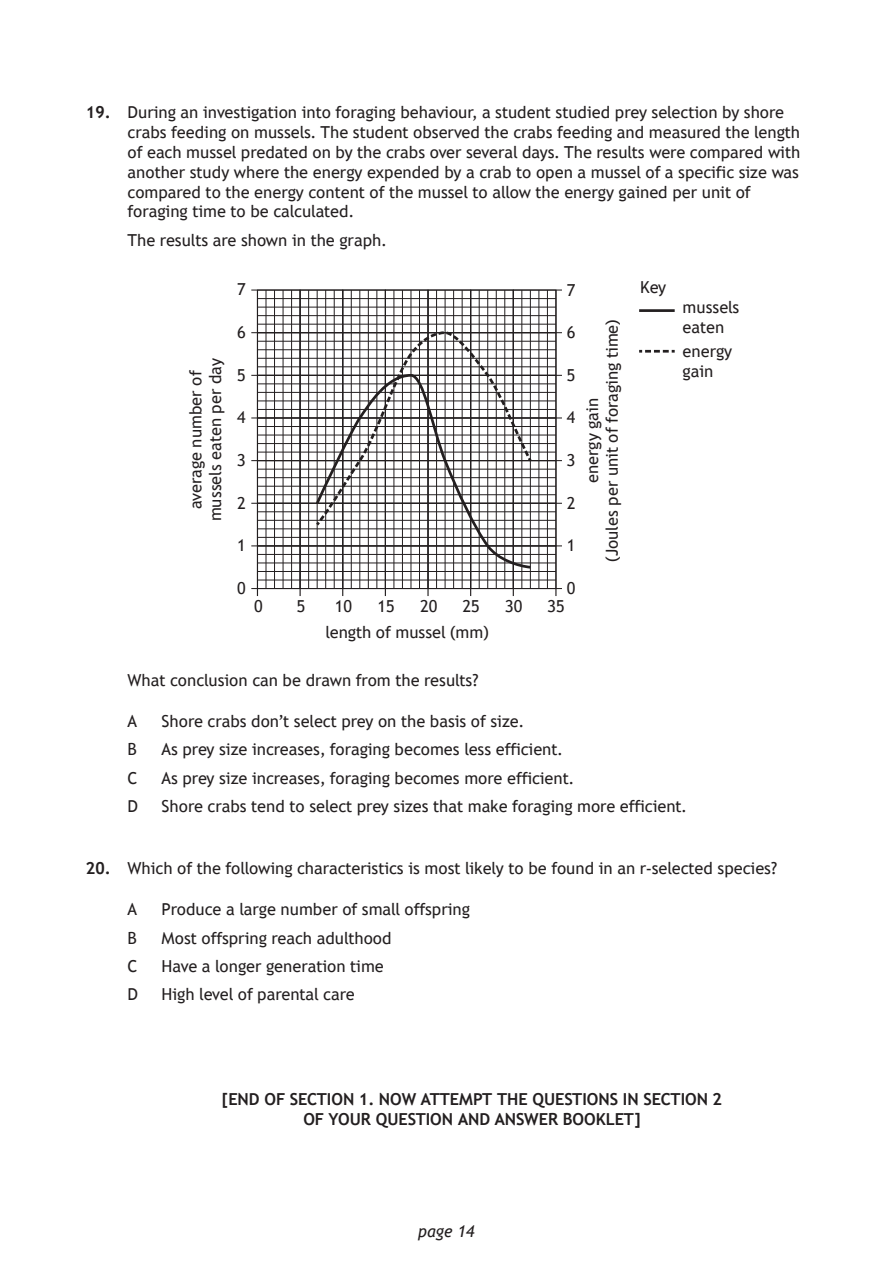
Selectable page text
19. During an investigation into foraging behaviour, a student studied prey selection by shore
    crabs feeding on mussels. The student observed the crabs feeding and measured the length
    of each mussel predated on by the crabs over several days. The results were compared with
    another study where the energy expended by a crab to open a mussel of a specific size was
    compared to the energy content of the mussel to allow the energy gained per unit of

    foraging time to be calculated.
    The results are shown in the graph.

                              page 14
         fo
         rebmun
         egareva
           yad
           rep
           netae
           slessum
                      length of mussel (mm)
                                              niag
                                              ygrene
                                                )emit
                                                gnigarof
                                                fo
                                                tinu
                                                rep
                                                seluoJ(
              7                             7      Key
                                                       mussels
                                                       eaten
              6                             6
                                                       energy
              5                             5          gain
              4                             4
              3                             3
              2                             2
              1                             1
              0                             0
               0   5   10  15  20  25 30  35
    What conclusion can be drawn from the results?
    A  Shore crabs don’t select prey on the basis of size.
    B  As prey size increases, foraging becomes less efficient.
    C  As prey size increases, foraging becomes more efficient.
    D  Shore crabs tend to select prey sizes that make foraging more efficient.
20. Which of the following characteristics is most likely to be found in an r‑selected species?
    A  Produce a large number of small offspring
    B  Most offspring reach adulthood
    C  Have a longer generation time
    D  High level of parental care
            [END OF SECTION 1. NOW ATTEMPT THE QUESTIONS IN SECTION 2
                    OF YOUR QUESTION AND ANSWER BOOKLET]
PDF page 15

Selectable page text
[BLANK PAGE]

DO NOT WRITE ON THIS PAGE

       page 15
PDF page 16

Selectable page text
[BLANK PAGE]

                       DO NOT WRITE ON THIS PAGE

Acknowledgement of copyright
Question 14 Ondrej Prosicky/shutterstock.com

                              page 16